The Bearish Engulfing Pattern
The bearish engulfing pattern is a candlestick pattern which can be used by traders to identify potential short-selling opportunities in the market.
In this article, we will examine the pattern in detail, explain how it can be traded and what to consider before entering the market. We will also explore why it’s important to combine this pattern with other technical analysis tools and a sound risk management strategy.
The information in this article is provided for educational purposes only and does not constitute financial advice. Consult a financial advisor before making investment decisions.
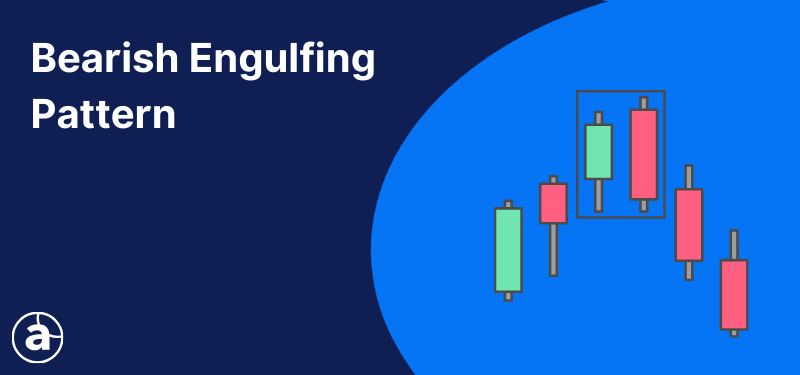
Table of Contents
Understanding the Bearish Engulfing Pattern
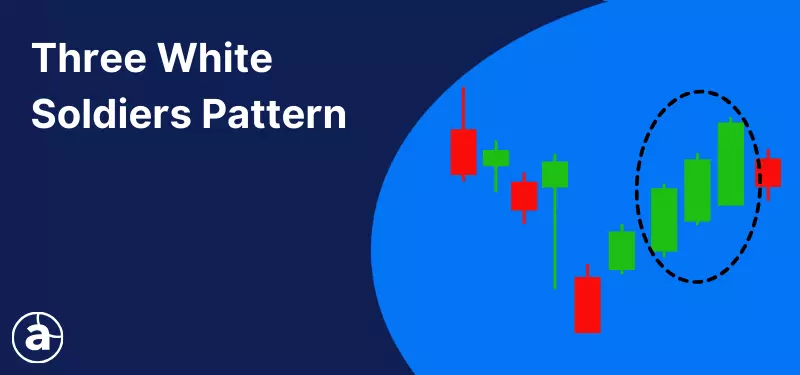
The bearish engulfing pattern is a type of candlestick pattern which appears during an uptrend and signals a potential bearish reversal.
Definition and Visual
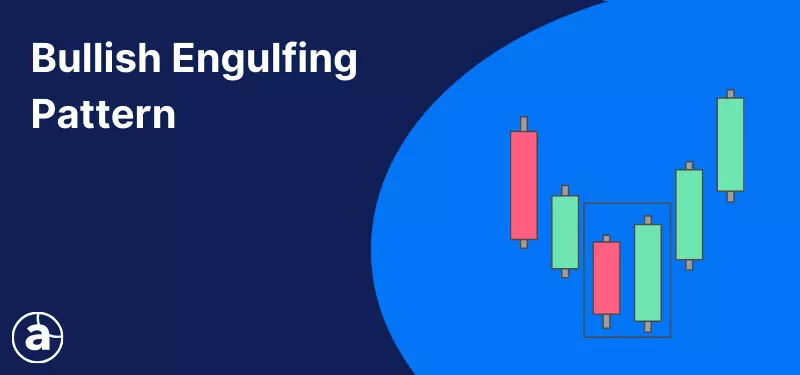
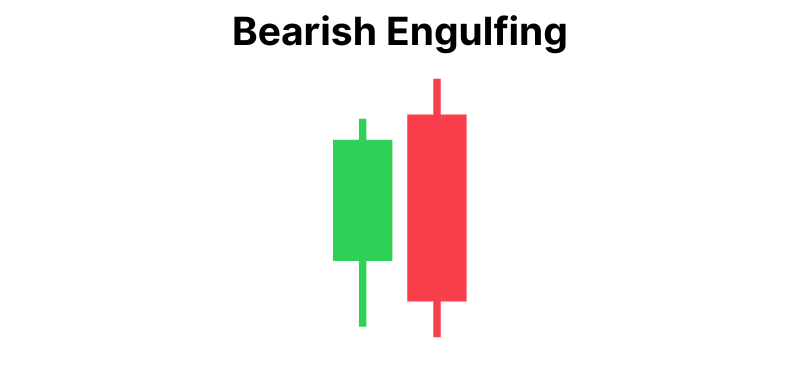
The bearish engulfing pattern consists of two candles, the first candle is bullish whilst the second is bearish.
The second candlestick opens higher than the close of the first candlestick and closes lower than its open. Consequently, the body of the second candle completely covers, or engulfs, the body of the first candle, as shown in the image below.
When it appears at the top of an uptrend, the large bearish candle engulfing the previous bullish candle indicates that sentiment may have shifted. In one session, sellers have managed to erase the gains of the previous session.
This indicates that the previous upward movement may be fizzling out and that sellers could be about to seize control of the market.
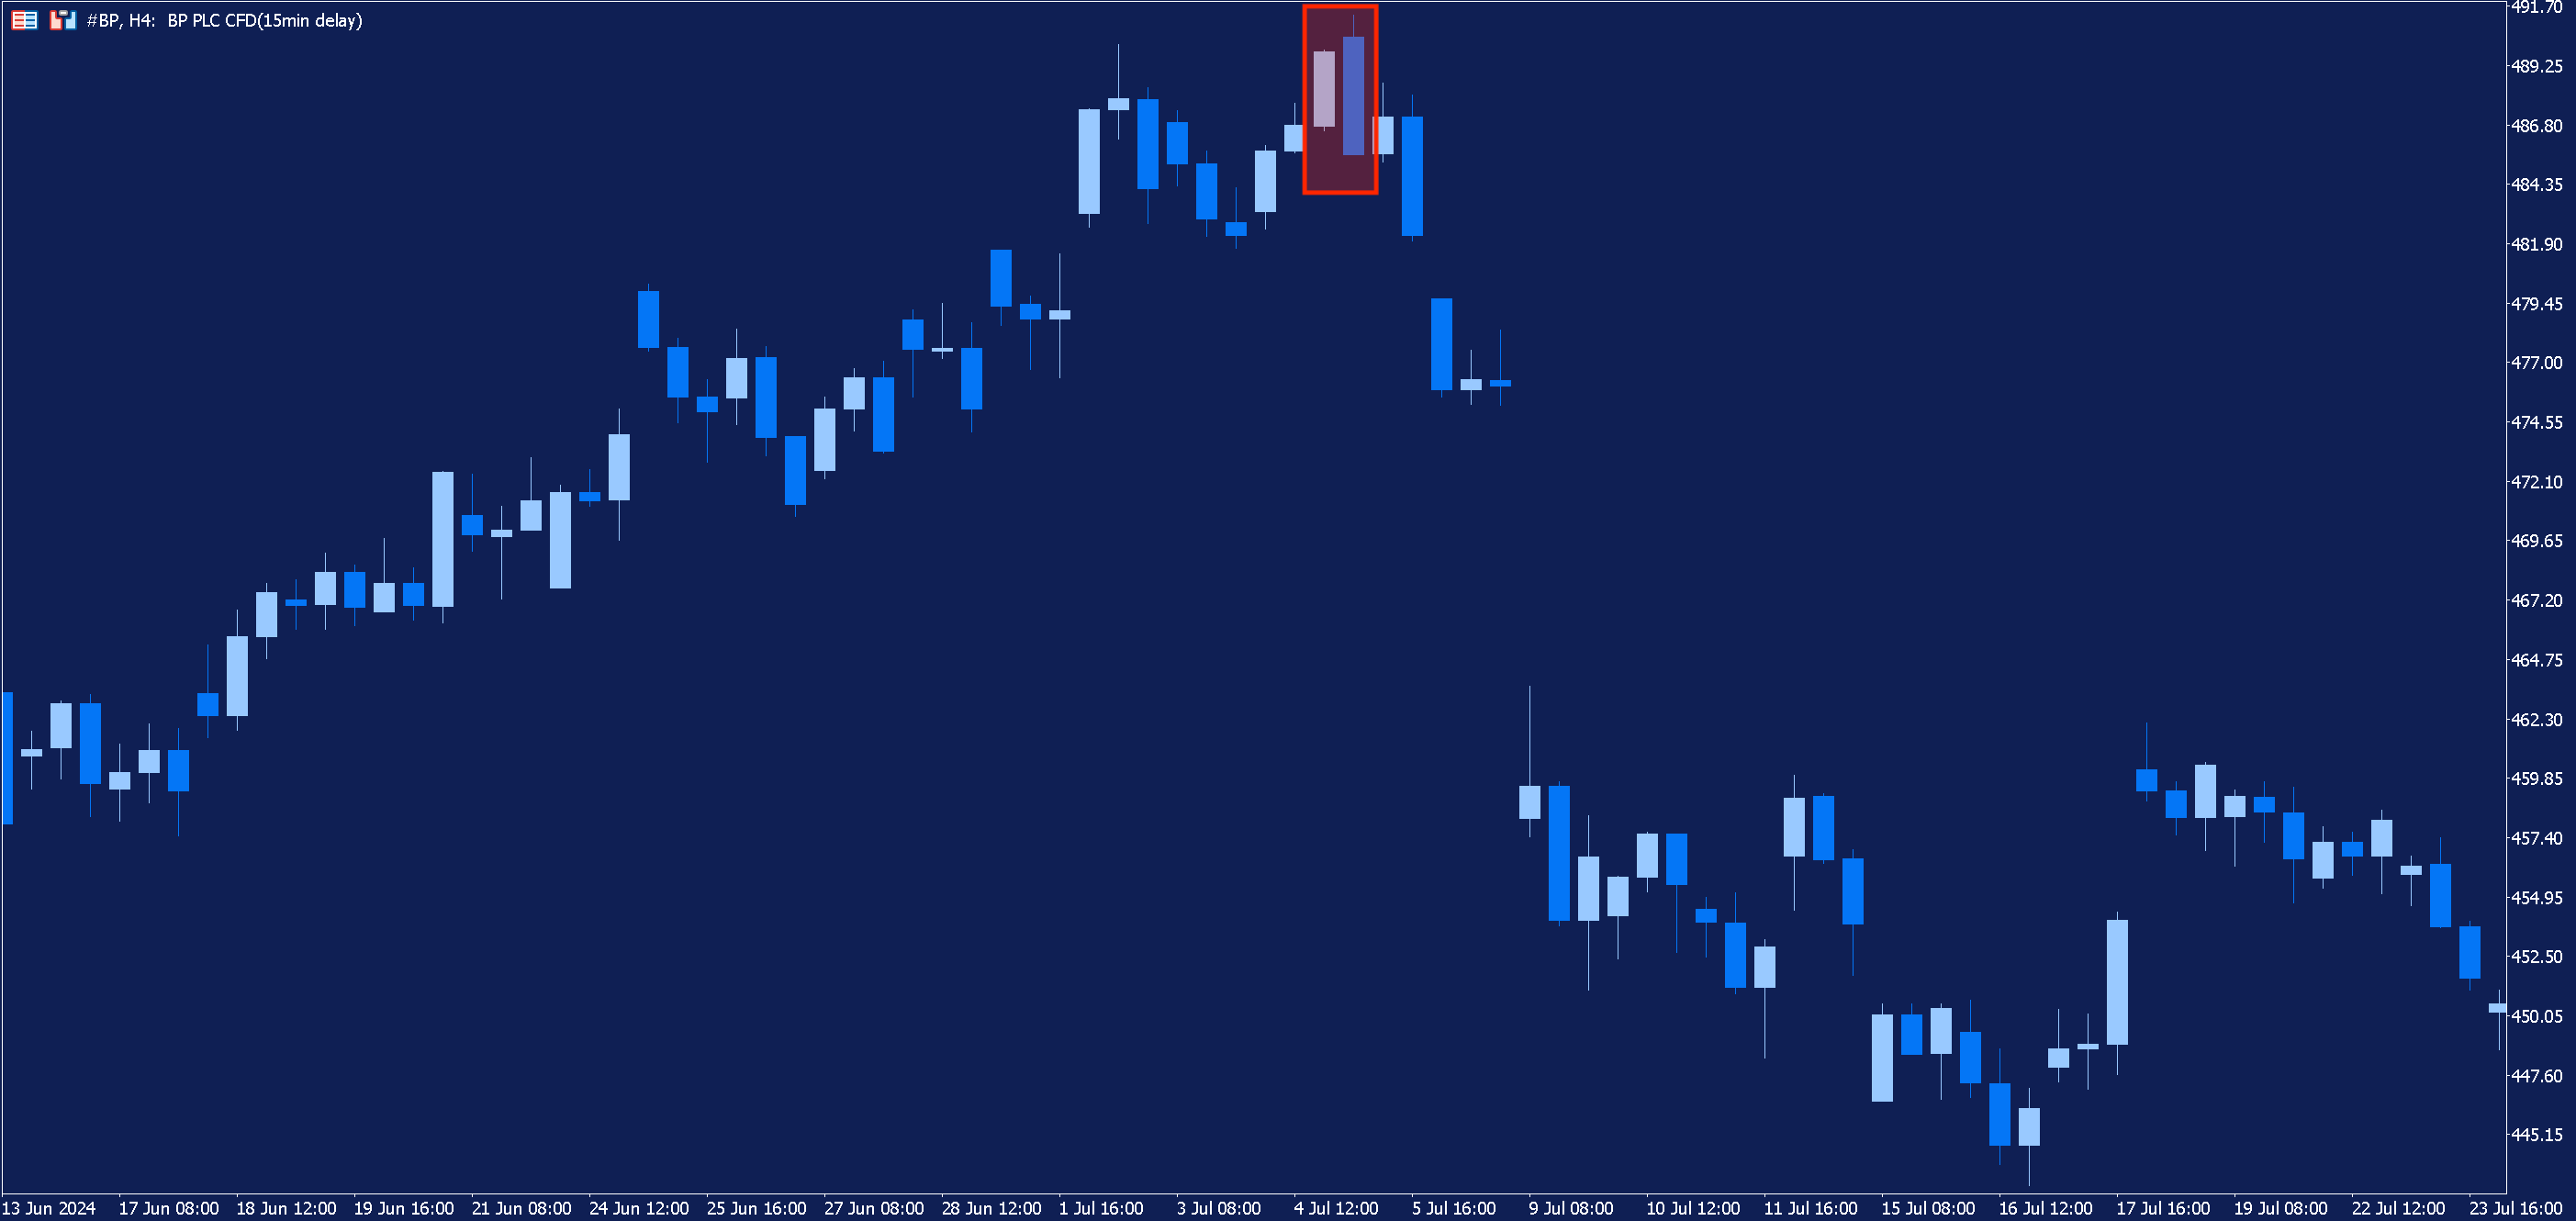
Below is an example of the bearish engulfing pattern occurring in the four-hour chart of UK oil stock BP. Its appearance follows an upward price movement and precedes a sudden reversal.
Reliability
Although some traders may consider the bearish engulfing pattern to be a reliable indicator of a price reversal on its own, it can produce false signals. Consequently, it is wise for traders to seek additional confirmation of a price reversal before entering the market. This can be done using other technical analysis tools, such as technical indicators.
Confirmation Signals & Trading Strategies
Let’s look at an example of how to seek confirmation of the bearish engulfing pattern before entering a trade using technical indicators.
Indicators
There are a number of technical indicators which traders can use to look for evidence of an imminent price reversal. These include the Relative Strength Index (RSI), MACD, Stochastic Oscillator and the Commodity Channel Index (CCI).
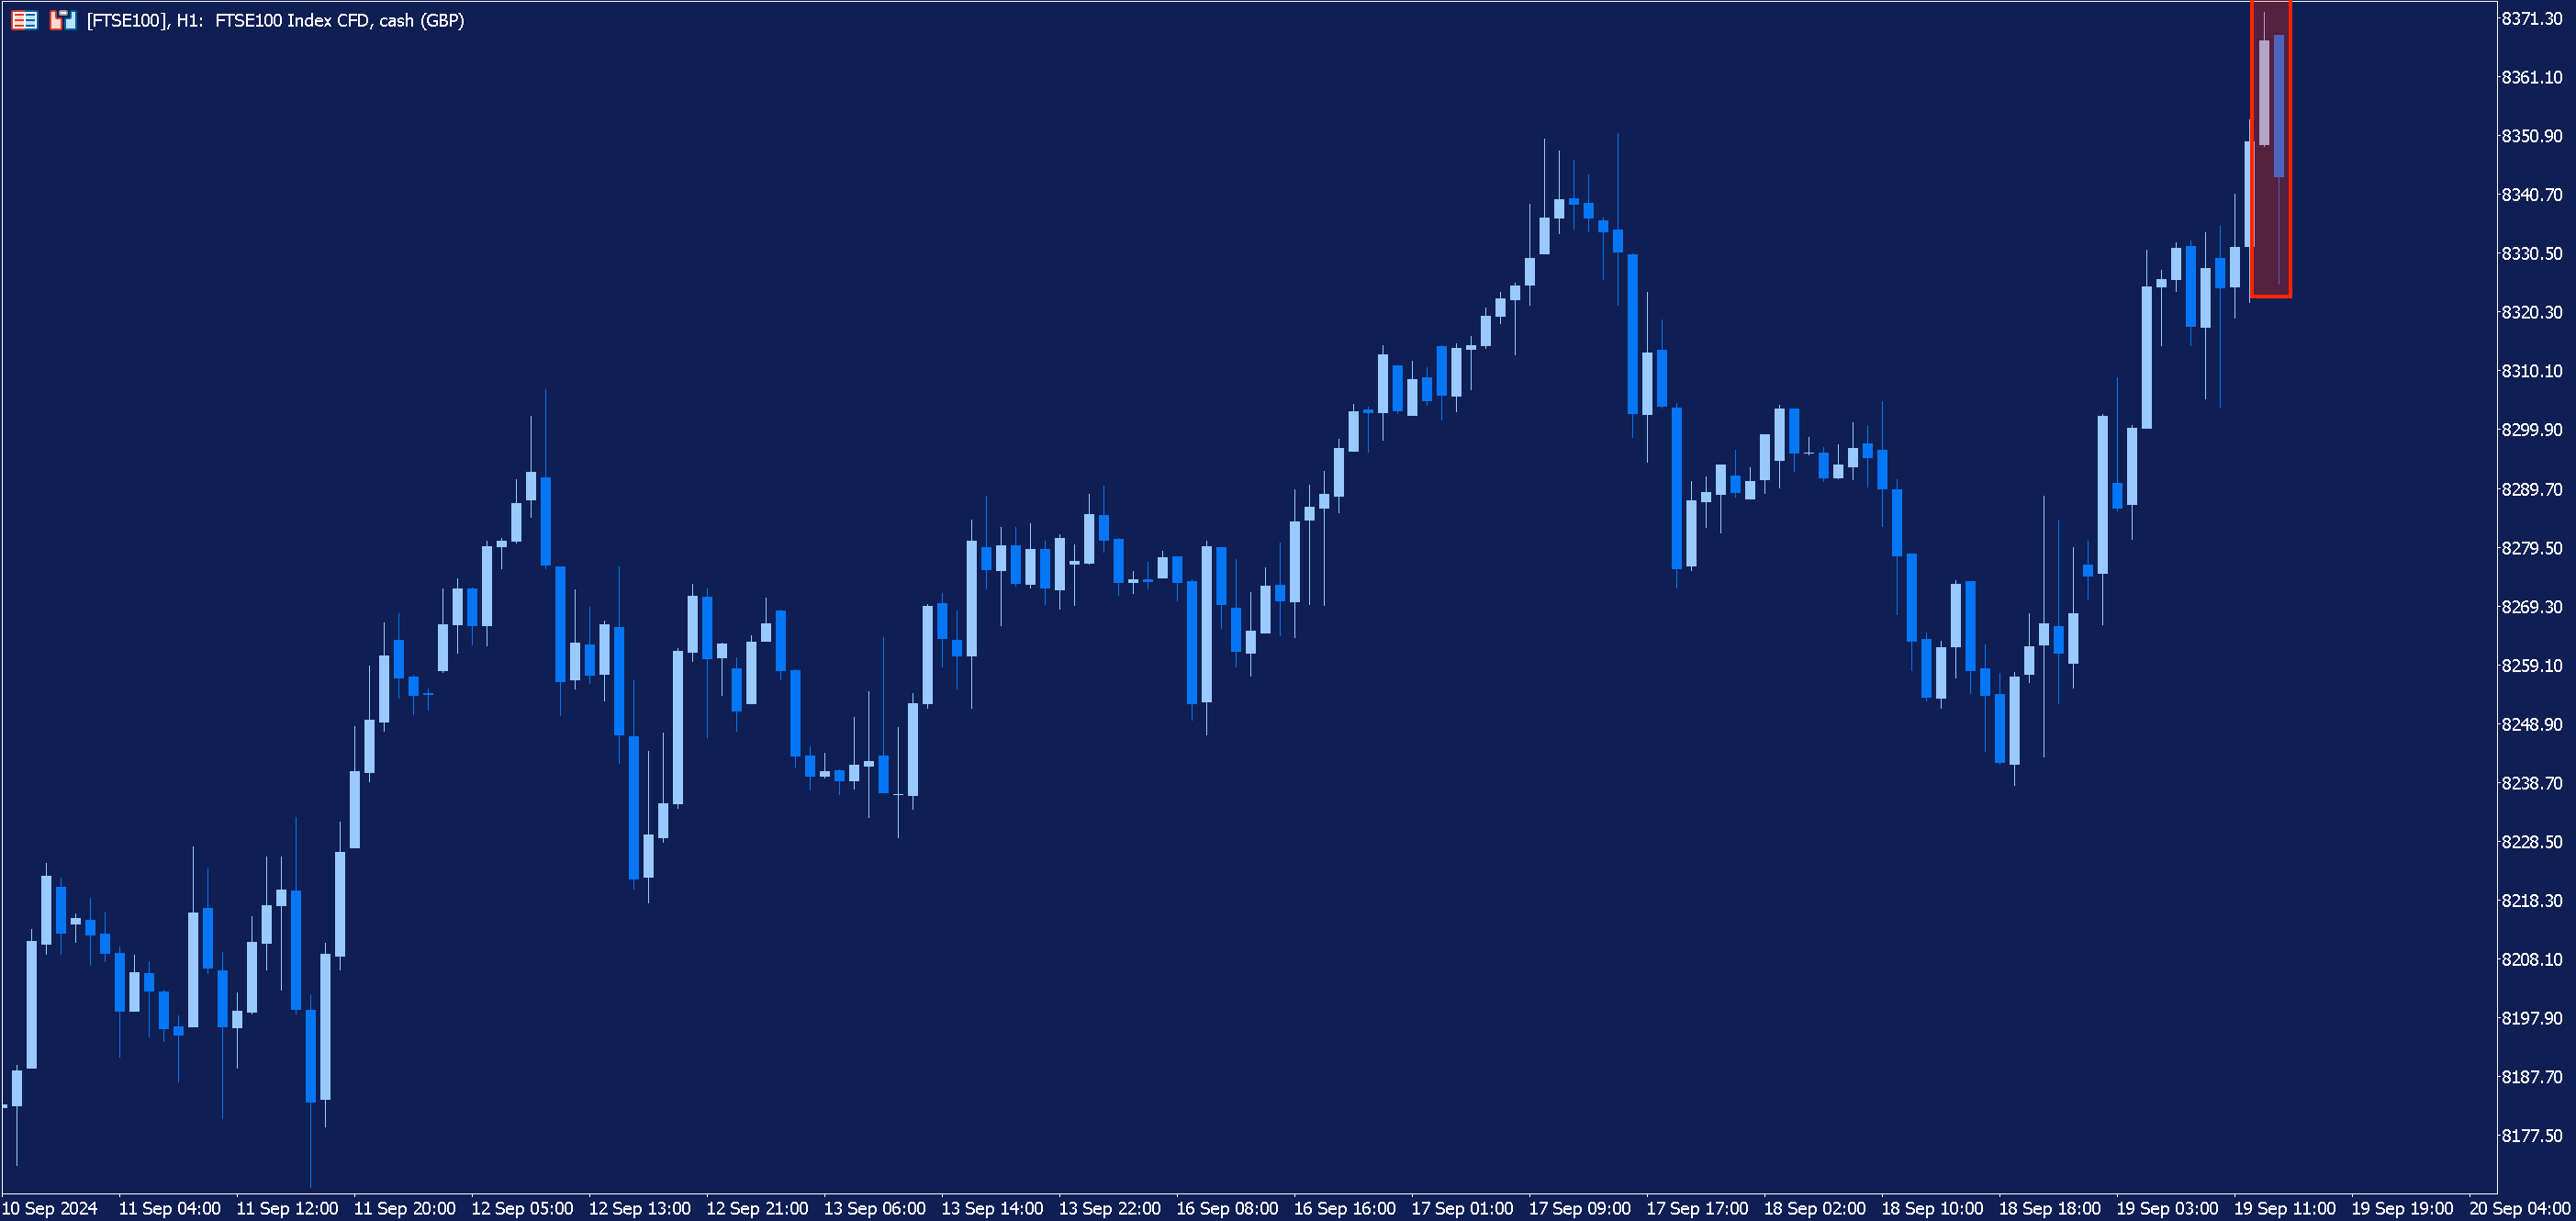
In the hourly chart of the FTSE 100 above, we can see that, following an uptrend, a bearish engulfing pattern forms.
Rather than jumping straight into a short position, let’s look for additional confirmation of a potential reversal by using a technical indicator. In the chart below, we have zoomed in and added the Commodity Channel Index (CCI).
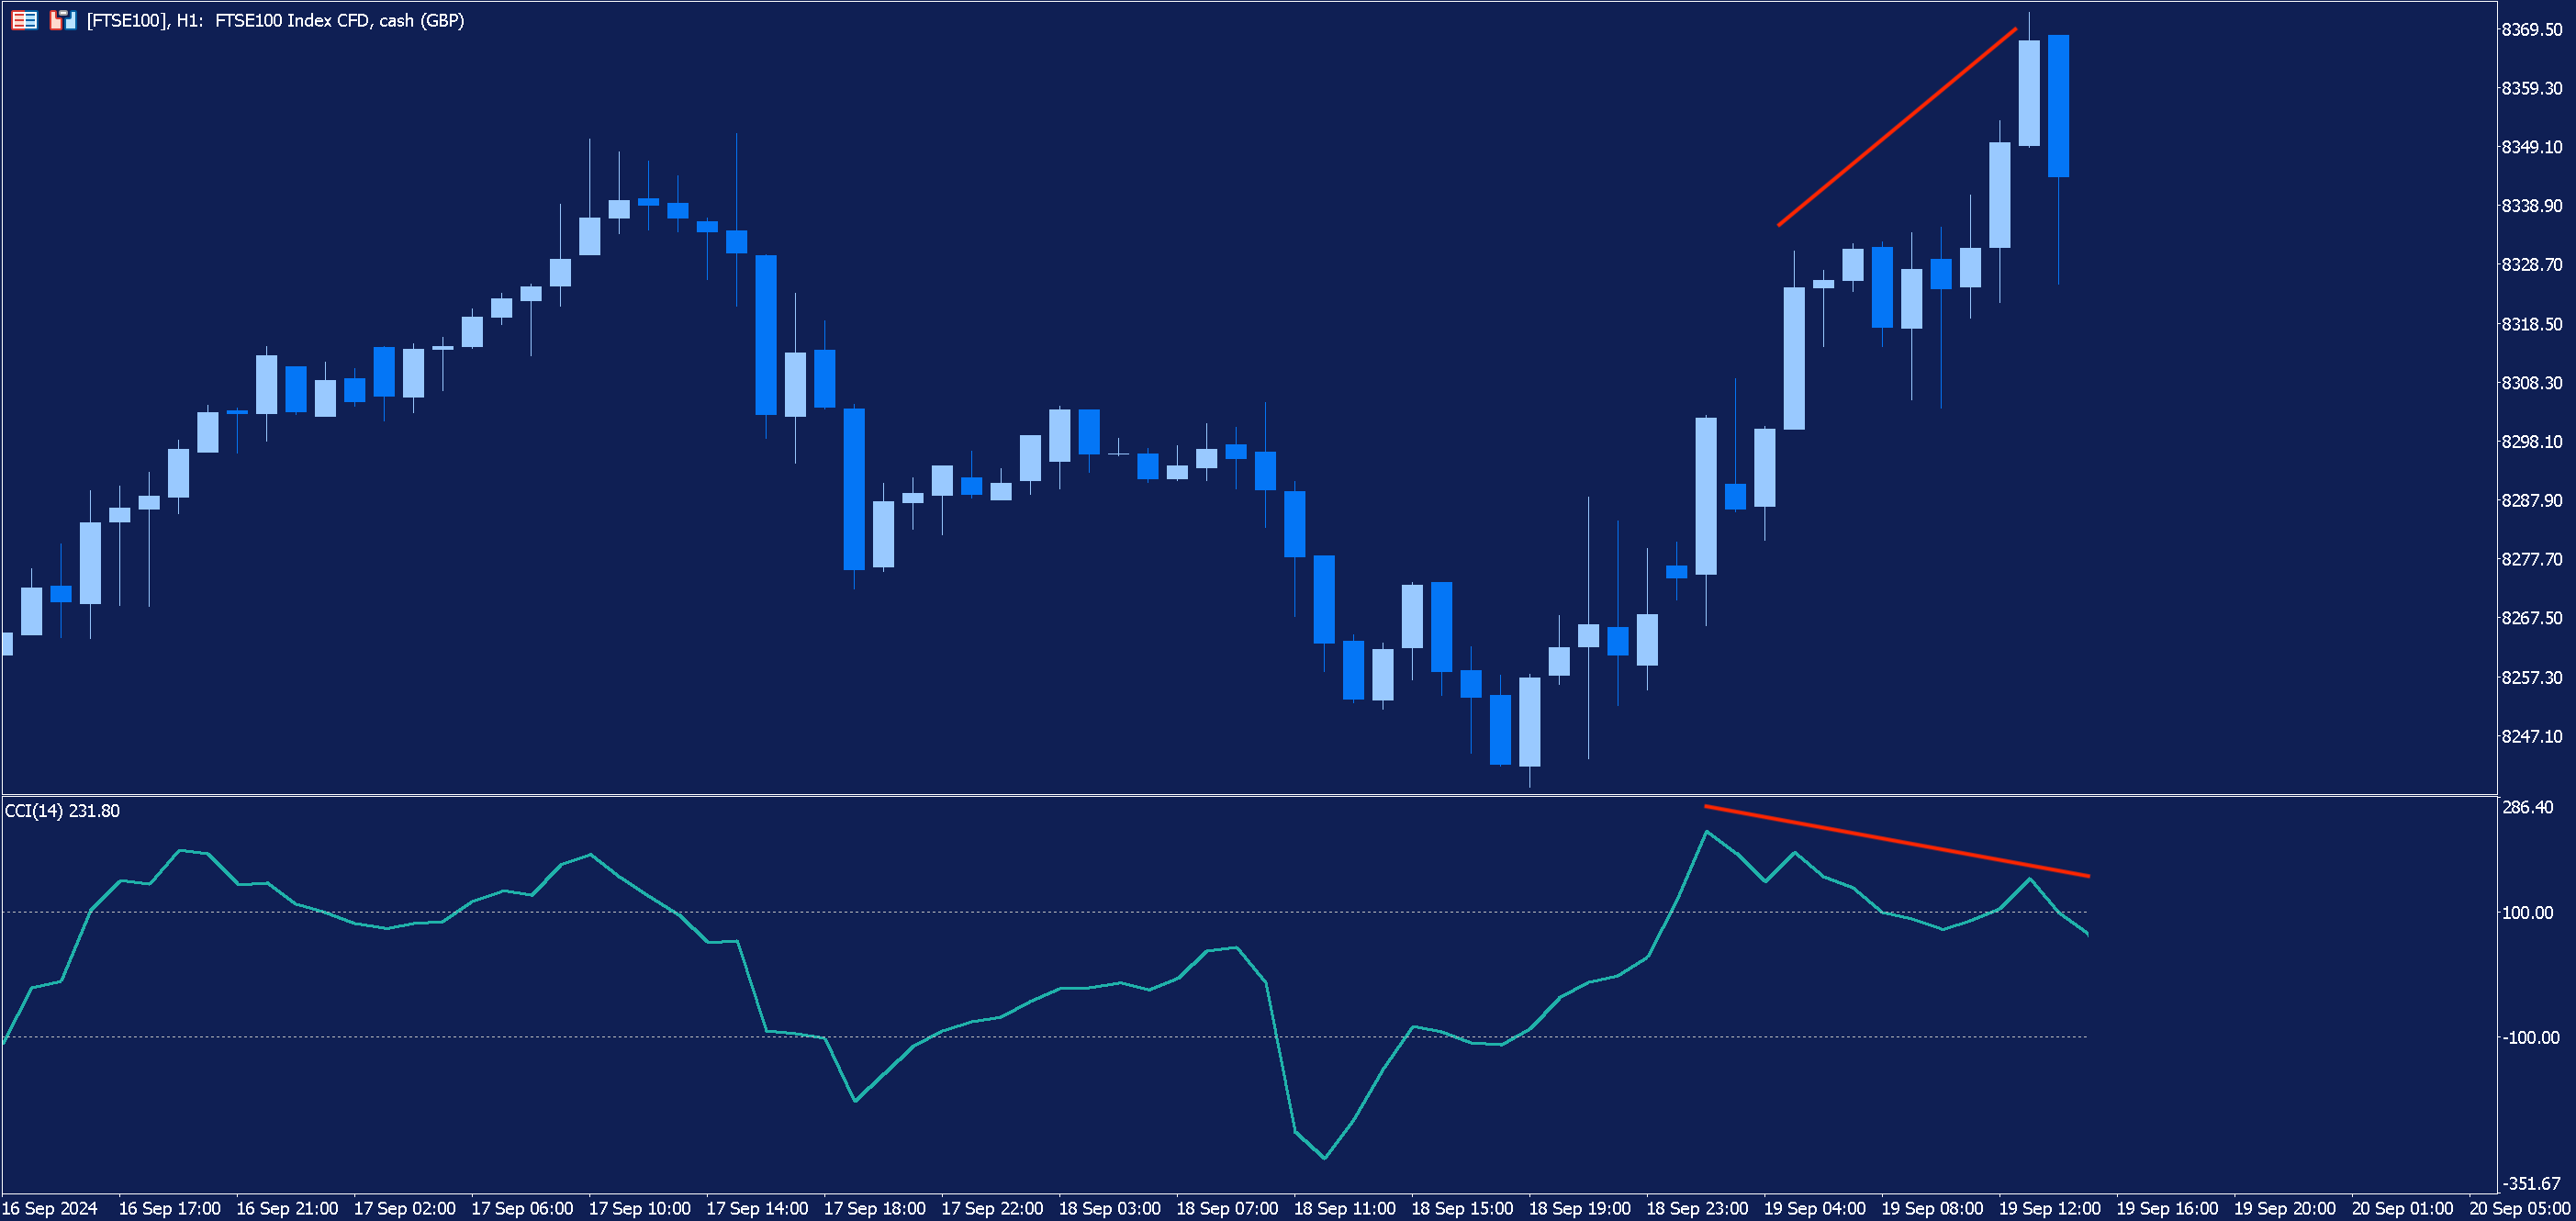
Notice how, in the build up to the bearish engulfing candle, the FTSE 100 continues to move upwards whilst the CCI indicator starts moving in the opposite direction. This is known as divergence and can indicate that a price reversal is about to take place.
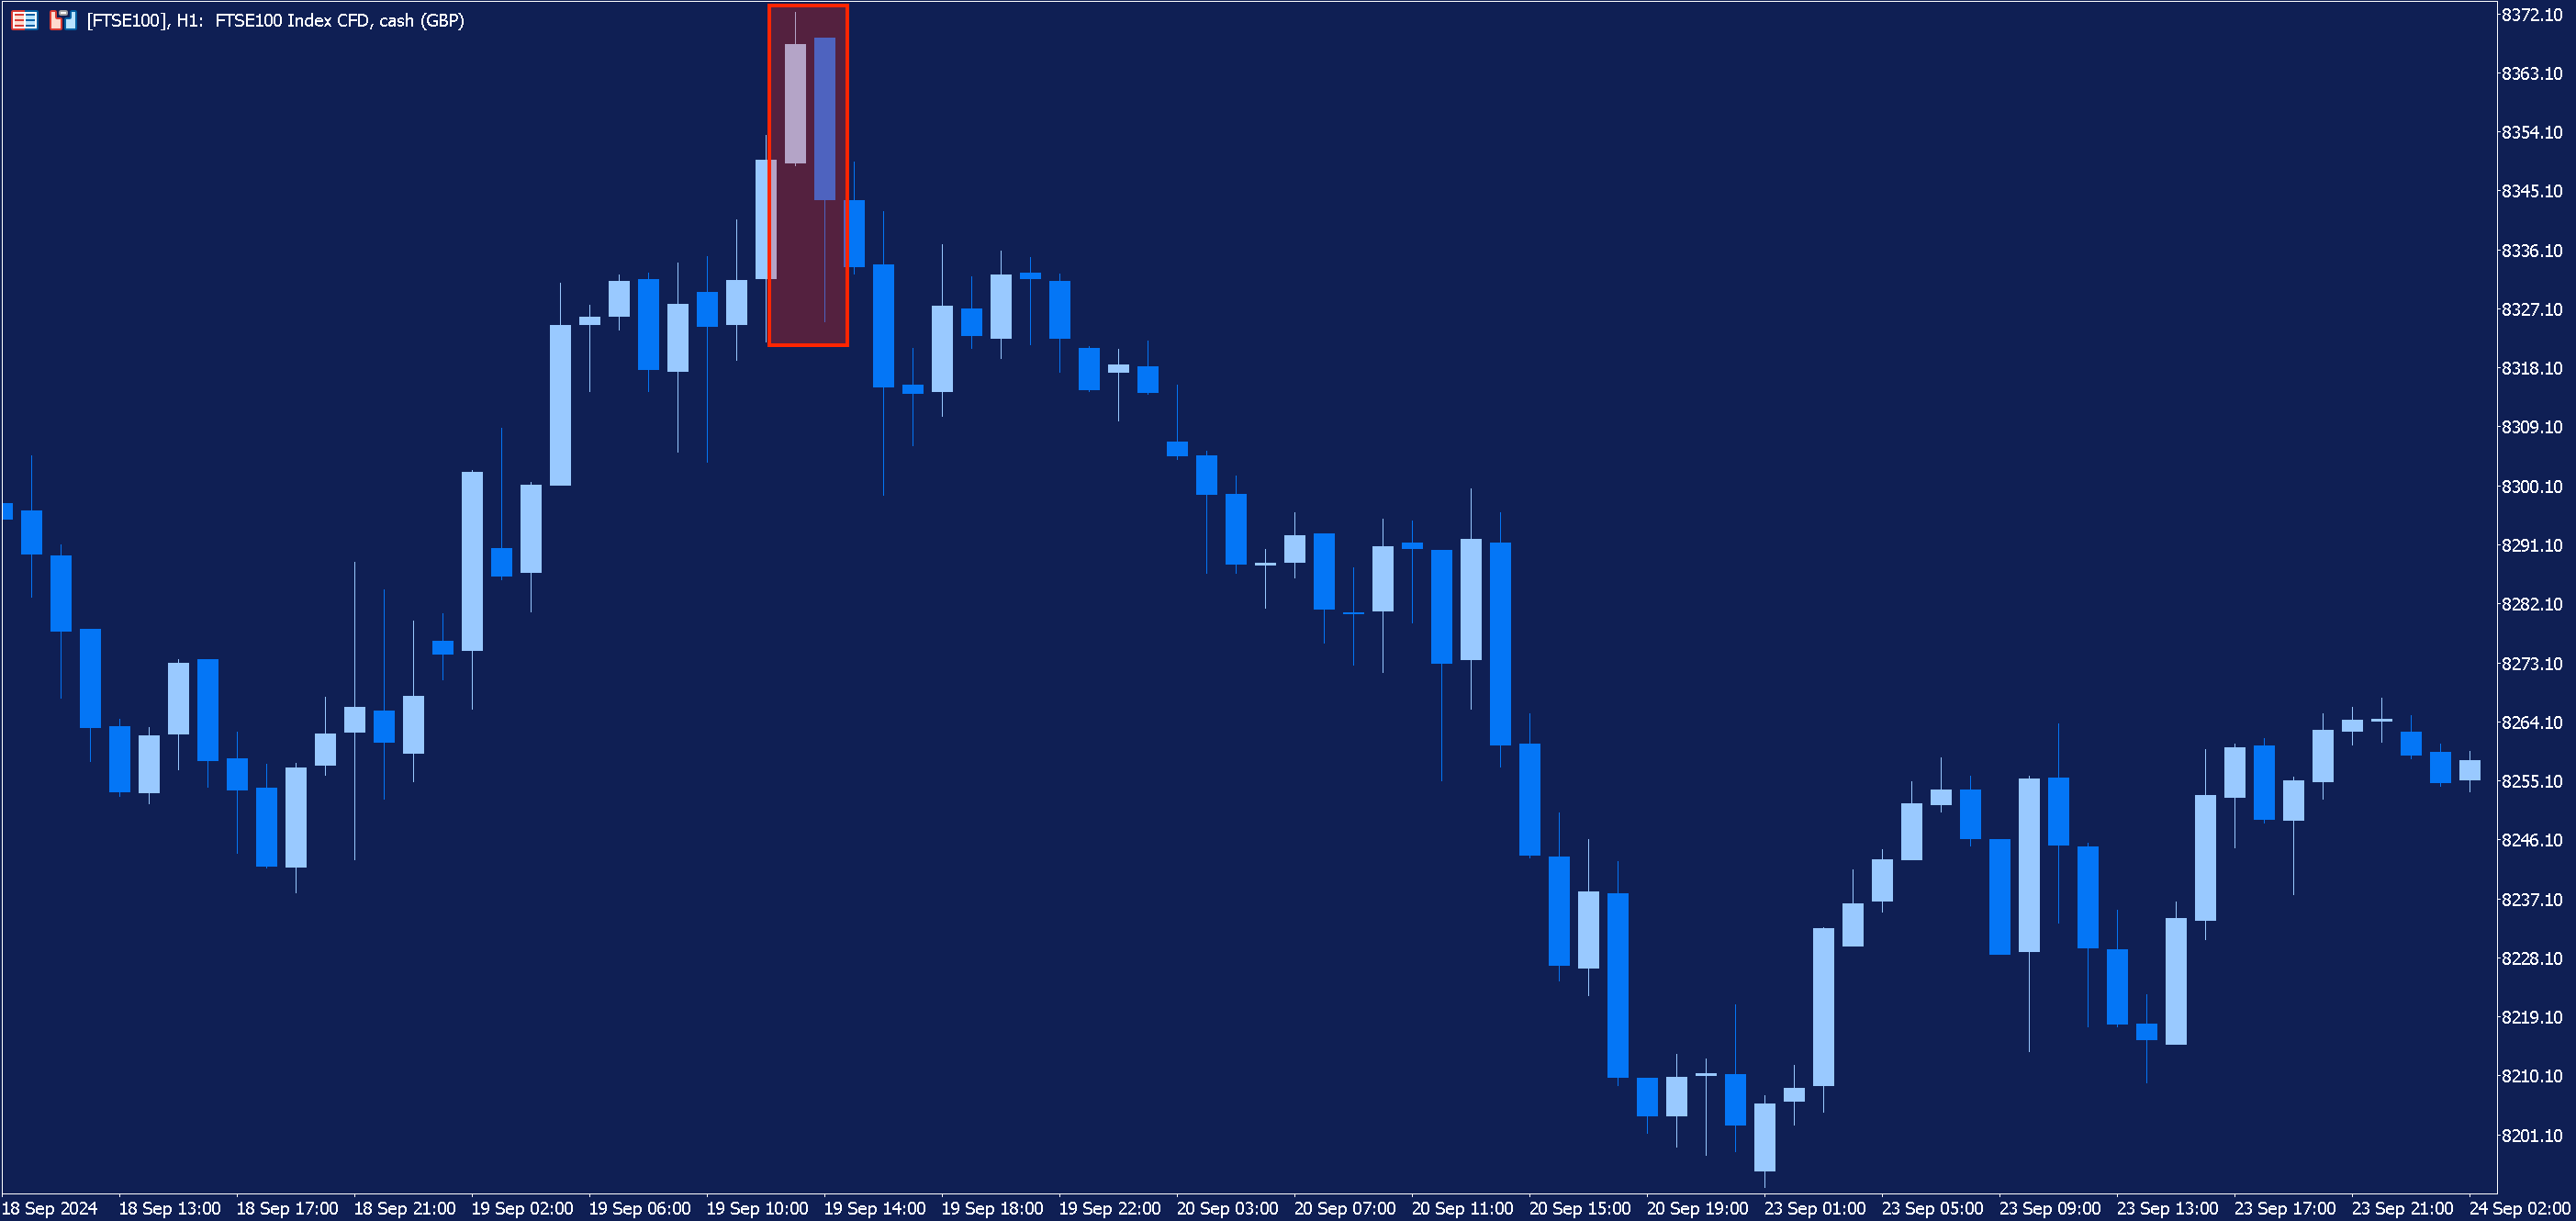
Sure enough, if we move the chart along, we can see that the bearish engulfing pattern is followed by a downward movement in price.
Strategies
From this information, we can begin to sketch the outline of a strategy for trading the bearish engulfing pattern.
- After an upwards price movement, a bearish engulfing pattern provides an alert that price may be about to change direction.
- Instead of entering a position straight away, traders can use technical indicators, such as the CCI, to look for additional confirmation of a price reversal.
- Subject to finding additional confirmation, traders may now choose to enter a short position in the market.
Risk Management & Trading Psychology
Of course, it’s important to note that, as with all chart patterns and trading strategies, there is no way of ensuring success. In the example we looked at above, the pattern was followed by a downward movement in price, but this won’t always be the case.
The bearish engulfing pattern can, and does, produce false signals; even when traders have gained additional confirmation of a reversal. This is why it is crucial for traders to always exercise good risk management whilst trading.
Stop-Loss
Stop-losses are an important part of any risk management strategy, as they can help limit losses when the market moves against you. When trading the bearish engulfing pattern, a stop-loss can be placed above the high of the bearish engulfing candle.
Position Sizing
Another important aspect is position sizing. You should never risk more on a trade than you can afford to lose.
Emotional Control
Emotions can be one of the biggest obstacles in trading. For example, fear can cause traders to exit a trade prematurely, whereas greed can cause traders to hold a position for too long.
Consequently, it is important to learn how to master your emotions when trading. A few things which can help with this are:
- Creating a trading plan and sticking to it.
- Using stop-losses and take profits.
- Taking regular breaks from trading.
- Practise.
Timeframes & Candlestick Chart Analysis
Whilst the bearish engulfing pattern can occur on any timeframe, it is generally accepted that such patterns produce more reliable signals when they appear on longer timeframes.
This is due to shorter timeframes typically producing charts with more noise - price corrections and short-term volatility - which can distort the underlying trend.
Consequently, you might find that, whilst the bearish engulfing pattern occurs more frequently on shorter timeframes, it might produce less reliable signals than when it occurs on a longer timeframe.
Nevertheless, the most appropriate timeframe for trading the bearish engulfing pattern and other candlestick patterns will depend largely on your individual trading style, your attitude to risk and your trading goals.
Furthermore, regardless of timeframe and market conditions, it is always prudent to combine the bearish engulfing pattern with other forms of technical analysis to help improve the quality of the signals it produces.
Market Context
The bearish engulfing pattern can appear during different market conditions. However, its appearance is considered more significant after a clear uptrend and less significant in a choppy market where there is no clear trend.
Conclusion
The bearish engulfing pattern signals a potential bearish reversal. It is characterised by a bullish candle, followed by a bearish candle, where the body of the bearish candle completely engulfs the body of the bullish candle.
Although it is considered to be a signal of a bearish reversal, it can produce many false trading signals, which is why it is important for traders to seek additional confirmation of a reversal before taking a position in the market.
However, it is important to remember that, even with additional confirmation, there is no way of ensuring success when trading the bearish engulfing pattern. All trading involves risk. That’s why it is crucial for traders to always practice risk management when trading.
The given data provides additional information regarding all analysis, estimates, prognosis, forecasts, market reviews, weekly outlooks or other similar assessments or information (hereinafter “Analysis”) published on the websites of Admirals investment firms operating under the Admirals trademark (hereinafter “Admirals”) Before making any investment decisions please pay close attention to the following:
- This is a marketing communication. The content is published for informative purposes only and is in no way to be construed as investment advice or recommendation. It has not been prepared in accordance with legal requirements designed to promote the independence of investment research, and that it is not subject to any prohibition on dealing ahead of the dissemination of investment research.
- Any investment decision is made by each client alone whereas Admirals shall not be responsible for any loss or damage arising from any such decision, whether or not based on the content.
- With view to protecting the interests of our clients and the objectivity of the Analysis, Admirals has established relevant internal procedures for prevention and management of conflicts of interest.
- The Analysis is prepared by an analyst (hereinafter “Author”). The Author Roberto Rivero is a contractor for Admirals. This content is a marketing communication and does not constitute independent financial research.
- Whilst every reasonable effort is taken to ensure that all sources of the content are reliable and that all information is presented, as much as possible, in an understandable, timely, precise and complete manner, Admirals does not guarantee the accuracy or completeness of any information contained within the Analysis.
- Any kind of past or modelled performance of financial instruments indicated within the content should not be construed as an express or implied promise, guarantee or implication by Admirals for any future performance. The value of the financial instrument may both increase and decrease and the preservation of the asset value is not guaranteed.
- Leveraged products (including contracts for difference) are speculative in nature and may result in losses or profit. Before you start trading, please ensure that you fully understand the risks involved.