The Bearish Candlestick Patterns Guide
Bearish candlestick patterns can be used by traders to help identify potential short selling opportunities in the markets. However, before making trading decisions based on these patterns, it's prudent for traders to confirm their signals using other technical analysis tools, such as technical indicators.
In this article, we will highlight some of the most common bearish candlestick patterns – including the bearish engulfing pattern, the shooting star and the hanging man. We will demonstrate how to identify and interpret these patterns, how to find additional confirmation of their bearish signals and discuss the importance of a sound risk management strategy. Keep reading to find out more!
The information in this article is provided for educational purposes only and does not constitute financial advice. Consult a financial advisor before making investment decisions.

Table of Contents
Understanding Bearish Candlestick Patterns
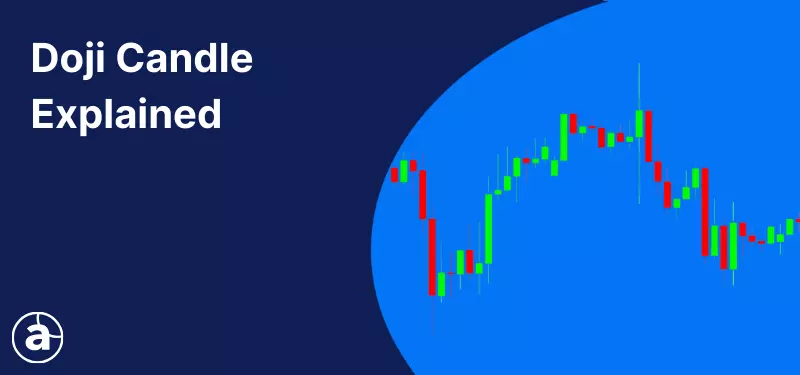
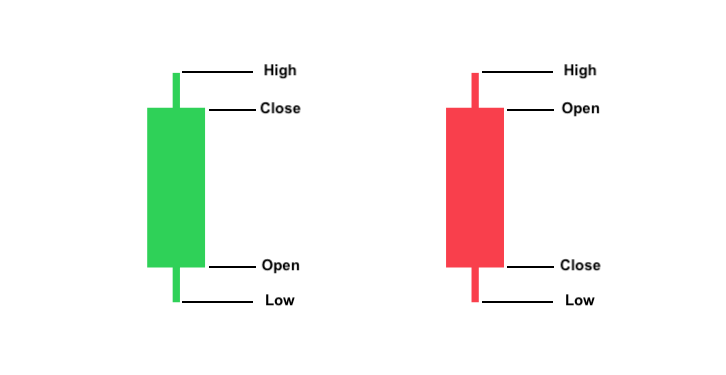
Candlestick patterns are made up of individual candles, with each candle demonstrating the opening, closing, high and low prices of a given period.
A candle whose closing price is higher than its opening price typically has a green or white filled “body”. On the other hand, if a candle’s closing price is lower than its opening price, the body is usually red or black (these colours can be customised by the trader).
Over time, these individual candles will begin to form patterns – from which traders can gain insight into the current market sentiment and identify when that sentiment may be shifting. Using this information, traders can make predictions about where price might be heading next.
Types of Bearish Candlestick Patterns
In the following sections, we will highlight a few of the most commonly used bearish candlestick patterns, demonstrate what they look like and explain the logic behind them.
Shooting Star
The shooting star candlestick pattern comprises of a single candle, which appears following an upwards movement in price and can signal a potential reversal to the downside. The candle has a short body, a long upper wick and a short, or no, lower wick. The body can be either bullish or bearish.
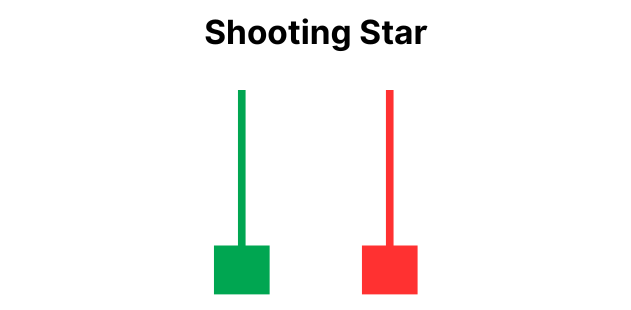
After a period of buying pressure in the market, the appearance of a shooting star implies that buyers may have lost enthusiasm, and that a downward movement may be about to begin. But why?
The long upper wick tells us that, at one point in the session, buyers were successful in driving up the price. However, they were unable to maintain control. Sellers entered the market with enough force to push price back down and, ultimately, price closed back down near to where it opened.
This can signal a potential shift in sentiment and could be followed by a downward movement in price as sellers begin to take control of the market.
Hanging Man
Like the shooting star, the hanging man is also a single candle pattern which appears at the top of an uptrend and signals a potential bearish reversal.
The candle has a short body, which can be either bullish or bearish, a long lower wick and a short, or no, upper wick. The image below demonstrates what the hanging man looks like.
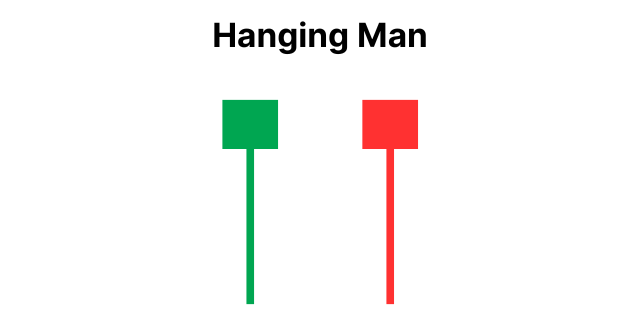
The formation of the hanging man after an uptrend warns of weakness in the upward movement.
Although buyers were successful in pushing price back up towards where it opened, the long lower shadow tells us that there was significant selling pressure during the session. This may indicate that sentiment is beginning to turn bearish.
Bearish Engulfing
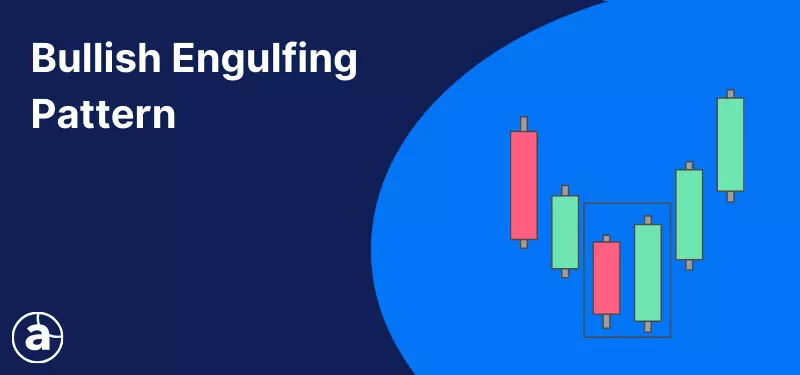
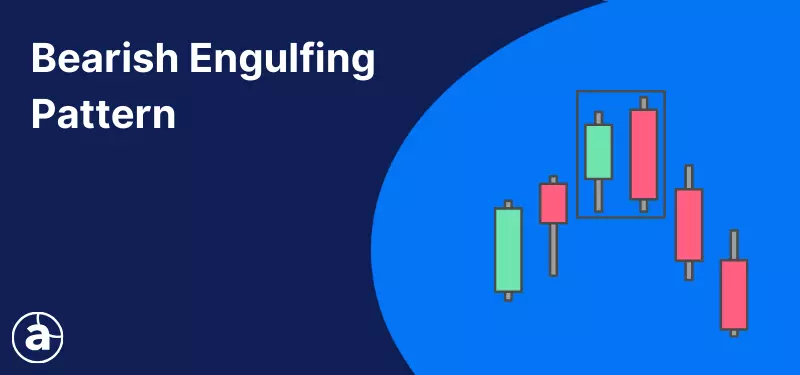
The bearish engulfing candlestick pattern consists of two candlesticks: a bullish candle followed by a bearish candle.
The body of the bearish candle gives the impression of completely engulfing the body of the preceding bullish candle. This visual effect is achieved by the second candle opening higher than the close of the previous candle before closing lower than its open.
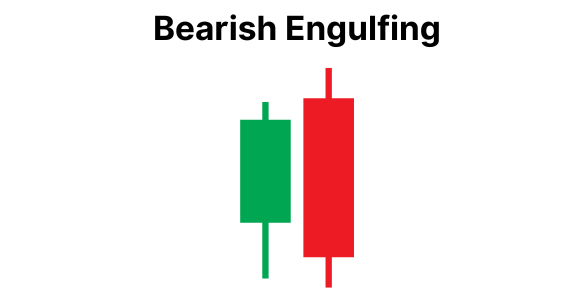
Despite opening higher than the previous candle’s close, selling pressure forces price down, completely erasing the previous session’s gains in the process.
The bearish engulfing pattern is interpreted as a signal of a potential bearish reversal when it appears after an upward movement in price. It indicates that buying pressure may be subsiding and that sellers might be taking control of the market.
Evening Star
Finally, let’s look at the evening star. This pattern consists of three candles and indicates a potential bullish reversal.
In the middle, we have a short-bodied candle which finds itself lodged in between a long-bodied bullish candle to the left and a long-bodied bearish candle to the right.
The middle candle opens higher than the close of the first candle and forms the highest point of the pattern. The third candle also typically opens with a gap down from the previous candle’s close and then closes below the midpoint of the first candle.
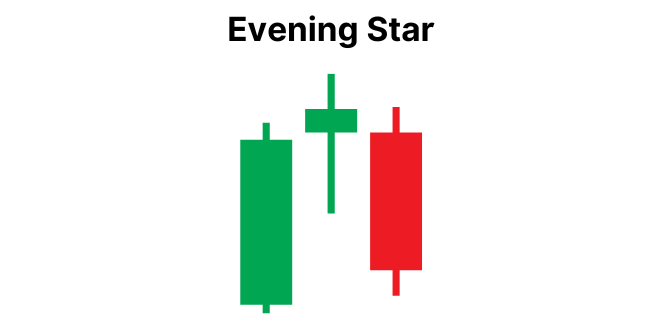
After an uptrend, the first candle of the evening star showcases strong buying pressure. However, the second, short-bodied, candle betrays a moment of market indecision during which neither buyers nor sellers convincingly dictate the session.
The third, long, bearish candle demonstrates that sellers have seized control of the session, driving prices down forcefully. These three candles indicate that the uptrend may have broken down and that prices may be about to start a downward movement.
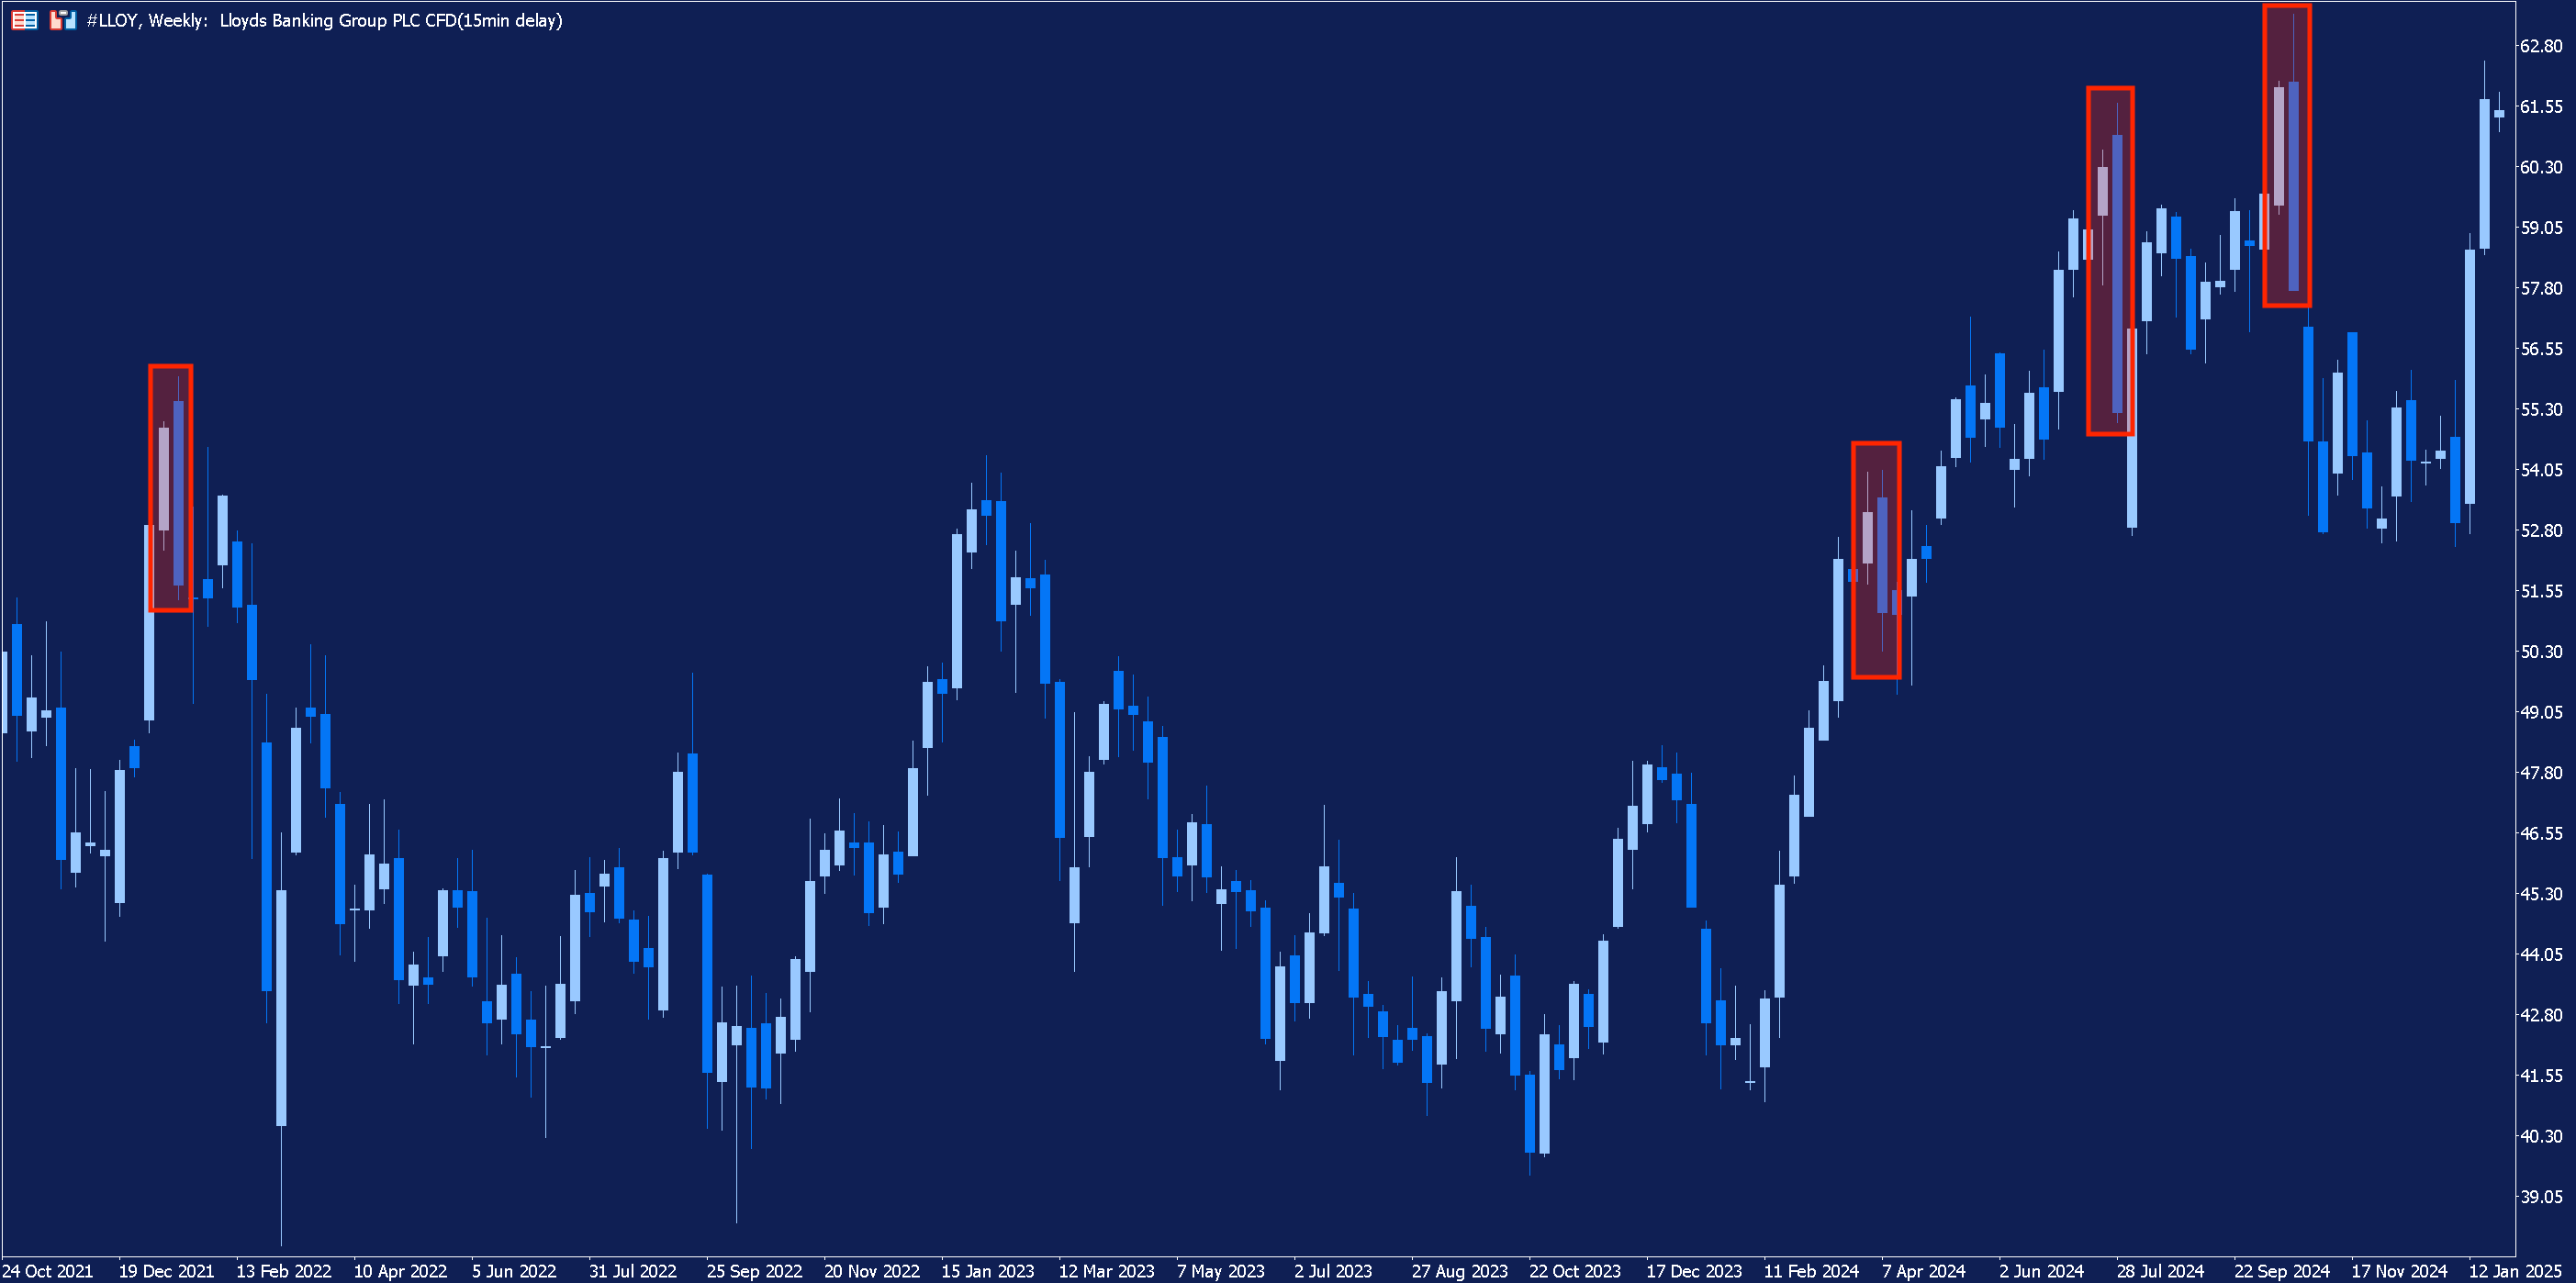
Financial Markets and Candlestick Patterns
Candlestick patterns can occur on any asset, in any market. Below, on the weekly chart of UK bank stock Lloyds, we have highlighted several instances of the bearish engulfing pattern occurring.
Bearish candlestick patterns portray a situation in the market where bearish sentiment appears to be overcoming bullish. Regardless of which asset this is happening on, there will typically be a reason behind this shifting sentiment.
In the case of an individual company, bearish sentiment may come from an underwhelming earnings report or a negative news story.
In the case of a broader market shift, bearish sentiment may be triggered by the release of key economic indicators, such as interest rate decisions, inflation data, Gross Domestic Product (GDP) data and unemployment figures.
For example, rising interest rates will typically have a negative impact on share prices (except in some cases where the opposite might be true). Similarly, GDP, inflation or unemployment data which is reported worse than expected could also result in a bearish shift in sentiment.
Trading Strategies Using Bearish Candlestick Patterns
Traders can use bearish candlestick patterns to identify potential short-selling opportunities in the market.
However, rather than trading strictly based on the appearance of a candlestick pattern, traders should confirm their signals by using other technical analysis tools, such as analysis of historic levels of support and resistance, or by using technical indicators.
Let’s take a look at an example of this using technical indicators. Below is the weekly chart of FTSE 100 constituent Marks and Spencer Group, in which we have highlighted a bearish engulfing pattern.
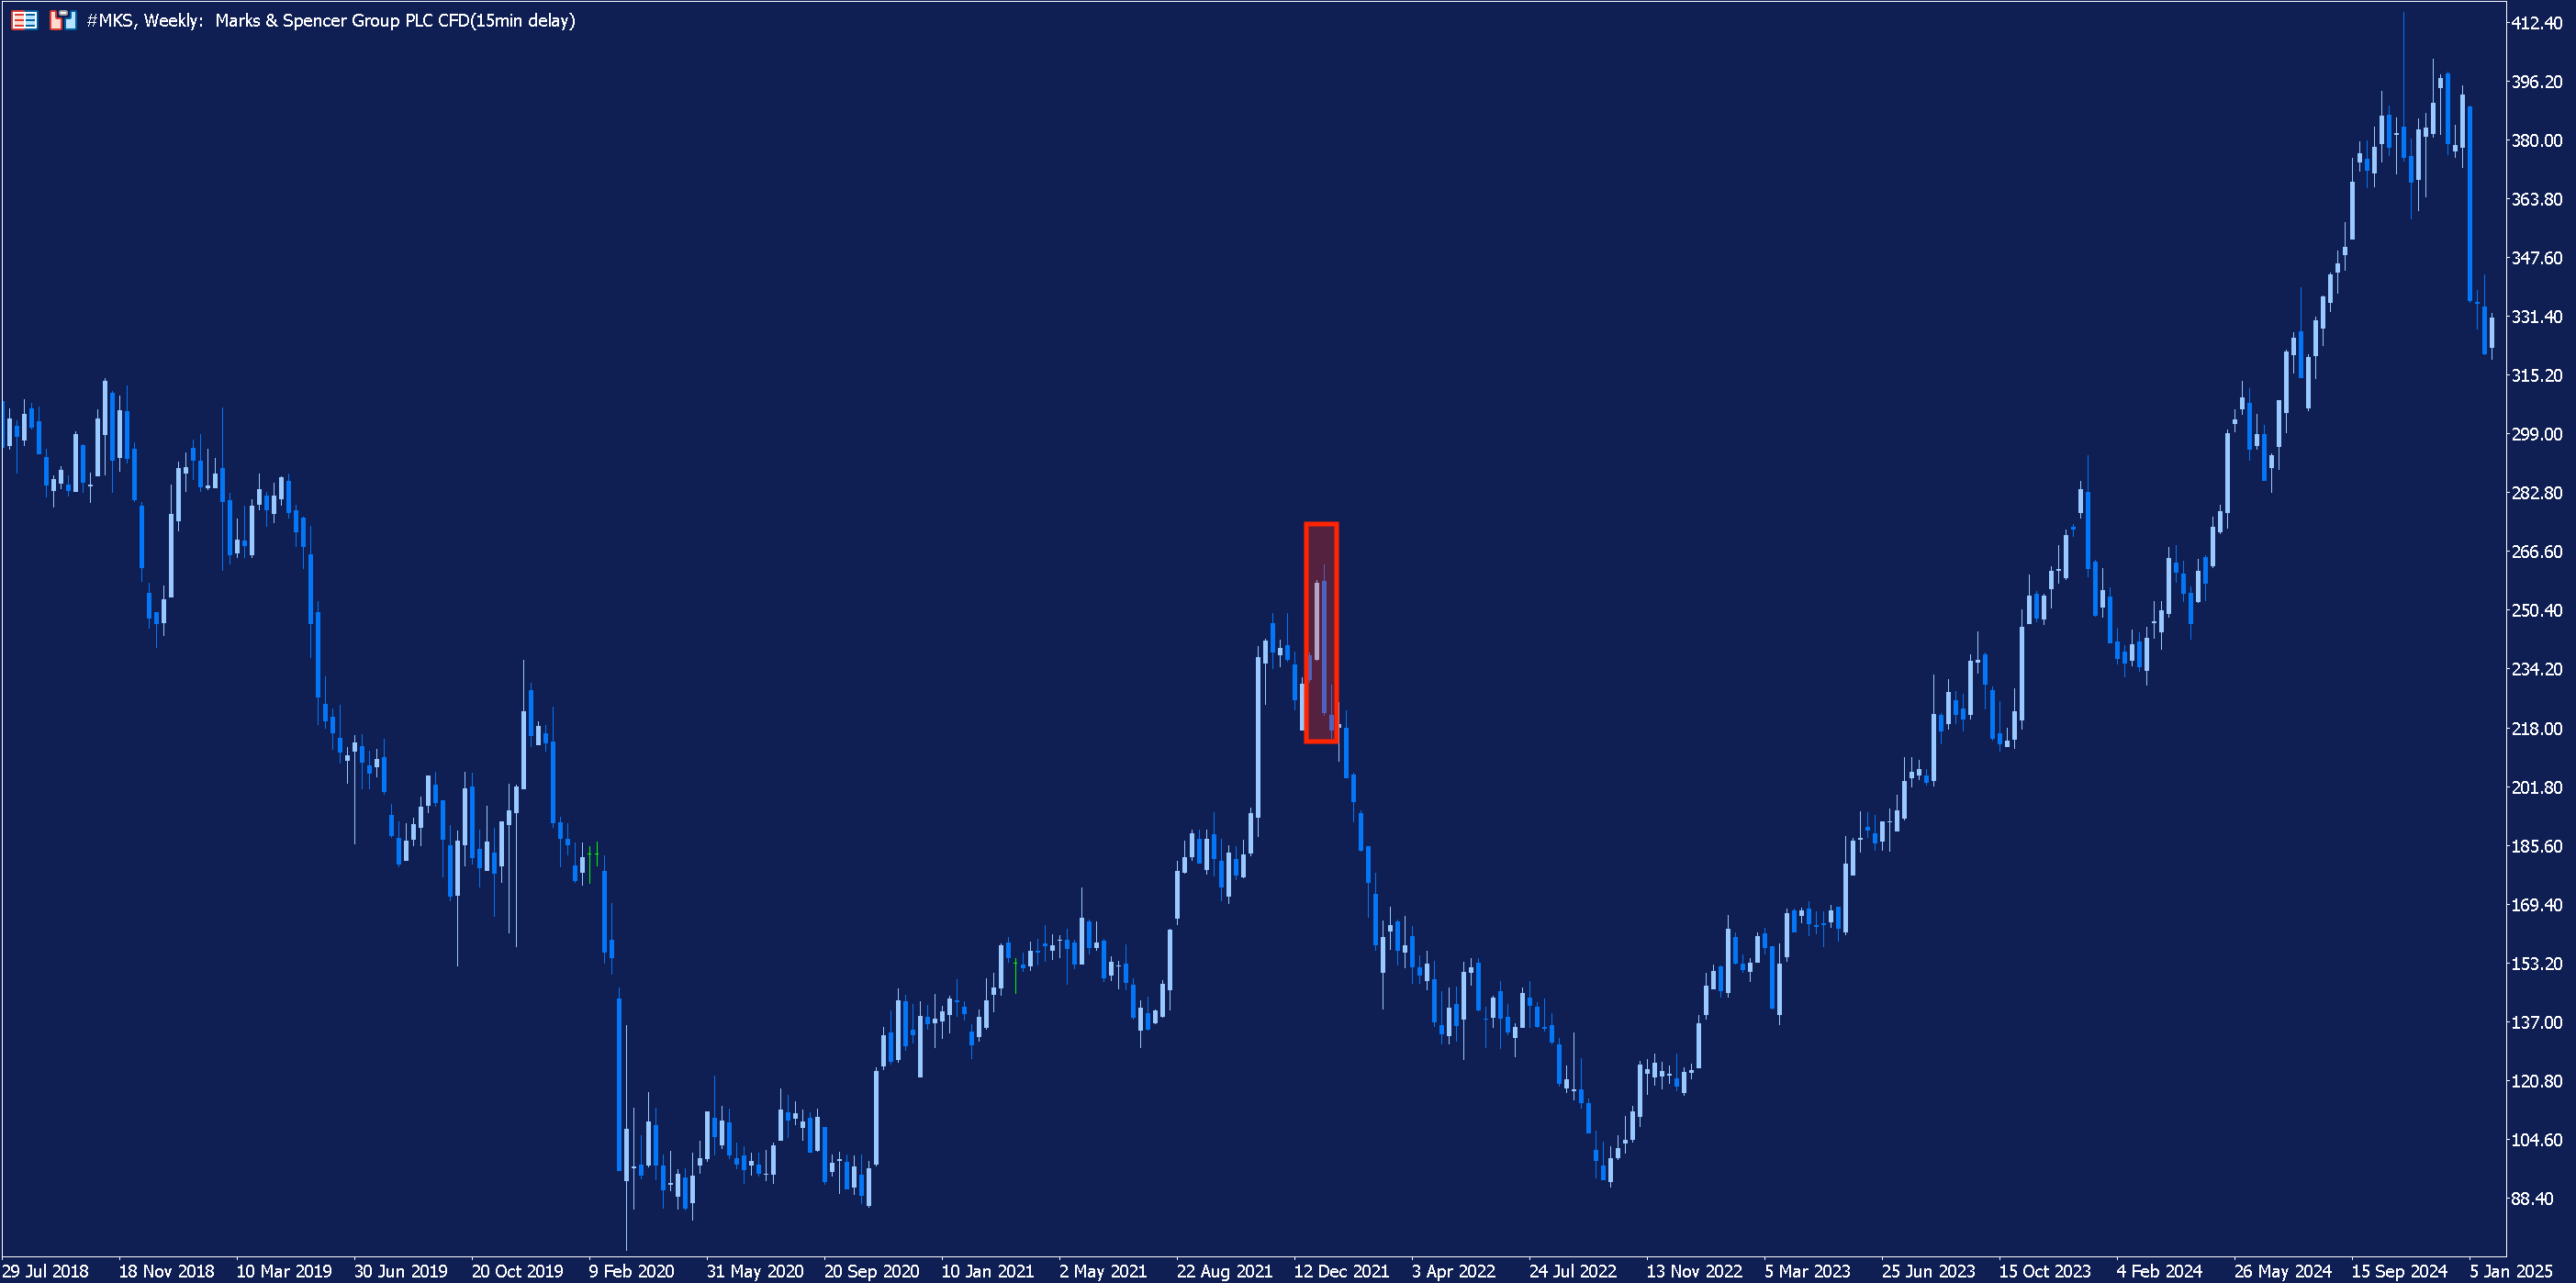
The bearish engulfing pattern is preceded by an uptrend and followed immediately by a downtrend. However, this won't always be the case. So, if a trader were trading this in real-time, how could they use technical indicators to confirm the bearish signal provided by pattern?
There are a number of indicators which can be used to spot signals of potential price reversals – including the Stochastic Oscillator, the Commodity Channel Index (CCI), the Relative Strength Index (RSI) and the Money Flow Index.
In the chart below, we have zoomed in on the bearish engulfing pattern highlighted above and added the Stochastic Oscillator to the chart.
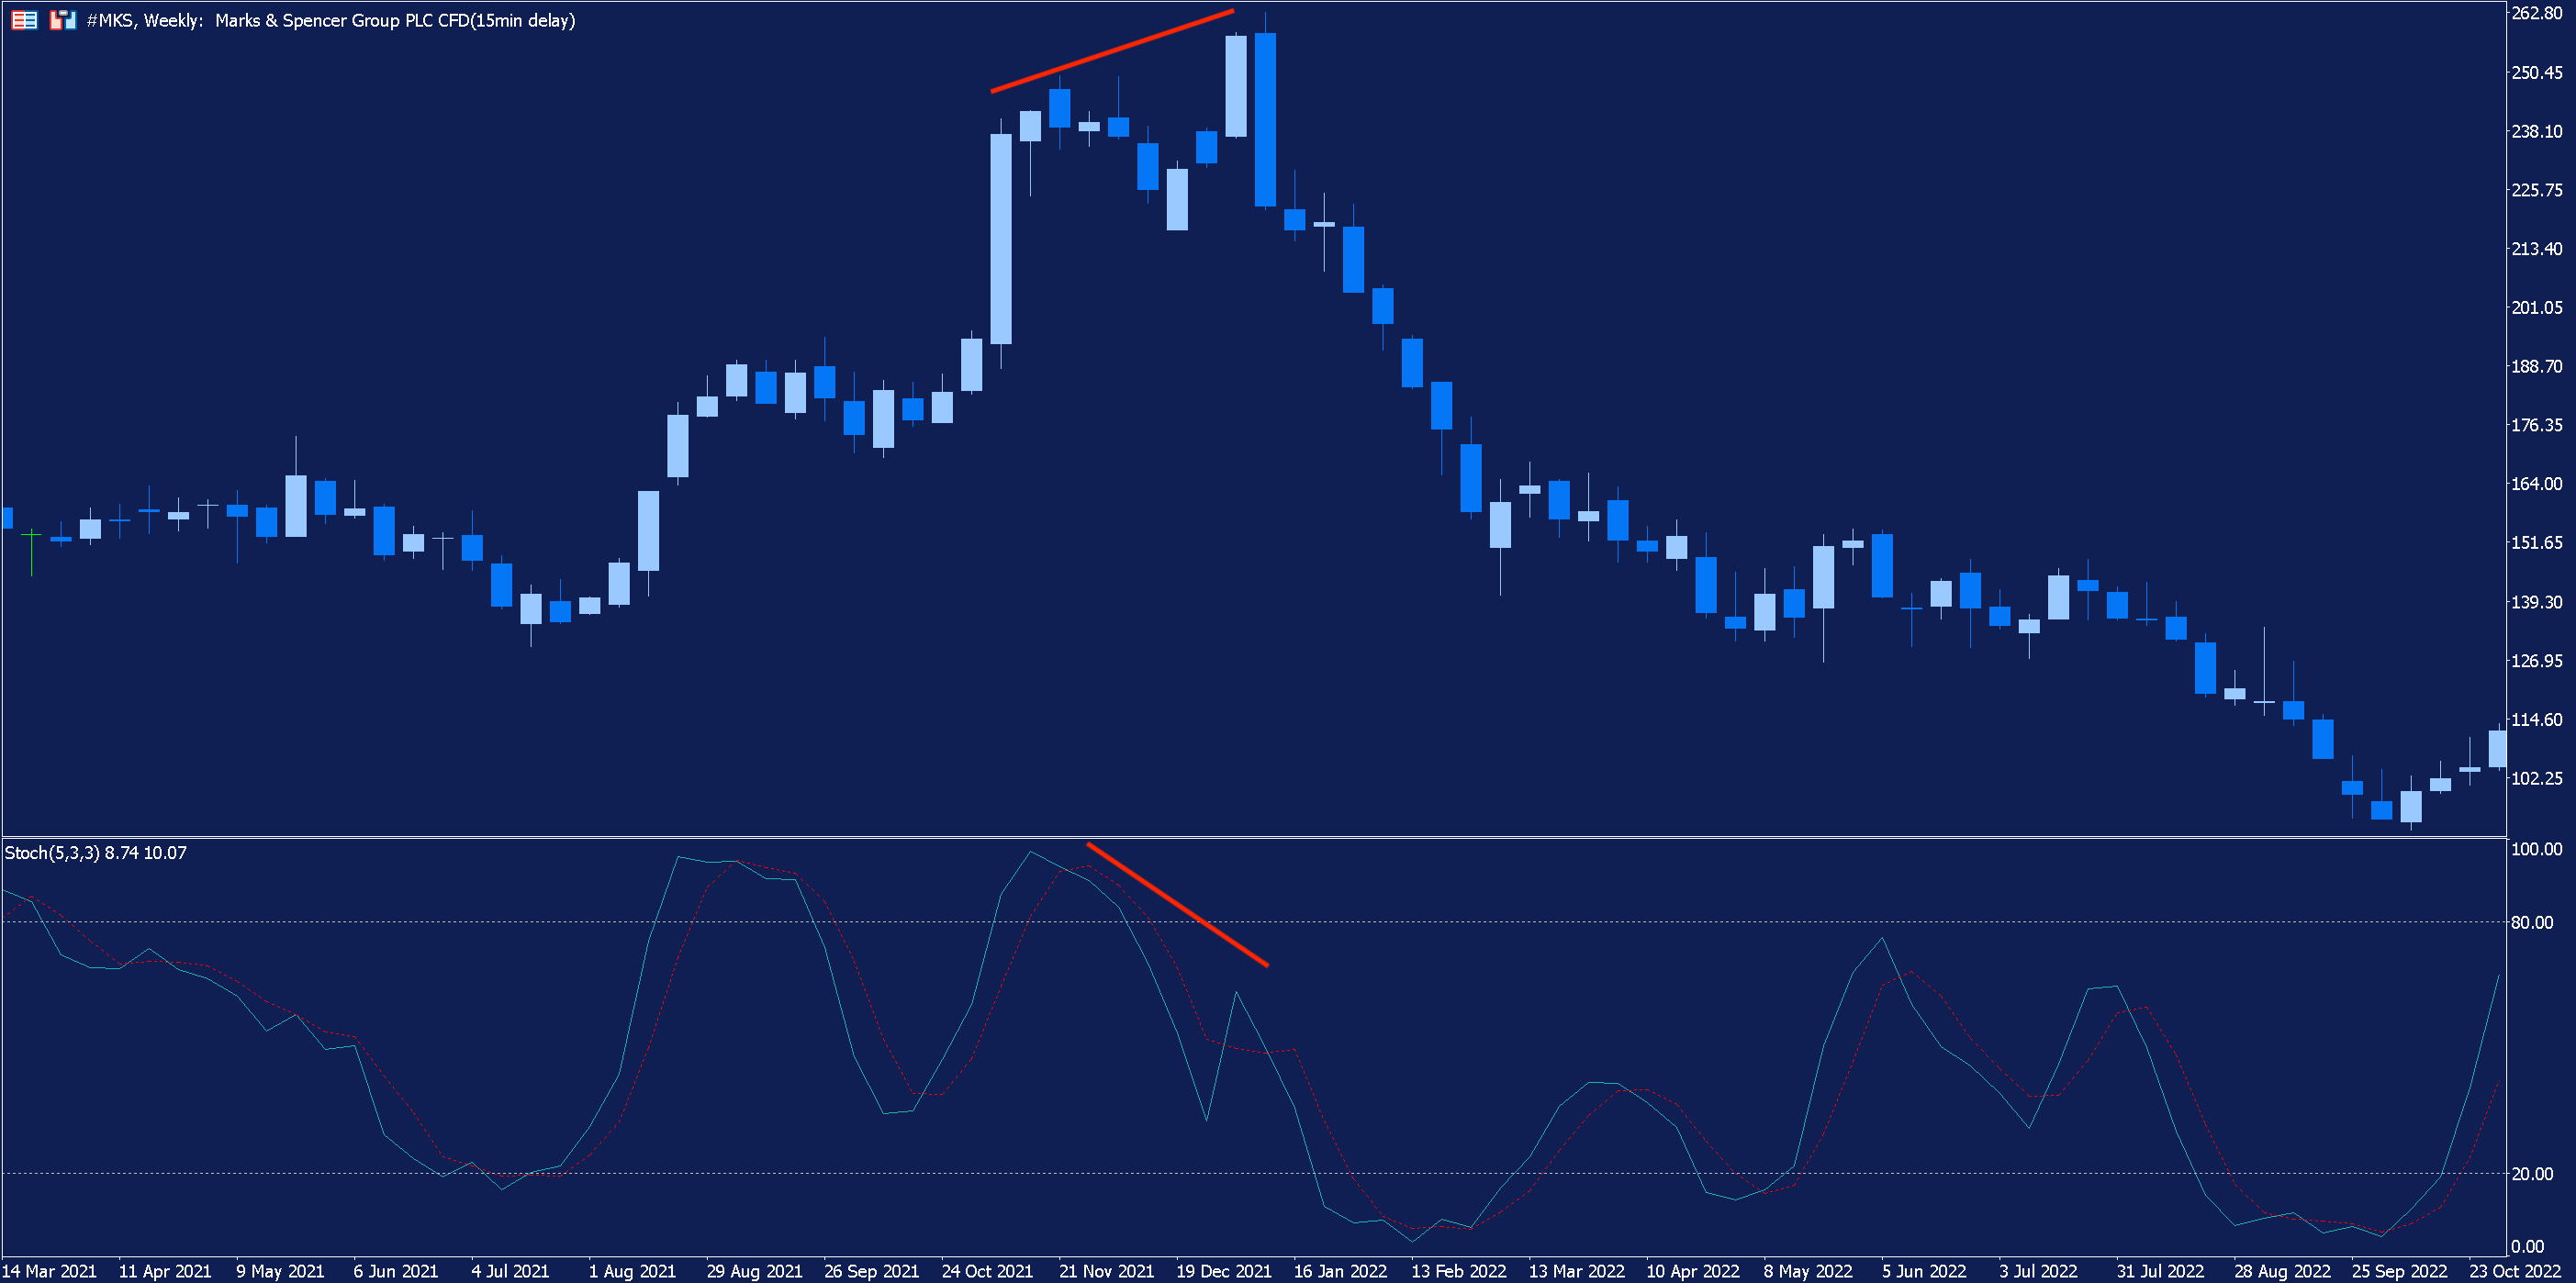
In the build-up to the formation of the candlestick pattern, we can see that, whilst share price continued to record higher highs, the Stochastic Oscillator began making lower highs.
This is an example of bearish divergence, which can indicate that a bearish reversal is imminent. The other indicators highlighted above can also be used in the same way. Traders may have taken this additional confirmation as a signal to enter a short-selling position.
However, more conservative traders may look for confirmation in multiple indicators before taking a position in the market, or else combine this approach with an analysis of support and resistance levels and other technical analysis tools.
Risk Management
Nevertheless, even when traders identify additional signals of a potential reversal, a reversal may never materialise. Just like all trading strategies, strategies based on candlestick patterns can, and will, produce false signals.
That’s why it is so important for traders to always exercise proper risk management when trading. Below are some considerations to bear in mind:
- Never risk more than you can afford to lose on a trade.
- Trade with a stop-loss, which can help protect you from adverse market movements by automatically closing a position once price has reached a predetermined level.
- Practise new trading strategies on a risk-free demo account before implementing them on the live markets.
Conclusion
Bearish candlestick patterns can help traders spot short-selling opportunities in a range of different markets.
However, traders must bear in mind that these patterns produce plenty of false signals, which is why it is important to find additional evidence of a bearish price movement before entering the market.
Yet even with additional confirmation, there is no guarantee of success when trading using candlestick patterns. It’s important that traders understand the risks involved when trading and take steps to mitigate them, such as using a stop loss and never risking too much on any one trade.
The given data provides additional information regarding all analysis, estimates, prognosis, forecasts, market reviews, weekly outlooks or other similar assessments or information (hereinafter “Analysis”) published on the websites of Admirals investment firms operating under the Admirals trademark (hereinafter “Admirals”) Before making any investment decisions please pay close attention to the following:
- This is a marketing communication. The content is published for informative purposes only and is in no way to be construed as investment advice or recommendation. It has not been prepared in accordance with legal requirements designed to promote the independence of investment research, and that it is not subject to any prohibition on dealing ahead of the dissemination of investment research.
- Any investment decision is made by each client alone whereas Admirals shall not be responsible for any loss or damage arising from any such decision, whether or not based on the content.
- With view to protecting the interests of our clients and the objectivity of the Analysis, Admirals has established relevant internal procedures for prevention and management of conflicts of interest.
- The Analysis is prepared by an analyst (hereinafter “Author”). The Author Roberto Rivero is a contractor for Admirals. This content is a marketing communication and does not constitute independent financial research.
- Whilst every reasonable effort is taken to ensure that all sources of the content are reliable and that all information is presented, as much as possible, in an understandable, timely, precise and complete manner, Admirals does not guarantee the accuracy or completeness of any information contained within the Analysis.
- Any kind of past or modelled performance of financial instruments indicated within the content should not be construed as an express or implied promise, guarantee or implication by Admirals for any future performance. The value of the financial instrument may both increase and decrease and the preservation of the asset value is not guaranteed.
- Leveraged products (including contracts for difference) are speculative in nature and may result in losses or profit. Before you start trading, please ensure that you fully understand the risks involved.