Three Black Crows Candlestick Pattern
The three black crows is a pattern which can appear on candlestick charts and signals a potential bearish reversal. However, like all candlestick patterns, its appearance does not guarantee a price reversal.
In this article, we will examine this candlestick pattern in detail, explaining how it can be identified, interpreted and traded. We will also examine how traders can attempt to filter out false signals by seeking additional evidence of a price reversal. Keep reading to find out more!
| The information in this article is provided for educational purposes only and does not constitute financial advice. Consult a financial advisor before making investment decisions. |
Table of Contents
Understanding the Three Black Crows Pattern
The three black crows is a candlestick pattern which signals a bearish reversal. As the name suggests, it consists of three consecutive bearish candlesticks, all of which have long bodies and small, or no, wicks.
Key Characteristics
Like other candlestick patterns, the three black crows can be identified by traders on a price chart without the use of any tools or indicators. In order for it to be a valid formation of the three crows, the following must be true:
- There should be a noticeable uptrend.
- At the top of the uptrend, there are three consecutive bearish candles with long bodies.
- Each candle should open lower than the previous session’s opening price.
- All three candles close lower than the previous candle.
Identification
Below is an example of what the three black crows looks like on a price chart.
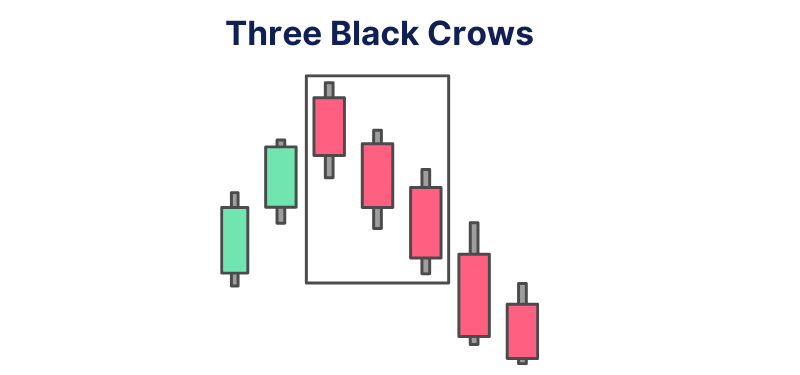
Interpretation
Candlesticks on a price chart provide a visual representation of what has happened during a trading session.
At their simplest, a bullish candle tells us that buyers are in the ascendency, whereas a bearish candle tells us that it’s sellers which are dominating the trading during the session.
Three black crows appear at the top of an uptrend, after a period where buyers have been consistently pushing prices higher. The strong downwards movement shows that, for three straight sessions, sellers have convincingly turned the table on buyers.
Bearish Reversal Signal
Consequently, this sustained downwards movement coming after a period of rising prices is interpreted by traders as a signal of an imminent bearish reversal.
Education from Admirals
Interested in learning more about improving your trading skills? At Admirals, we have an array of educational resources, including a vast library of articles covering a wide range of trading topics. Click the banner below to explore our educational section:

How to Trade the Three Black Crows Pattern
The three black crows is considered to be a bearish reversal pattern. However, trading candlestick patterns is not an exact science.
Whilst the three black crows may be considered to signal a bearish reversal, its appearance won’t always be followed by further downward momentum. Consequently, rather than entering a trade based solely on its appearance, the prudent thing for traders to do is seek additional confirmation of a reversal in price.
Let’s take a look at an example. Please note, the following examples have been provided for educational purposes only and should not be interpreted as investment advice.
Identifying Trading Opportunities
Below is a daily chart of UK stock British American Tobacco. Following an uptrend, the three black crows appear.
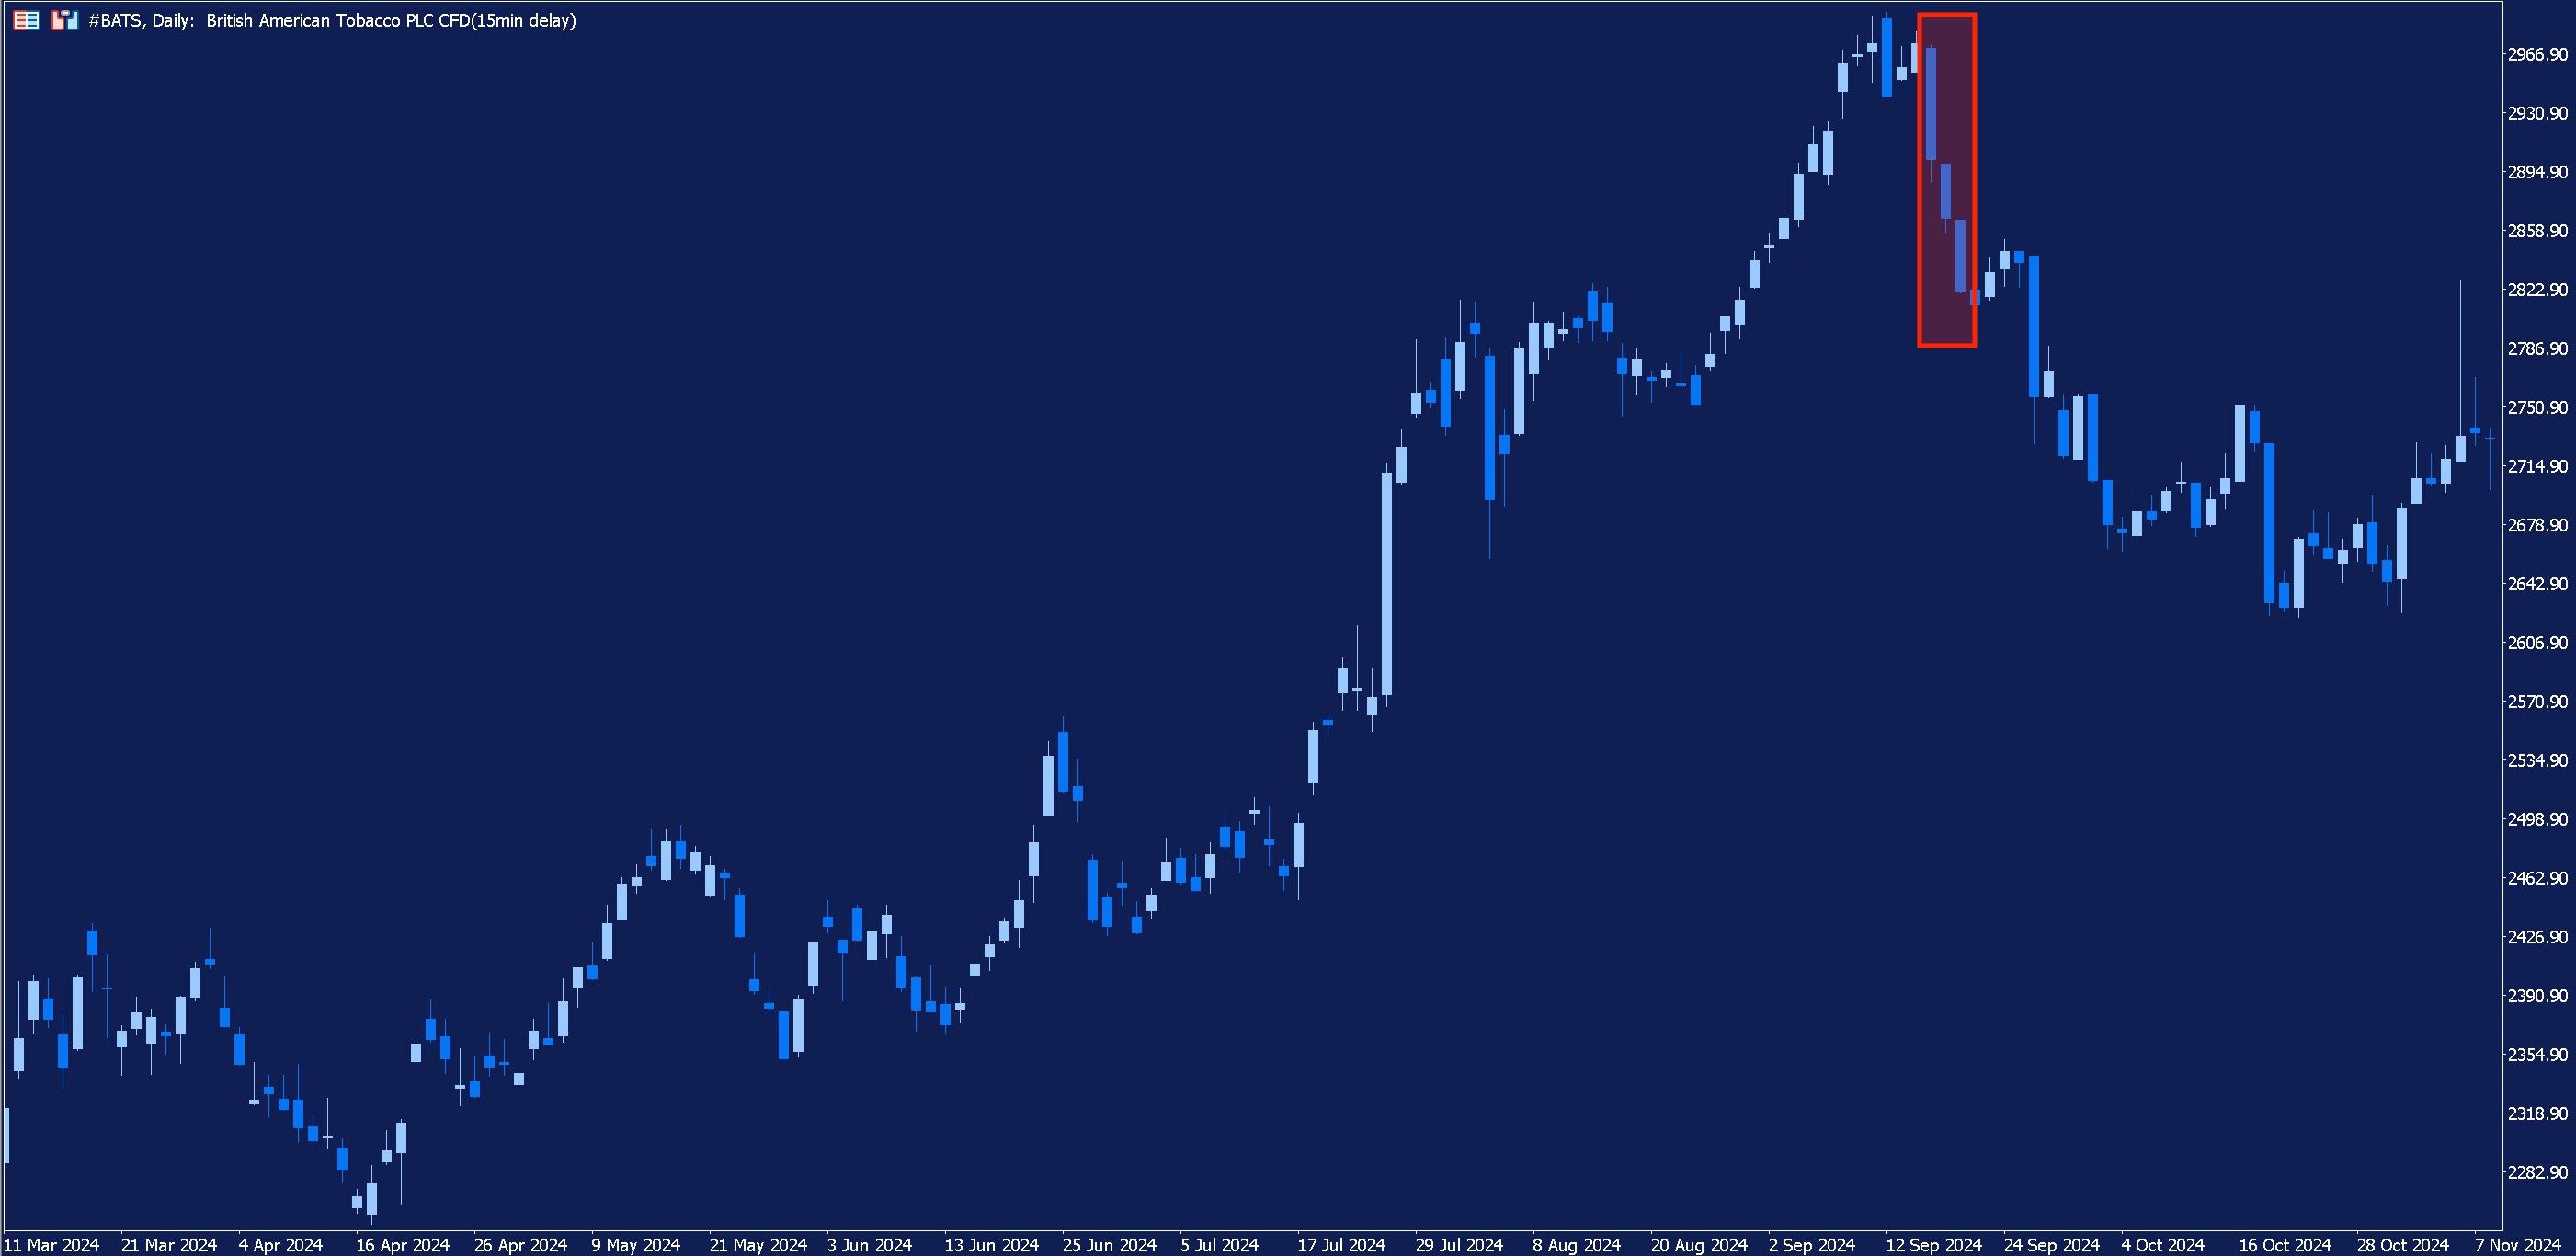
With the benefit of hindsight, we can see that the pattern was followed by a pullback in price. But we couldn’t have known that in real time.
In real time, traders could have instead looked for additional evidence of a price reversal. But how?
Confirmation Signals
There are a number of technical analysis tools which traders can use to look for evidence of a potential reversal in price. However, it’s important to note here that, even with additional confirmation, there is no guarantee that a reversal in price will follow the appearance of this candlestick pattern.
Technical analysis tools which can be used by traders include technical indicators such as the Relative Strength Index (RSI), the Stochastic Oscillator and the Moving Average Convergence/Divergence (MACD) indicator.
All three of these indicators can be used by traders to spot divergence between an asset’s price and the indicator itself. A divergence occurs when the asset’s price and an indicator start to move in different directions.
If present, divergence can indicate that a trend is weakening and that a reversal may be about to take place.
Below is another daily chart of British American Tobacco, highlighting the same three black crows pattern as before. This time, we have zoomed in and added the MACD indicator.
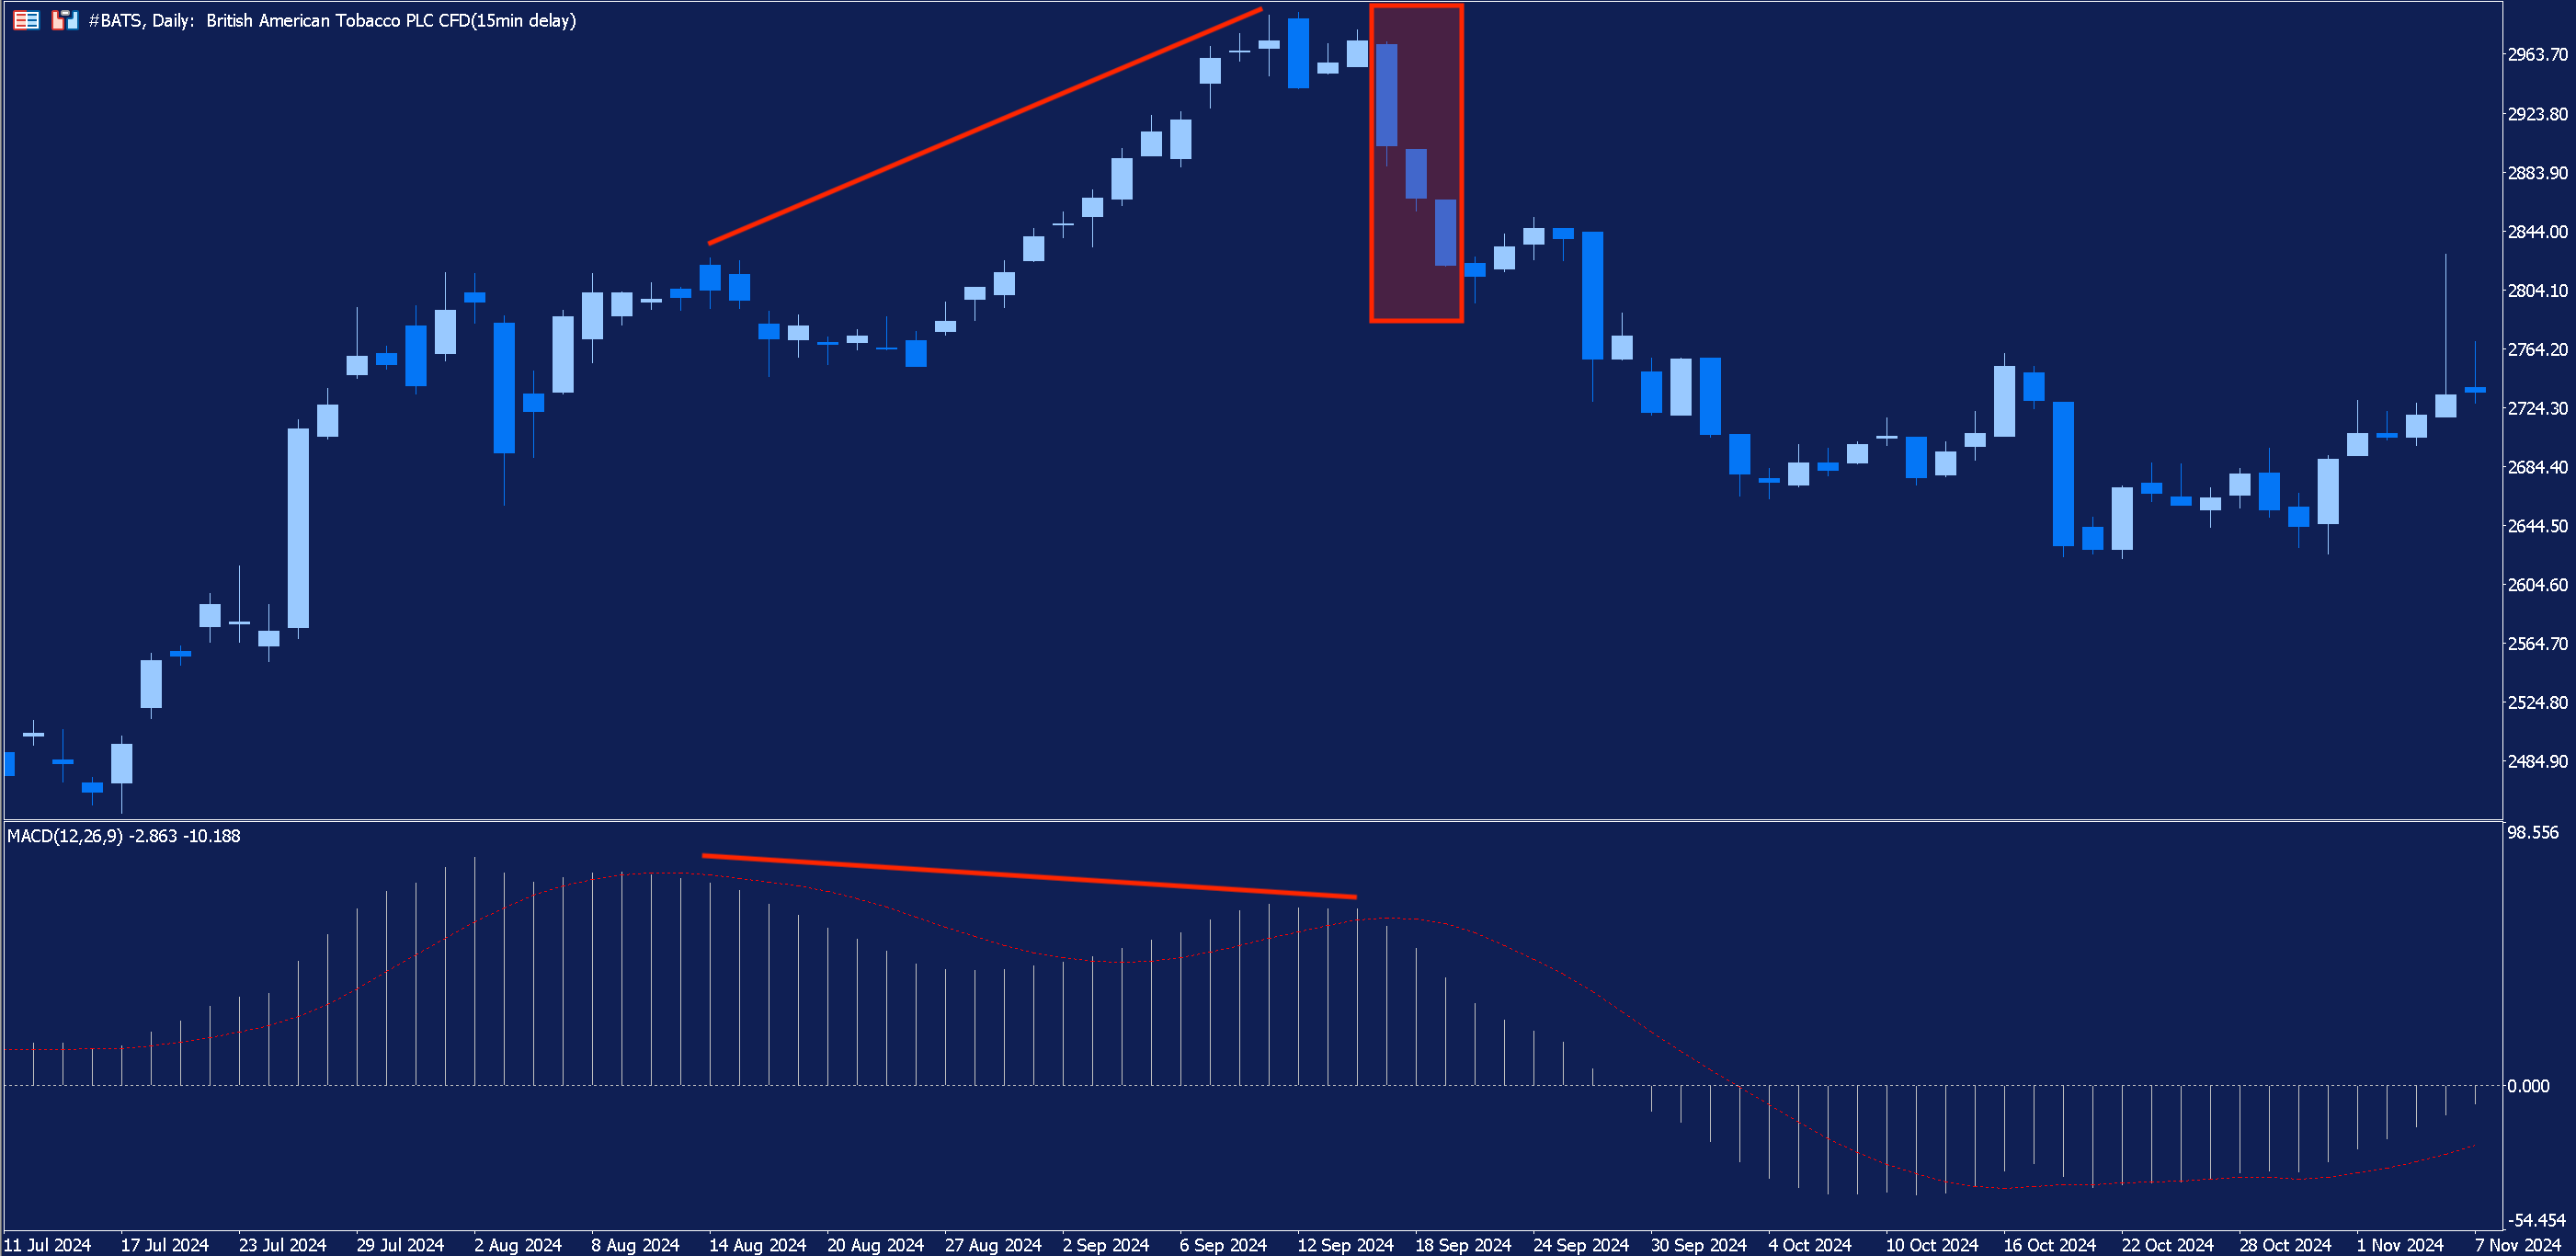
In the chart, we can see that in the buildup to the three black crows appearance, whilst share price continued making higher highs, the MACD began to make lower highs.
This is an example of divergence and, in real time, may have served as additional confirmation of the selling signal generated by the three black crows.
Entry and Exit
Provided traders have obtained additional confirmation of a reversal, they may consider entering the market after the close of the third candlestick in the pattern.
But when should traders look to exit their position?
The pattern itself doesn’t provide us with profit targets. Consequently, traders could use technical indicators or historical levels of support and resistance levels to help identify suitable conditions for exiting their trade.
Risk Management
Even when using technical indicators and other tools to help filter out false signals, there is no guarantee that the downward movement in price will materialise.
Consequently, it is always important for traders to conduct thorough analysis and exercise good risk management when trading.
Trading is inherently risky. Before opening a position in the market, traders should carefully assess their risk tolerance. Never risk too much on any one trade and consider using risk management tools, such as stop loss orders.
Real-World Examples
Let’s take a look at another example of trading the three black crows to see how things might pan out in real-time for traders.
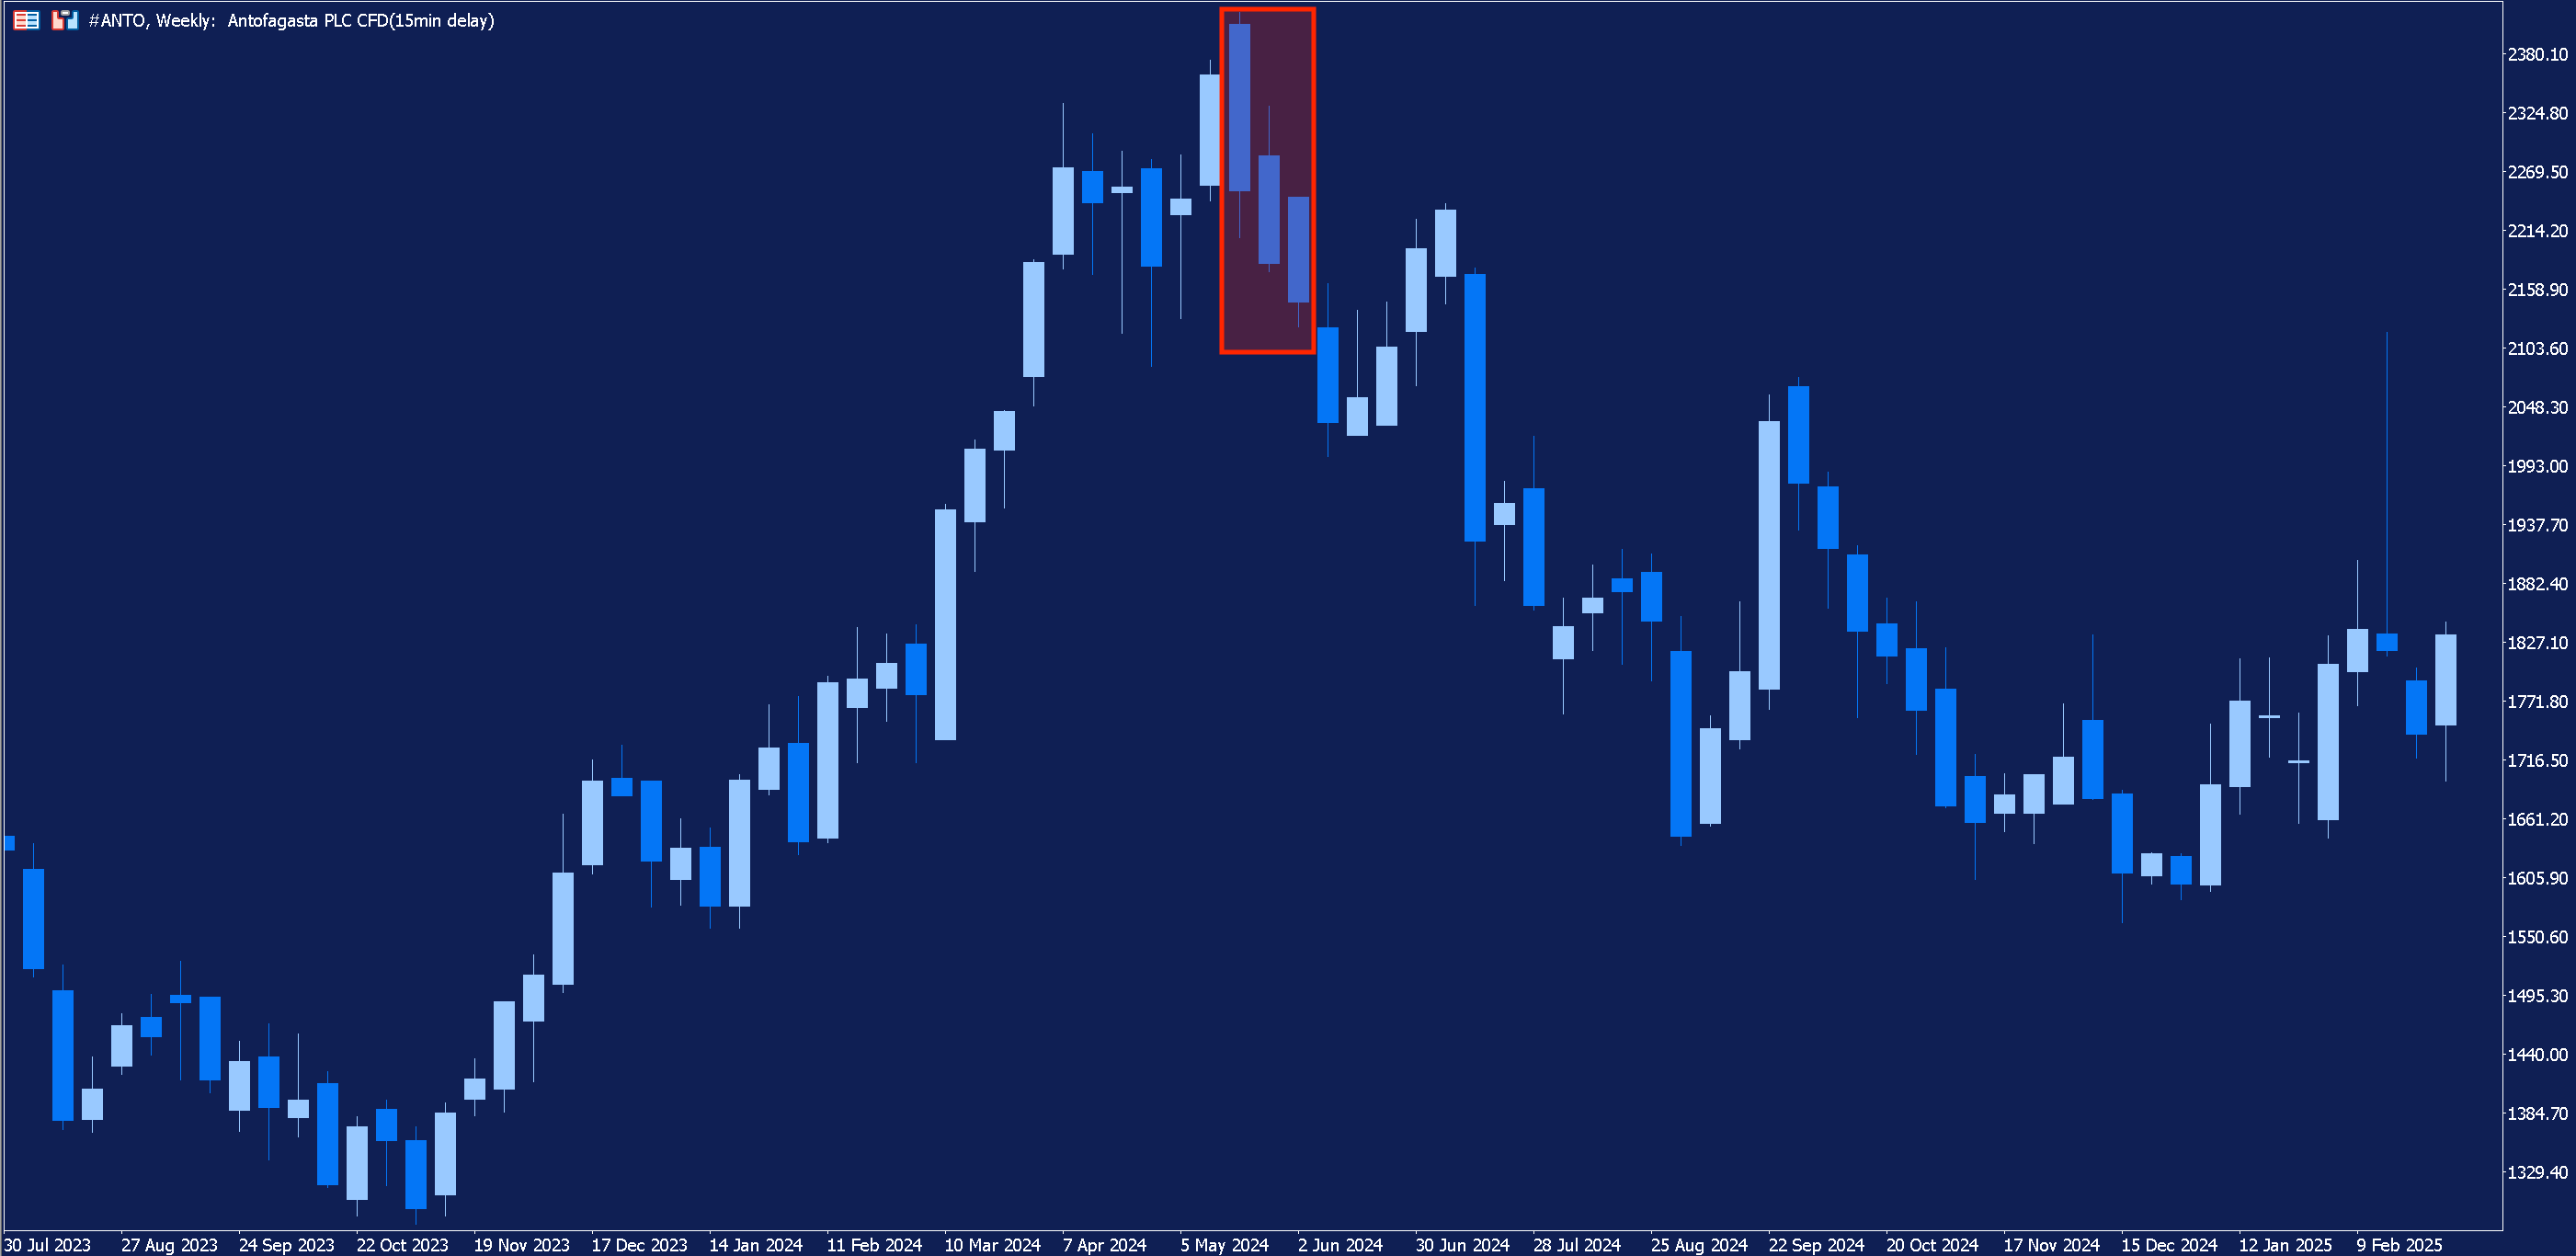
Below, in the weekly chart of UK-listed mining stock Antofagasta, we can see that, at the top of an upward movement in price, the three black crows appear.
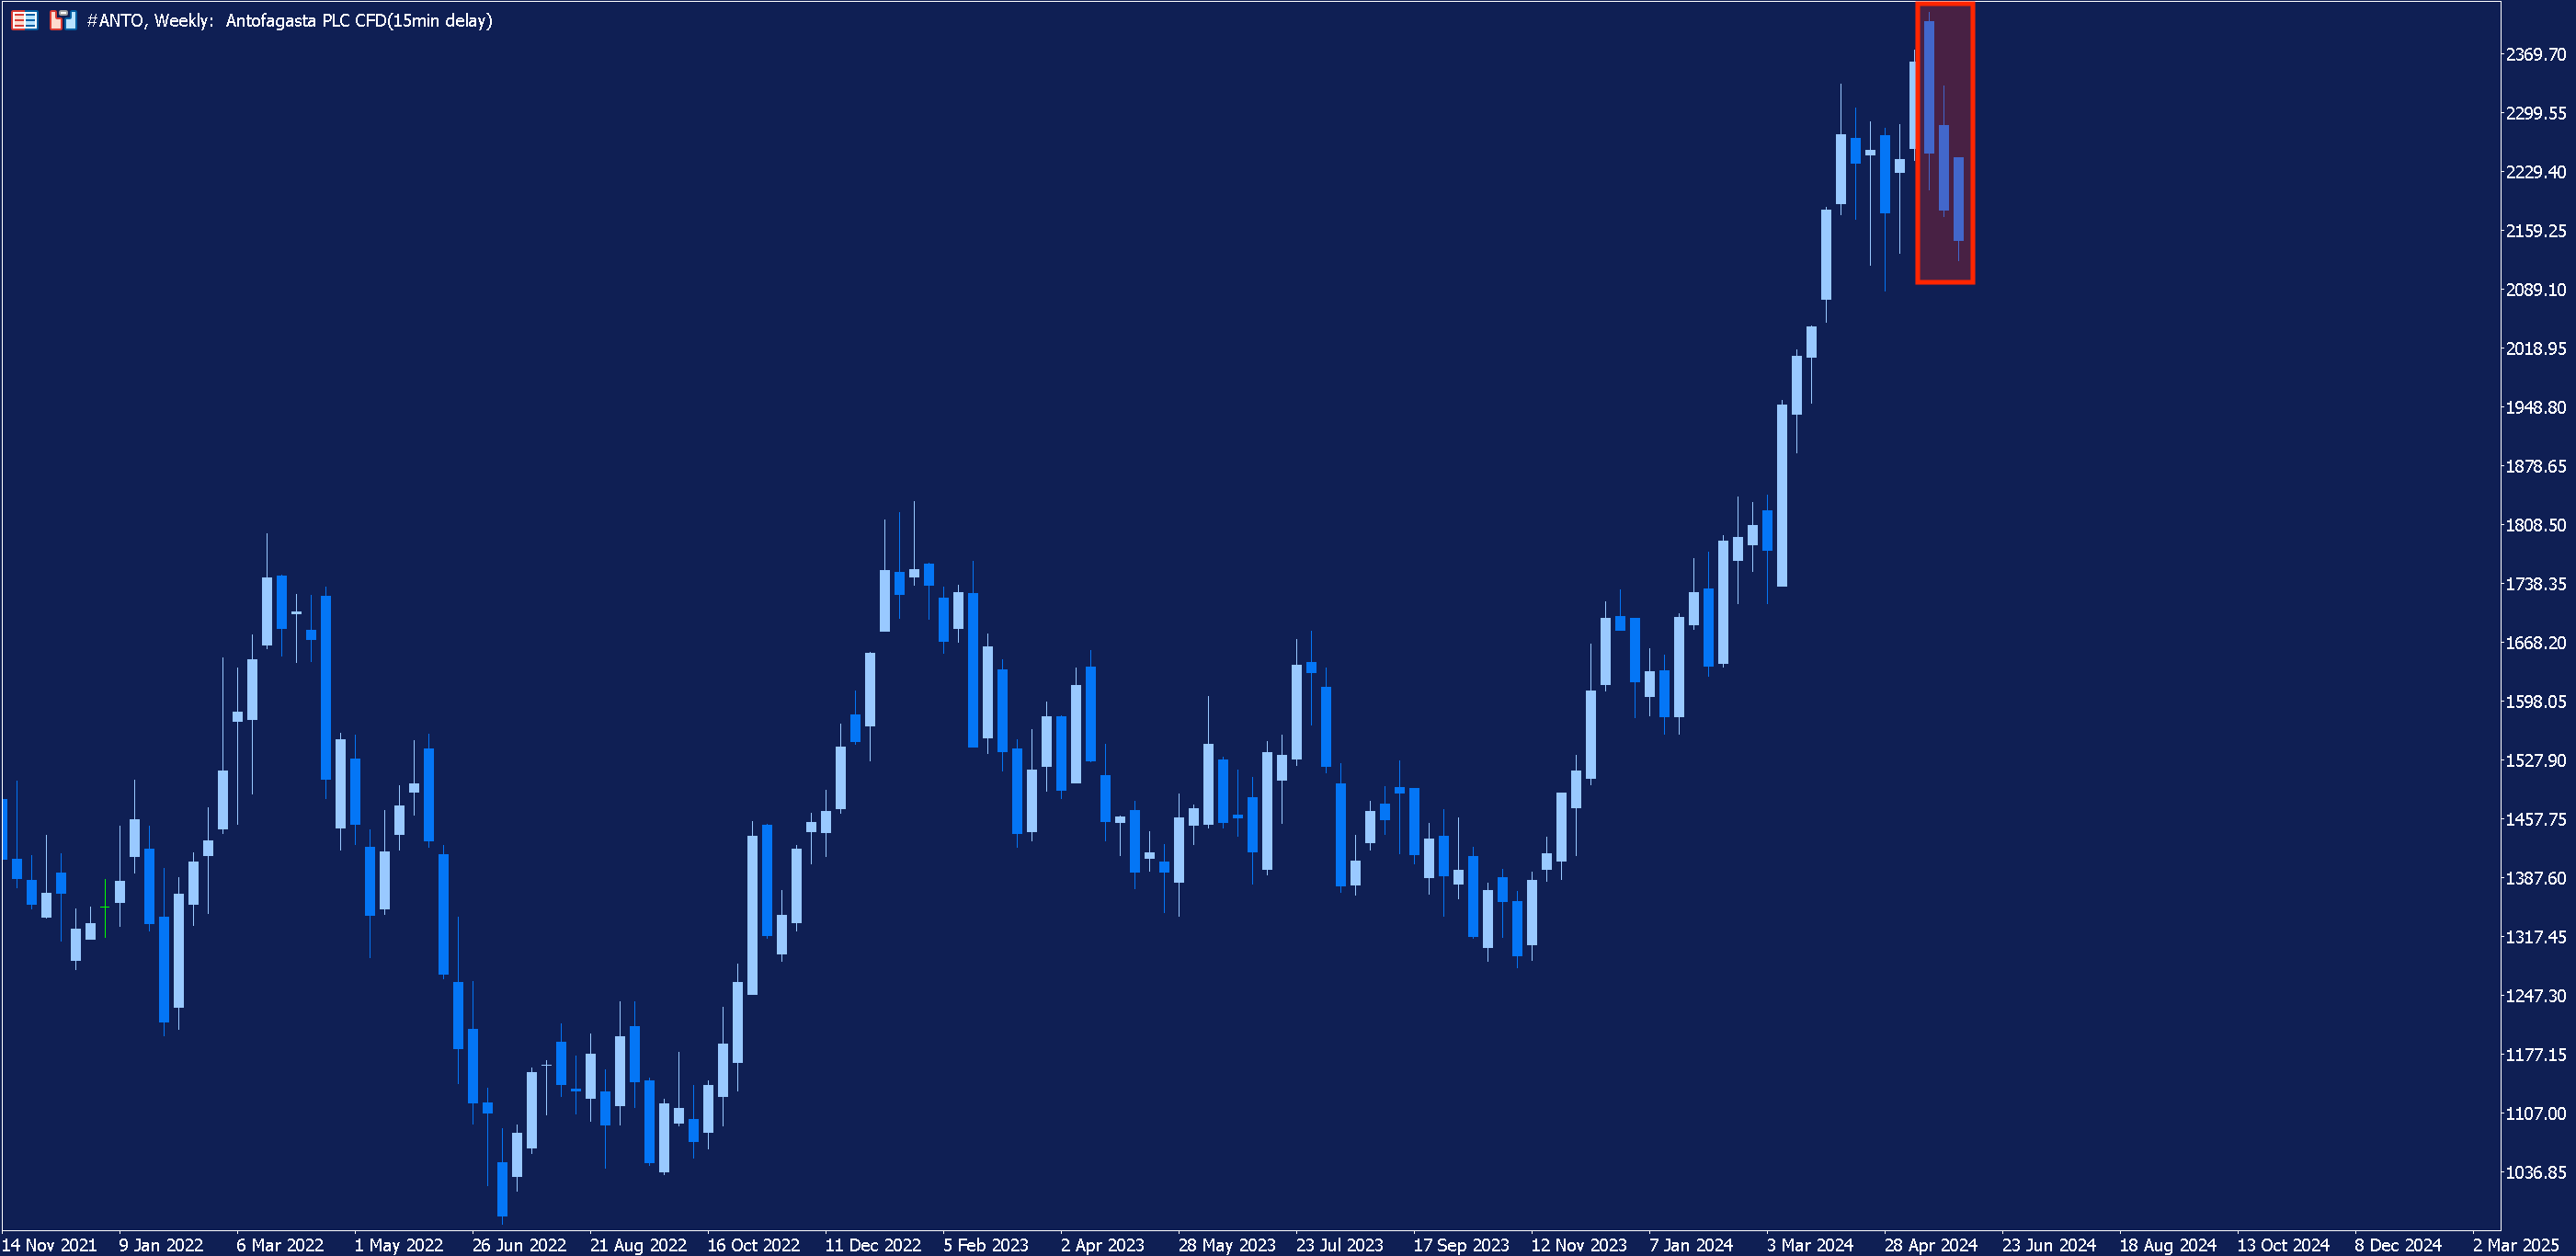
The three black crows signals to us that a bearish reversal may be about to take place. But can we find confirmation?
Below, we have zoomed in on the chart and added the Stochastic Oscillator.
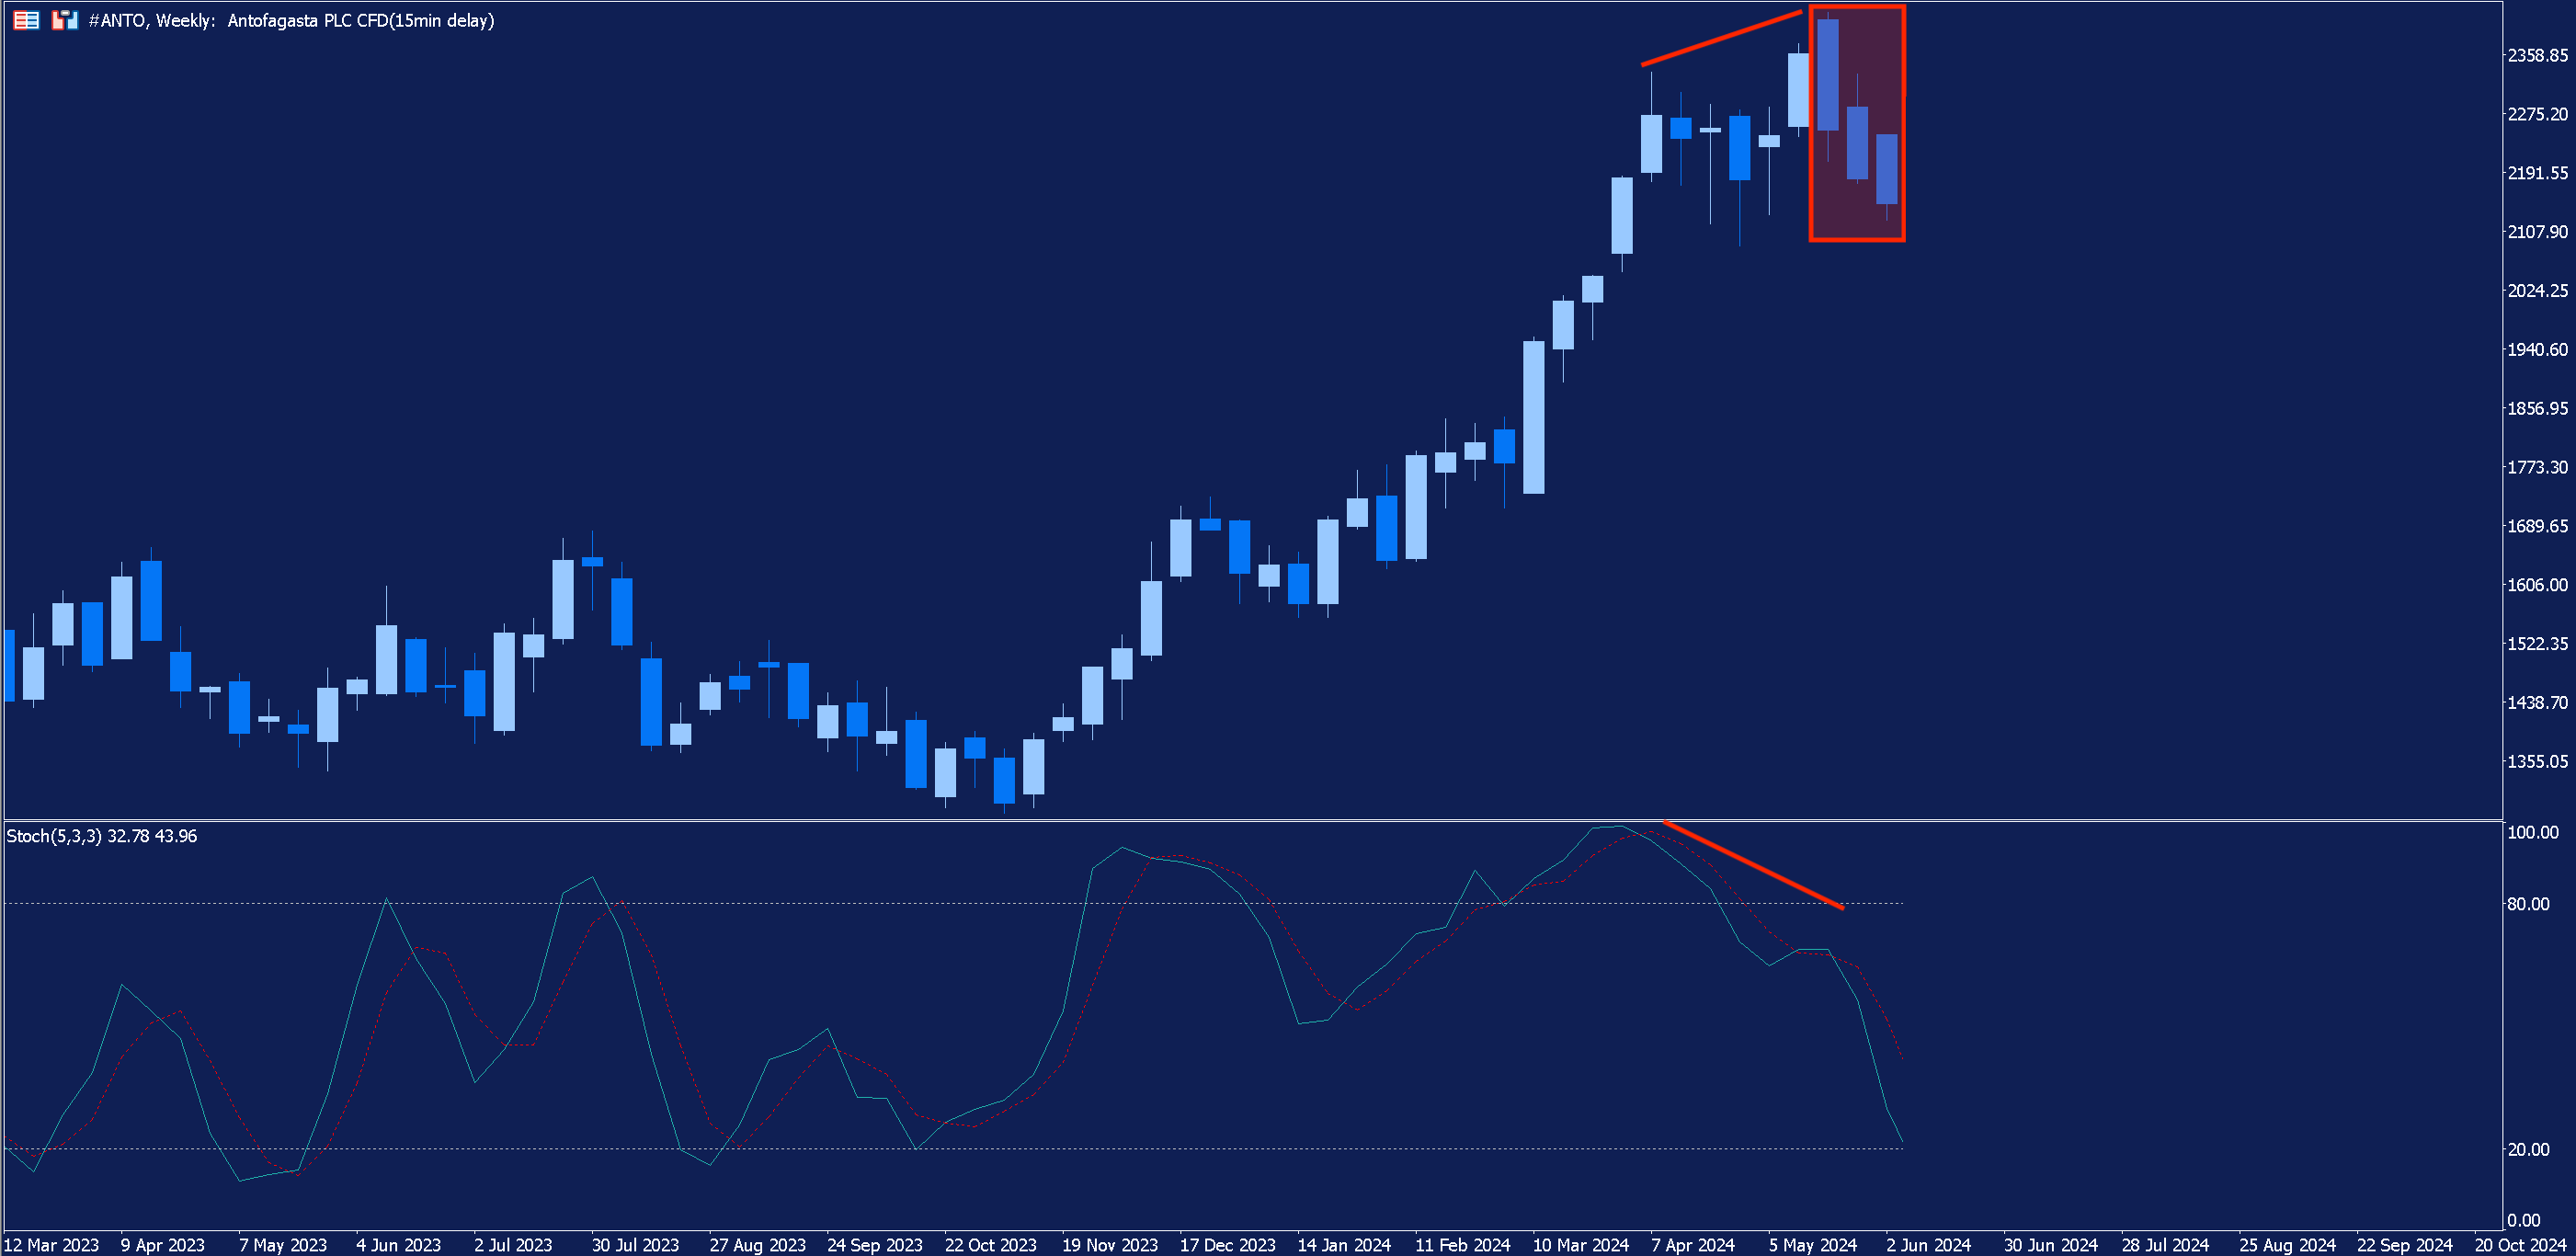
We can see that there is divergence between Antofagasta’s share price and the Stochastic Oscillator immediately preceding the bearish chart pattern. If trading in real time, traders may have considered entering the market based on this additional evidence. However, before doing so, traders must ensure they are aware of the risks involved in any trade.
Moving the chart on, we can see that the candlestick pattern was indeed followed by a period of falling share price.
Common Mistakes to Avoid
The markets can be unpredictable and it's important to note that, despite getting additional confirmation of a reversal as we did above, it’s possible that prices could continue trending upwards after the pattern has formed.
That’s why risk management is so important when trading. Don’t forget to set a stop-loss when taking a position - it can help to protect your capital against adverse market movements.
Other common mistakes to avoid include:
- Ignoring Oversold Conditions. If price moves downwards significantly during the formation of the three black crows, it’s possible that the asset will become oversold, which could lead to a consolidation or a rebound in price. Traders can assess overbought/oversold conditions using technical indicators such as the RSI.
- Trading Without Confirmation. Don’t jump into a trade without seeking additional confirmation of a reversal in price.
- Ignoring Market Conditions. The three black crows is considered a bearish reversal pattern when it appears after an upward movement in price. If the pattern appears in different market conditions, it may not be a valid signal.
Conclusion
The three black crows is a bearish reversal pattern characterised by three consecutive bearish candles which have long bodies and short, or no, wicks.
Although it is considered to be a signal of an impending reversal to the downside, traders should avoid entering trades until they have sought additional confirmation of this using other methods.
In this article, we examined how this could be done by using technical indicators to spot divergence. However, this is just one method. Traders may also analyse support and resistance levels, look for other bearish candlestick patterns or use other technical indicators.
The MetaTrader 5 Trading Platform
Traders who choose Admirals gain access to MetaTrader 5 (MT5), an advanced trading platform which offers a vast range of technical indicators, charting tools and options for automated trading. Click the banner below to download MT5 today:

INFORMATION ABOUT ANALYTICAL MATERIALS:
The given data provides additional information regarding all analysis, estimates, prognosis, forecasts, market reviews, weekly outlooks or other similar assessments or information (hereinafter “Analysis”) published on the websites of Admirals investment firms operating under the Admirals trademark (hereinafter “Admirals”) Before making any investment decisions please pay close attention to the following:
- This is a marketing communication. The content is published for informative purposes only and is in no way to be construed as investment advice or recommendation. It has not been prepared in accordance with legal requirements designed to promote the independence of investment research, and that it is not subject to any prohibition on dealing ahead of the dissemination of investment research.
- Any investment decision is made by each client alone whereas Admirals shall not be responsible for any loss or damage arising from any such decision, whether or not based on the content.
- With view to protecting the interests of our clients and the objectivity of the Analysis, Admirals has established relevant internal procedures for prevention and management of conflicts of interest.
- The Analysis is prepared by an analyst (hereinafter “Author”). The Author Roberto Rivero is a contractor for Admirals. This content is a marketing communication and does not constitute independent financial research.
- Whilst every reasonable effort is taken to ensure that all sources of the content are reliable and that all information is presented, as much as possible, in an understandable, timely, precise and complete manner, Admirals does not guarantee the accuracy or completeness of any information contained within the Analysis.
- Any kind of past or modelled performance of financial instruments indicated within the content should not be construed as an express or implied promise, guarantee or implication by Admirals for any future performance. The value of the financial instrument may both increase and decrease and the preservation of the asset value is not guaranteed.
- Leveraged products (including contracts for difference) are speculative in nature and may result in losses or profit. Before you start trading, please ensure that you fully understand the risks involved.