Understanding the Three White Soldiers Candlestick Pattern
The three white soldiers is a candlestick pattern which appears after a downtrend and signals a potential bullish reversal. Whilst the pattern can be used to identify buying opportunities in the markets, traders should seek additional confirmation of a reversal before entering the market.
In this article, we will examine the three white soldiers pattern in detail. We will show how it can be identified, explain how to help reduce false signals and demonstrate how to incorporate it into your trading strategy. Keep reading to find out all this and more!
| The information in this article is provided for educational purposes only and does not constitute financial advice. Consult a financial advisor before making investment decisions. |
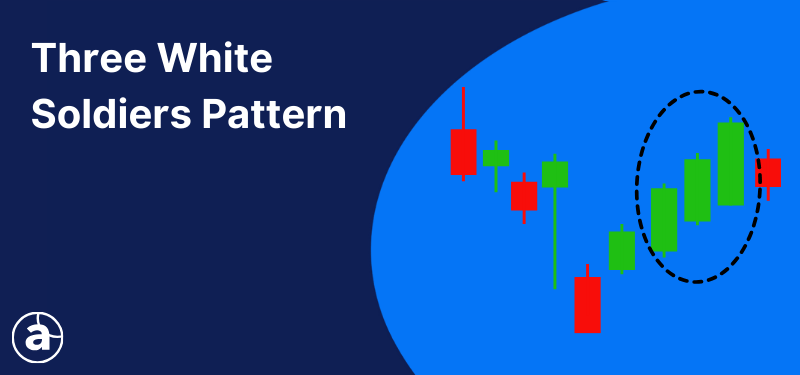
Table of Contents
What Are Candlestick Patterns?
Each candle on a candlestick chart highlights how an asset’s price has behaved during the session. The candle’s body denotes the range between the session’s opening and closing prices, whilst the shadows which extend from either end indicate the session’s high and low.
Over time, amongst all the price action, familiar patterns can emerge, which are formed by one or more candlesticks.
These candlestick patterns provide insight into how buyers and sellers are interacting in the market and, consequently, can be used by traders to predict where price may be heading next.
The three white soldiers is one such candlestick pattern. It can be used by traders to identify potential buying opportunities in UK stocks, Forex pairs and many other financial markets.
Deciphering the Three White Soldiers
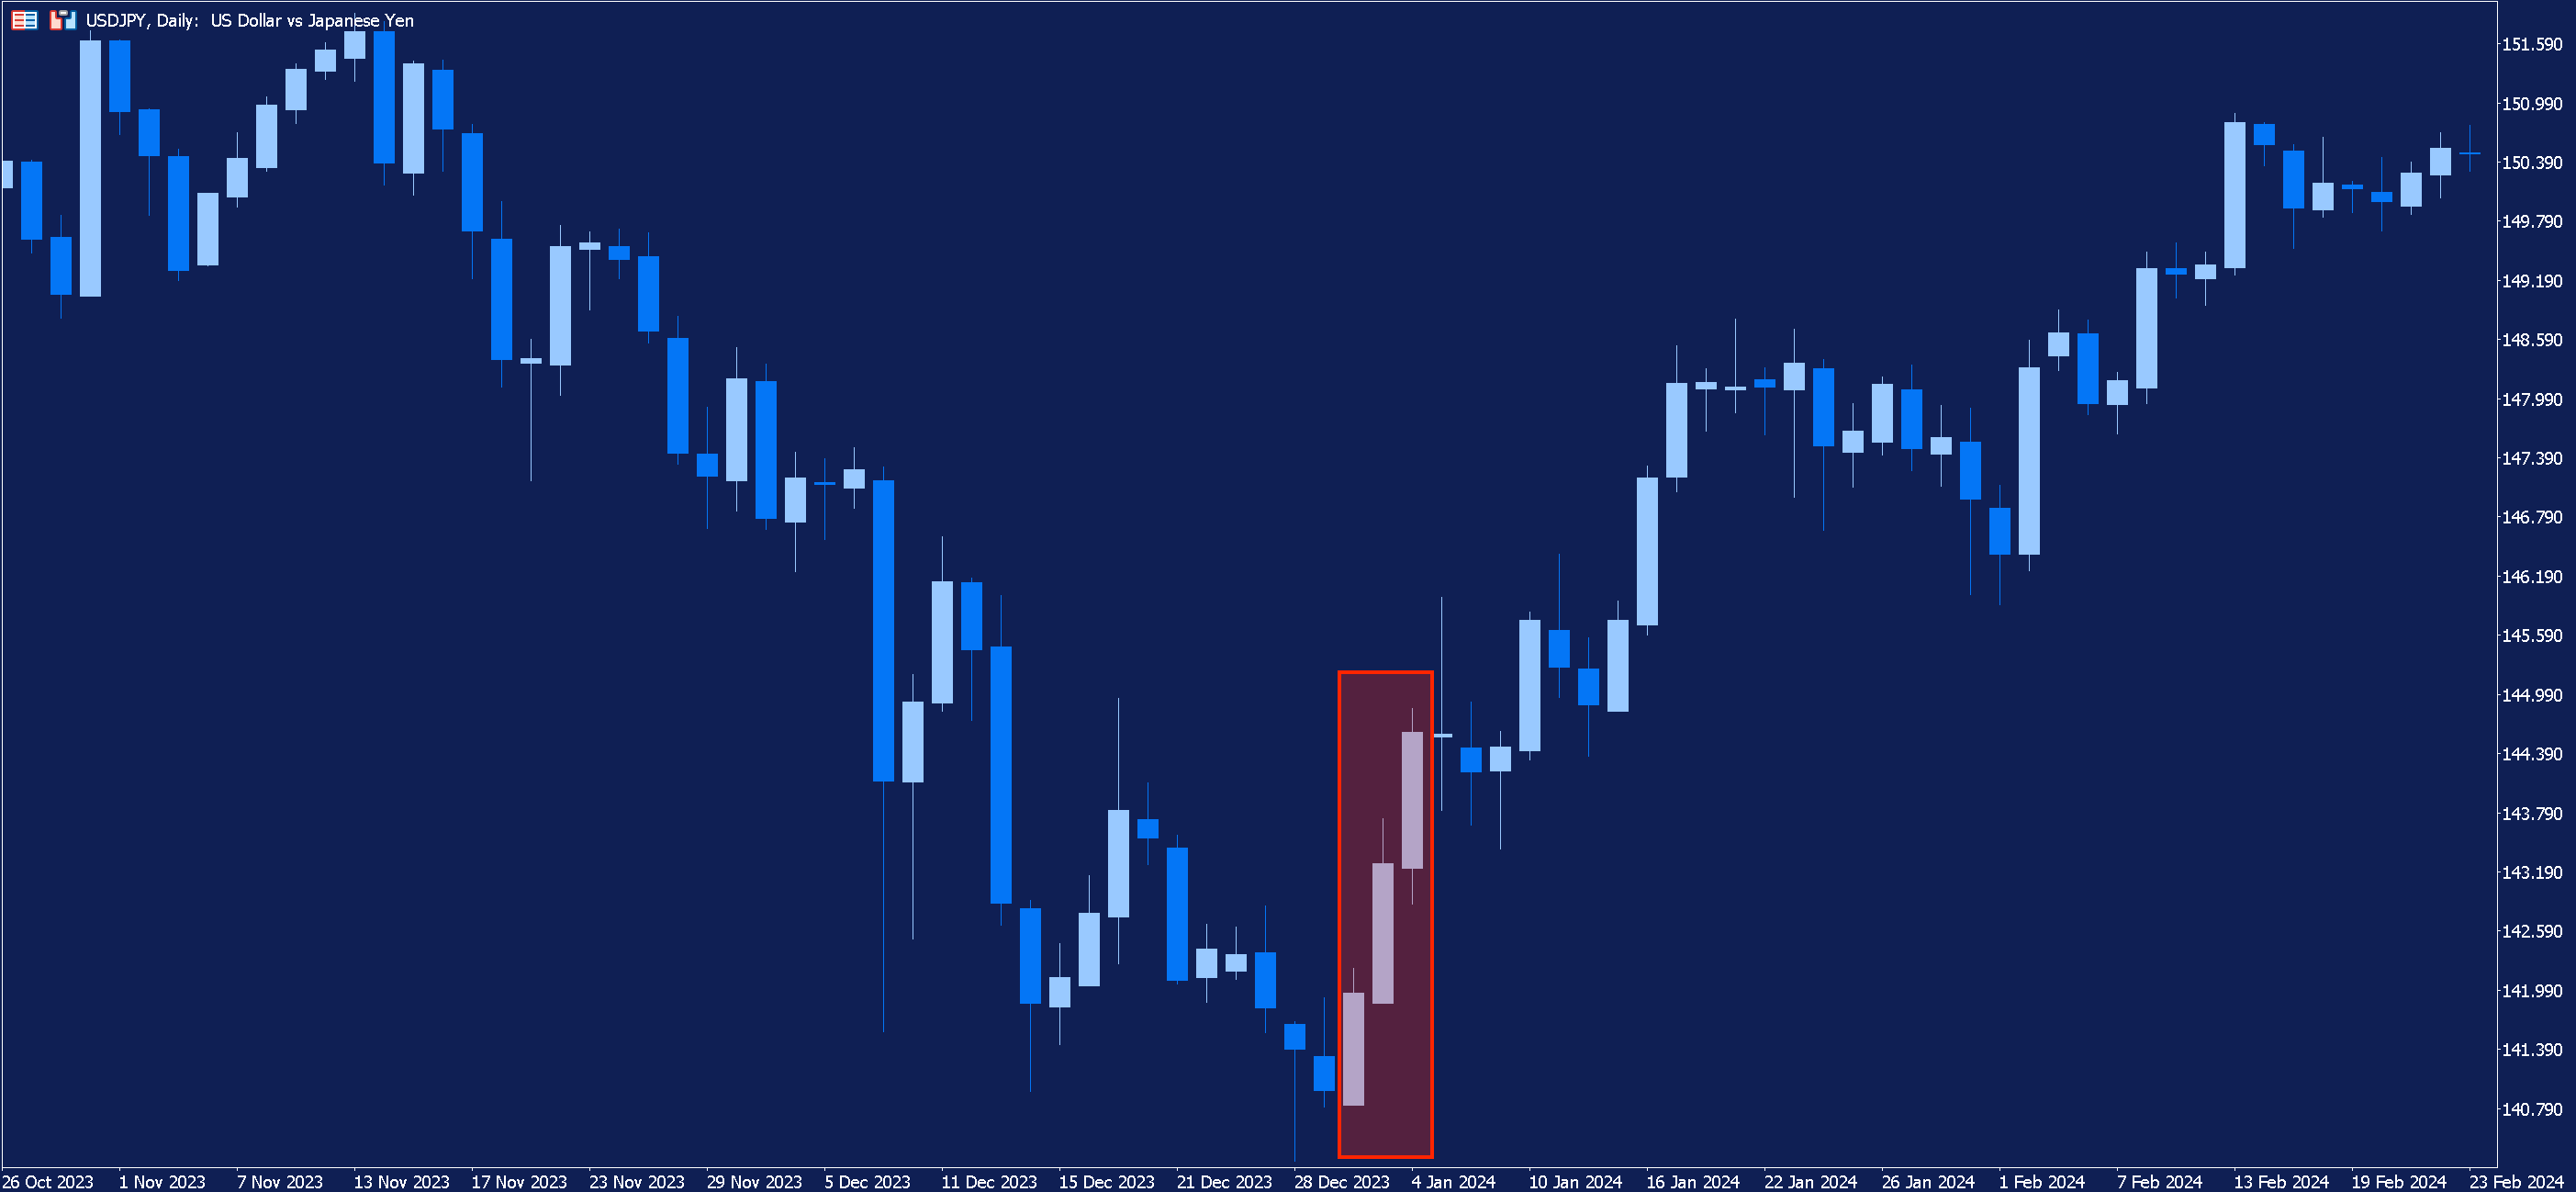
The three white soldiers pattern is formed by three consecutive bullish candlesticks, all of which have long bodies and small, or no, wicks. Each candle opens within the previous candle’s body and closes higher than the previous candle’s high.
The pattern indicates that, following a downtrend, there has been a sustained increase in buying pressure. It suggests that sellers may have run out of steam and that buyers may be seizing control of the market.
The pattern appears in downtrends and signals a potential reversal in price. Although some may consider the pattern to be a reliable reversal signal on its own, traders should seek additional confirmation of a reversal before entering the market.
In order for the three white soldiers pattern to be valid, the following should be true:
- There must be a noticeable downtrend.
- At the bottom of the downtrend, there are three consecutive bullish candles with long bodies and small, or no, wicks.
- Each candle must open within the body of the previous candle.
- Each candle must close above the high of the previous candle.
Below is an example of the three white soldiers pattern appearing in a daily chart of the USDJPY currency pair.
Practise Trading the Three White Soldiers Pattern on a Risk-Free Demo Account!

Trading Strategies with the Three White Soldiers Pattern
Whilst some traders may consider the three white soldiers enough of a signal to enter the market, the more prudent approach to trading the pattern would be to seek additional confirmation of a reversal before opening a position.
Traders can do this by using technical indicators such as the Relative Strength Index (RSI), Commodity Channel Index (CCI) and the Stochastic Oscillator.
Let’s take a look at an example.
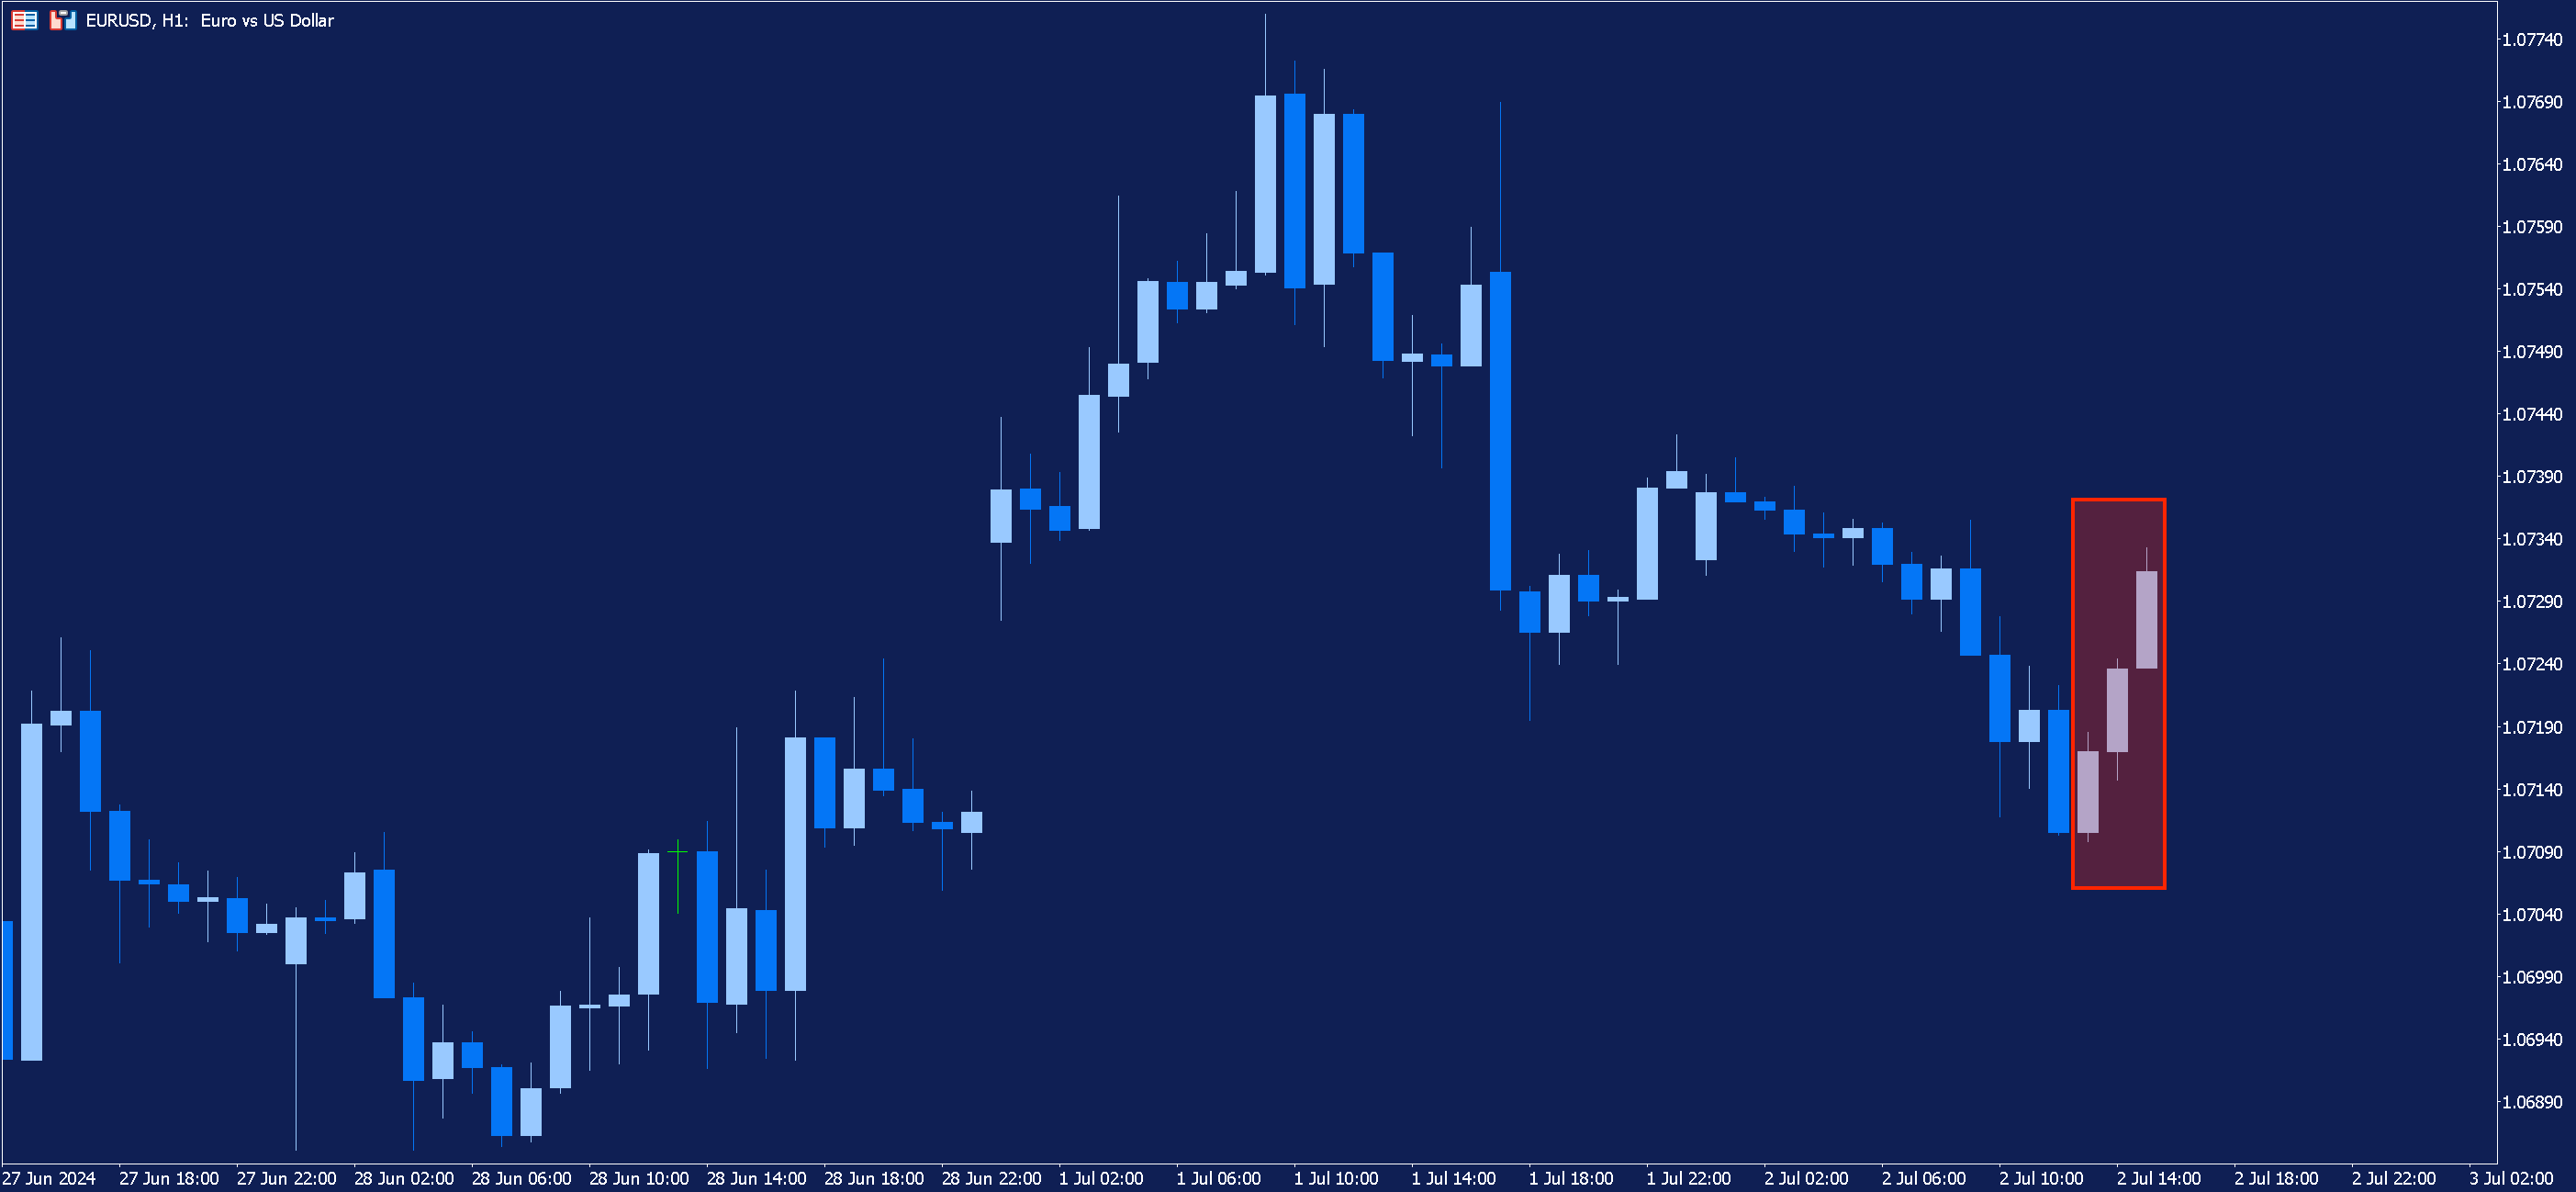
Above is an hourly chart of the EURUSD currency pair. After a downward movement, the three white soldiers pattern is formed, indicating a potential reversal in price.
But how can we look for confirmation of this? One method is by using the Commodity Channel Index (CCI) to spot divergences between the asset’s price and the indicator.
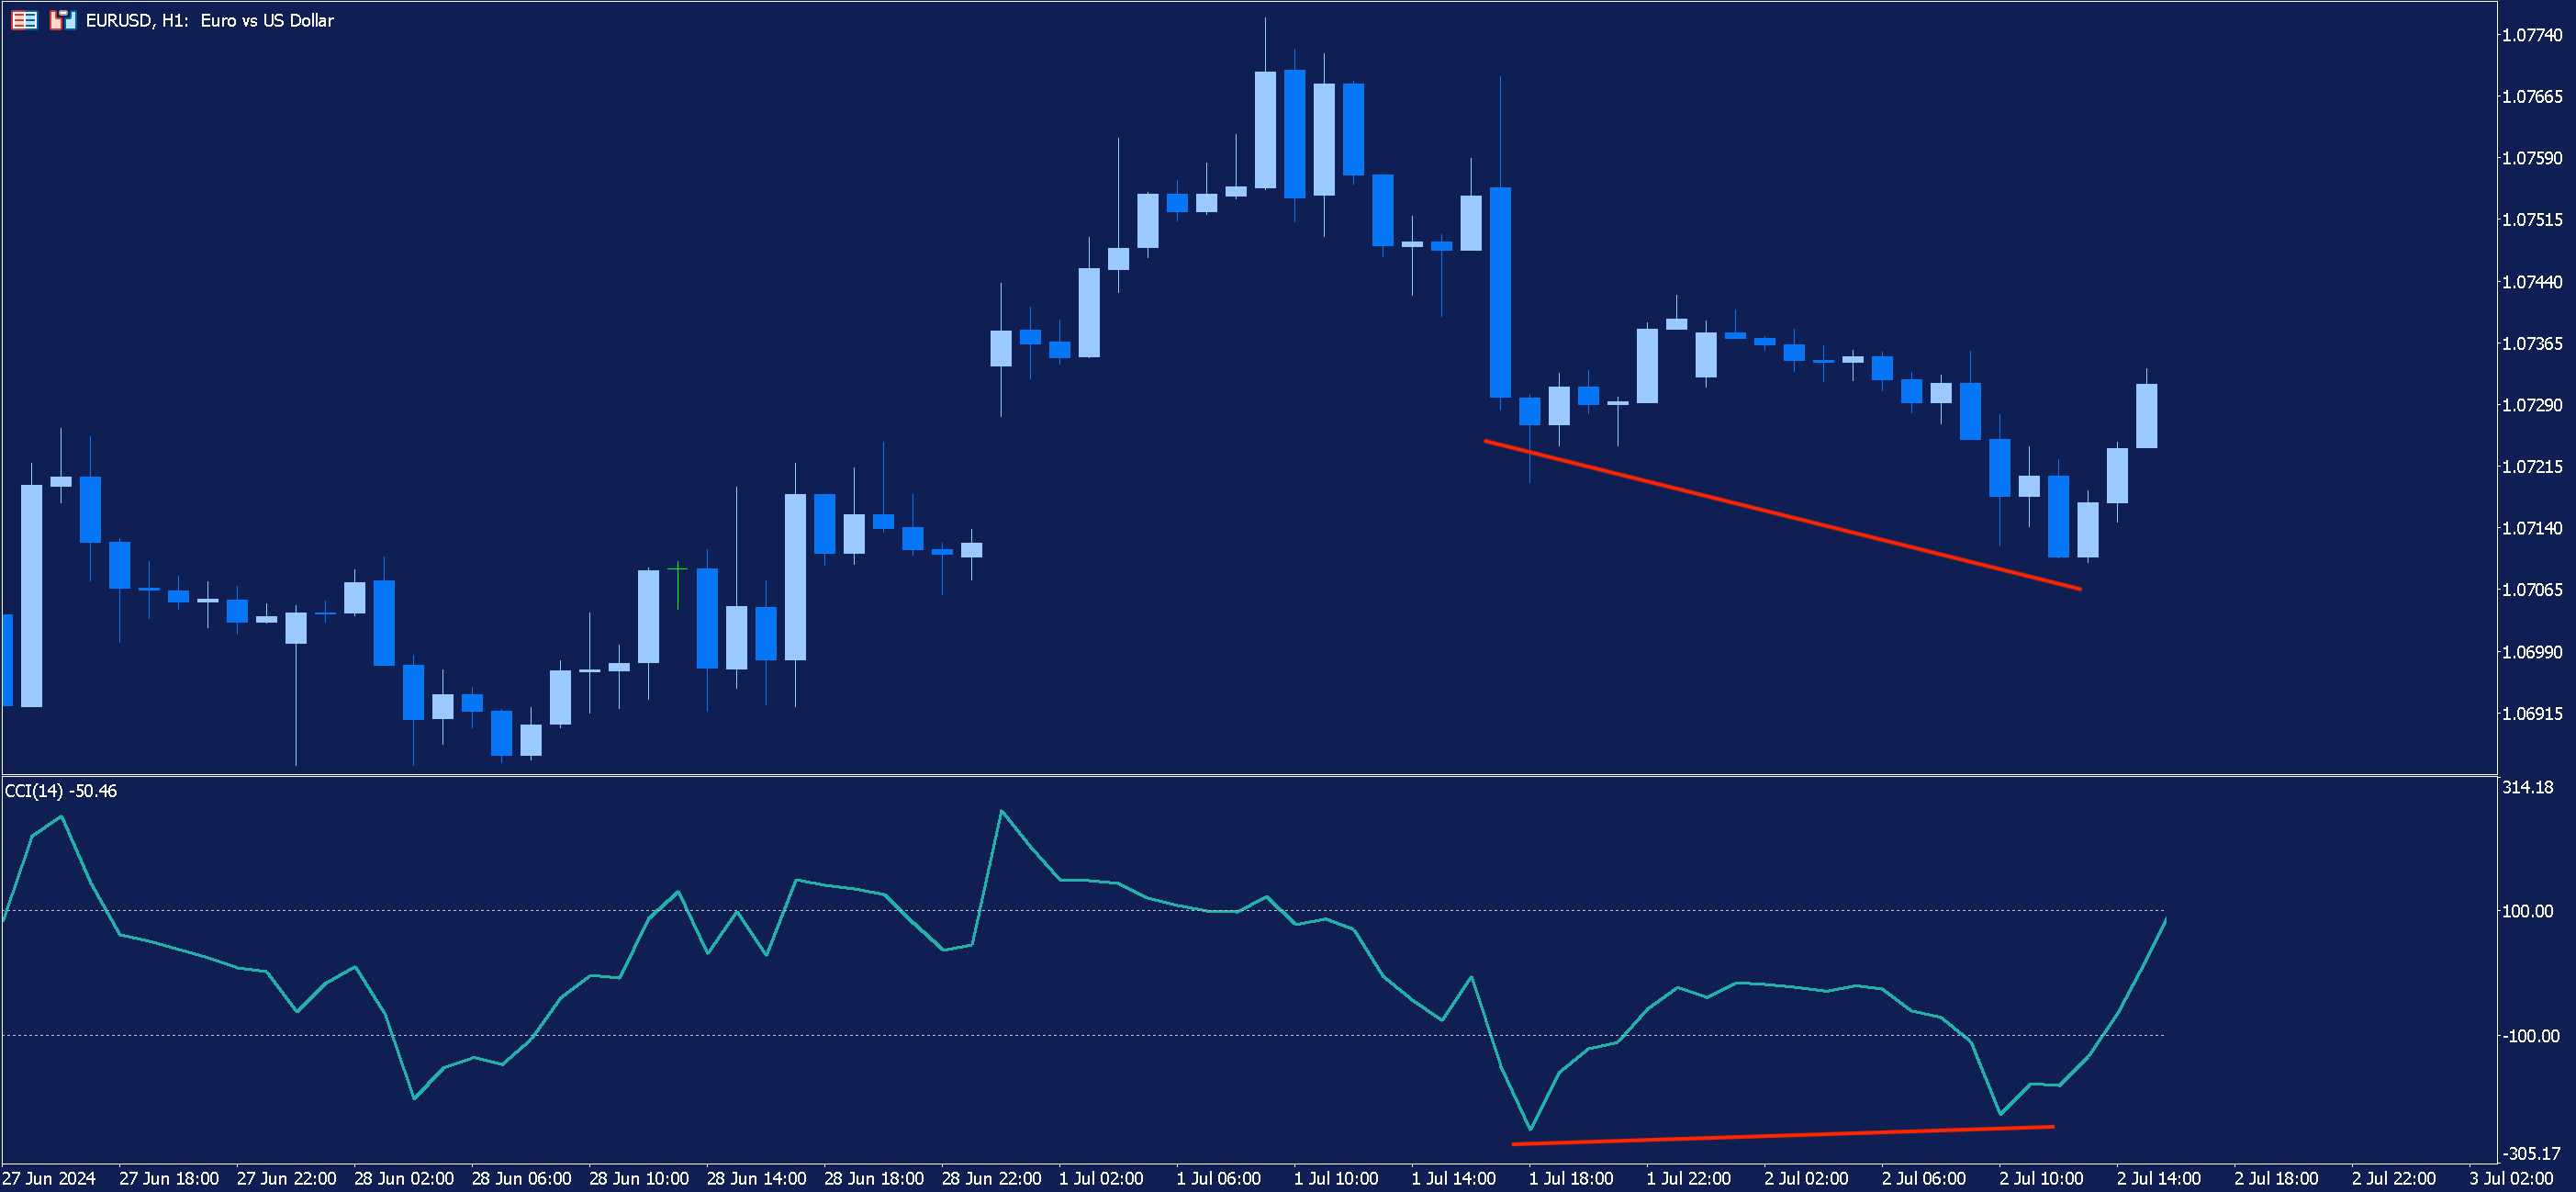
We have added the CCI indicator to the chart above. Prior to the formation of the three white soldiers, we can see that, whilst EURUSD was recording lower lows, the CCI was recording higher lows.
This is an example of divergence, which is a signal that price may be about to change direction.
In this example, now that traders have found additional confirmation of a potential reversal, they may choose to enter a long position. Let’s move the chart along to see what happened next.
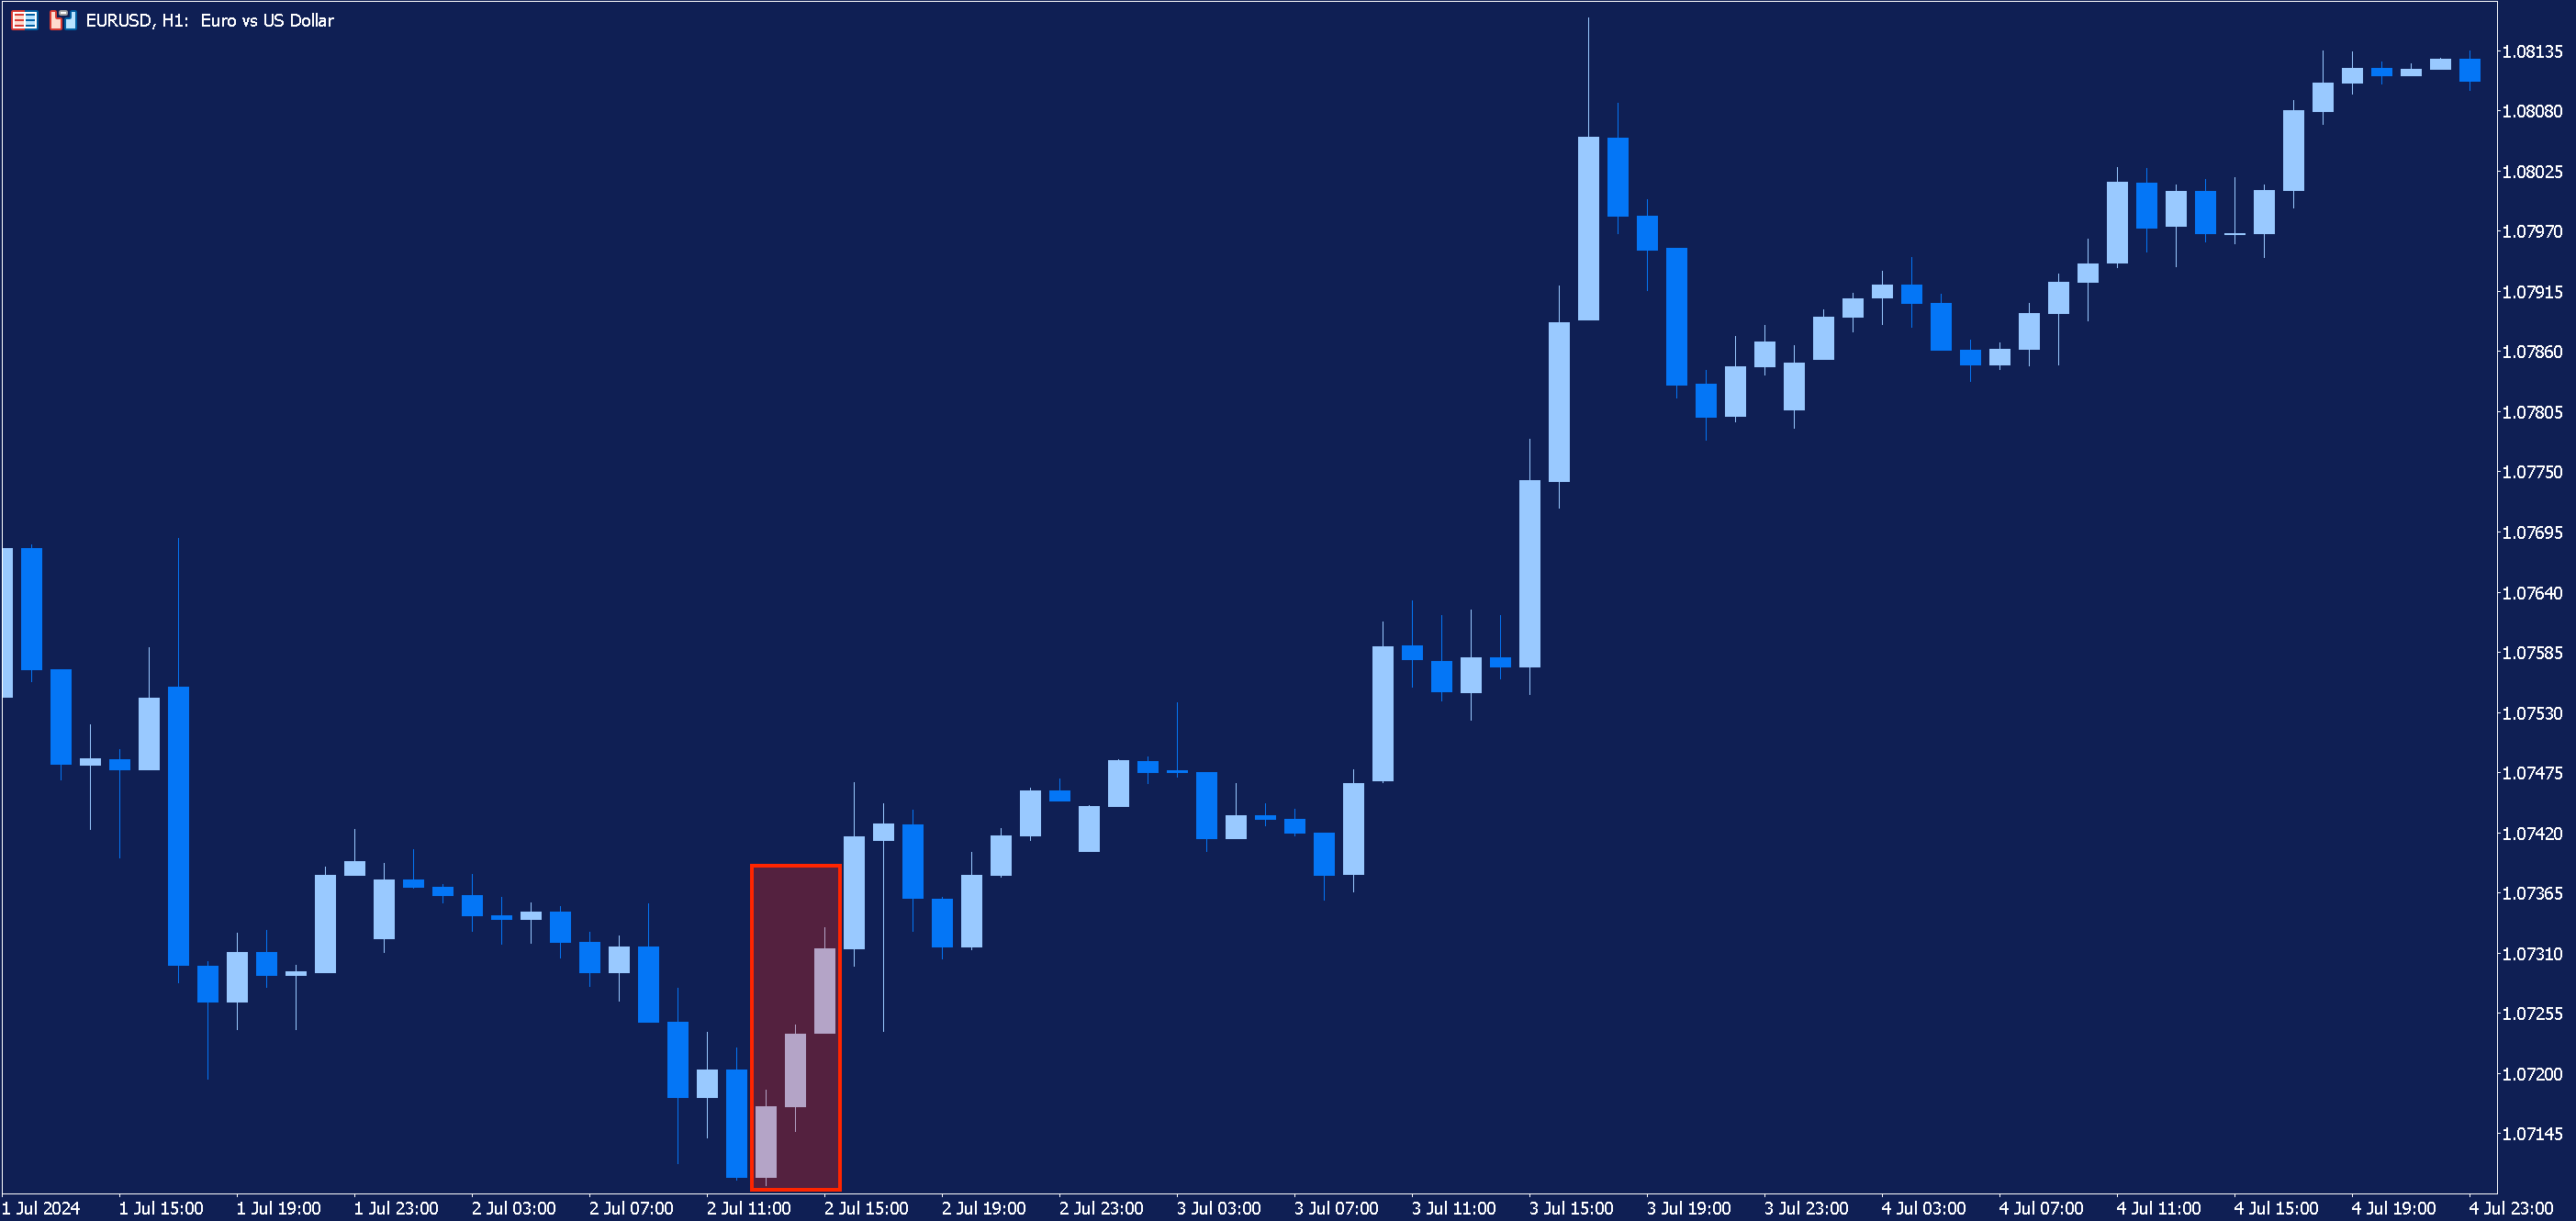
Surely enough, following the bullish reversal signal, prices continue moving upwards, which would have resulted in a winning trade if we had entered the market after the formation of the three white soldiers.
However, it’s important to note that, even with additional confirmation, prices could have continued falling, which would have resulted in a losing trade.
Remember that trading always involves risk, which is why it is important to exercise good risk management. This includes setting a stop-loss, which can help limit your losses if the market moves against you.
Trade with Admiral Markets
With a Trade.MT5 account from Admiral Markets, you can trade Contracts for Difference (CFDs) on a range of markets, including Forex, stocks and commodities. Click the banner below to register for an account today:

Conclusion
The three white soldiers is a bullish reversal pattern, characterised by three consecutive bullish candlesticks which have long bodies and short, or no, wicks.
Although it is considered to be a signal of an imminent price reversal, traders should avoid entering the market until they have found additional confirmation of a reversal by using other technical analysis tools, such as technical indicators. In this article, we examined how this can be done using the CCI indicator; however, this is just one method of doing so. Traders may also use other technical indicators, look out for other bullish candlestick patterns or analyse support and resistance levels.
If you’re interested in learning about other candlestick patterns, as well as learning more about a variety of other trading and investing topics, check out the rest of our educational articles.
INFORMATION ABOUT ANALYTICAL MATERIALS:
The given data provides additional information regarding all analysis, estimates, prognosis, forecasts, market reviews, weekly outlooks or other similar assessments or information (hereinafter “Analysis”) published on the websites of Admiral Markets' investment firms operating under the Admiral Markets trademark (hereinafter “Admiral Markets”). Before making any investment decisions please pay close attention to the following:
- This is a marketing communication. The content is published for informative purposes only and is in no way to be construed as investment advice or recommendation. It has not been prepared in accordance with legal requirements designed to promote the independence of investment research, and that it is not subject to any prohibition on dealing ahead of the dissemination of investment research.
- Any investment decision is made by each client alone whereas Admiral Markets shall not be responsible for any loss or damage arising from any such decision, whether or not based on the content.
- With view to protecting the interests of our clients and the objectivity of the Analysis, Admiral Markets has established relevant internal procedures for prevention and management of conflicts of interest.
- The Analysis is prepared by an analyst (hereinafter “Author”). The Author, Roberto Rivero, is a contractor for Admiral Markets. This content is a marketing communication and does not constitute independent financial research."
- Whilst every reasonable effort is taken to ensure that all sources of the content are reliable and that all information is presented, as much as possible, in an understandable, timely, precise and complete manner, Admiral Markets does not guarantee the accuracy or completeness of any information contained within the Analysis.
- Any kind of past or modeled performance of financial instruments indicated within the content should not be construed as an express or implied promise, guarantee or implication by Admiral Markets for any future performance. The value of the financial instrument may both increase and decrease and the preservation of the asset value is not guaranteed.
- Leveraged products, including Contracts for Difference (CFDs) are speculative in nature and may result in losses or profit. Before you start trading, please ensure that you fully understand the risks involved.