The Morning Star Candlestick Pattern
This guide on the morning star candlestick pattern combines expert insights from leading market analysts and experienced traders in the UK, providing valuable knowledge for investors of all experience levels.
While there are numerous candlestick patterns to choose from, the morning star is useful in helping to identify bullish signs in the market. By understanding its formation and significance, traders can make more informed decisions about internal market dynamics and risk management on any trading opportunities, including the FTSE 100.
This material is for informational purposes only and not financial advice. Consult a financial advisor before making investment decisions.
Table of Contents
Key Takeaways
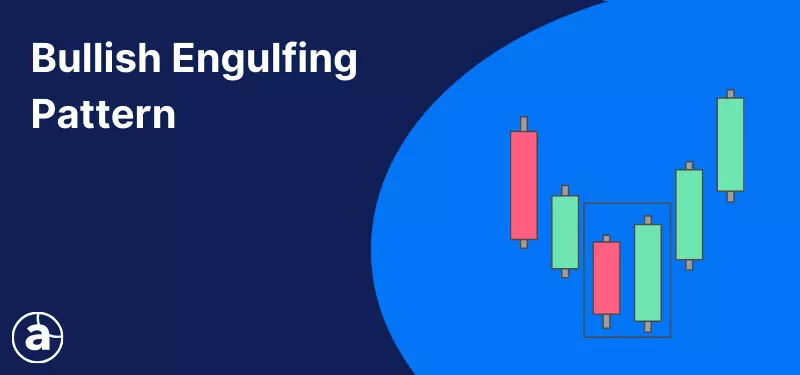
- The morning star candlestick pattern consists of three candles.
- It starts with a bearish first candle, followed by a small or indecisive second candle, and concludes with a bullish third candle.
- The pattern marks a shift from bearish to bullish sentiment and can signify the end of a bearish trend and possible upside momentum.
- The candle formation can help to identify possible bullish reversal opportunities on the FTSE 100 but as no single pattern is 100% effective, it's wiser to incorporate other technical and fundamental analysis tools.
- The Admirals Premium Analytics Screener can automatically detect a variety of chart and candlestick patterns across more than 8,000 global instruments.
Understanding the Morning Star Candlestick Pattern
There are three candles which create the morning start pattern.
- Bearish candle
- Small indecision candle
- Bullish candle

Definition
The first candle should be a bearish candle showing the continuation of its preceding downtrend. The second candle should be a small candle with a small body representing a pause in the market and indecision from sellers driving it lower. The third candle should be bullish signifying that the momentum has now shifted to the buyers in the market.
The market psychology of what these three candles represent together is a potential shift from a bearish to bullish trend. To ascertain whether it will be a temporary pullback of the preceding downtrend or the start of a bullish trend reversal, other technical clues are necessary.
This could be additional technical analysis indicators such as support and resistance levels or overbought/oversold oscillators, or it may also be fundamental analysis. As there is not one tool or method that works 100% of the time, traders look for times in the market where there are multiple pieces of evidence and clues converging.
Reliability and Trading Volume Considerations
The reliability of any candlestick pattern and any other type of technical analysis tool depends on how and when it is used. For example, if the pattern is used in a range-based market it may offer less reliability. That's because the morning star pattern represents a certain type of market psychology showing a shift from selling to buying sentiment - in a range-based market shifts in sentiment occur frequently.
This is why part of the definition of a morning star pattern is to identify it after a preceding downtrend. The second shows a pause in the selling, while the third candle represents buying. However, how does a trader know if the bullish sentiment is a mere pullback in a long-term downtrend or the start of the beginning of a new trend?
In this instance, a trader can never truly know as no one can predict the future, but this is where other technical analysis tools become useful. For example, if the morning star pattern occurred at a significant level of horizontal support where buyers have turned up in the past, then it adds a bit more weight to the potential of a bullish reversal.
Traders may also look at technical indicators such as momentum oscillators to look for further clues that selling momentum is waning, giving an opportunity for buyers to take control of the market.
Trading Volume
When trading individual stocks, traders can identify the volume of buying and selling taking place. This type of information isn't available on currency pairs as the forex market is decentralised and forex brokers provide quotes from different liquidity sources.
Ideally, traders will want to see a morning star candlestick pattern that develops with high volume, in particular on the third bullish candle. If the volume in the preceding downtrend has started to fall it signifies that there are not as many sellers initiating new positions. If the third bullish candle exceeds the volume of the past few candles, it can signify a huge shift in sentiment towards buyers.
Applying Technical Analysis on the FTSE 100
There are a variety of technical analysis tools that can be used to analyse and trade the FTSE 100 stock market index, UK shares and other asset classes.
Candlestick Charting Principles
Candlestick charting originated in Japan centuries ago. It was initially used by rice traders to track price movements in the 18th century but was only adopted in the West during the 20th century. They are now widely used to trade on global asset classes.
A candle formation is relatively simple and consists of a vertical box, known as the body, with two lines on either side, known as the wick.

The colours of candlesticks can be changed on any trading platform. In the example above, the red candle is bearish as it closed lower than where it opened. The green candle is bullish as it closed higher than where it opened.
Essentially, candles give the trader details into the opening and closing price of the time period on the chart you are on (daily, 4-hour, 1-hour candle, etc), as well as the high and low prices during that time. Therefore, by analysing the relationship between these it can help provide insight into market psychology.
Of the 42 recognised candlestick patterns, each one has a different shape and size, reflecting the different buying and selling pressures from traders in the market. These candlestick patterns can represent bullish, bearish and indecision situations in the market.
Therefore, applying these candlestick patterns on the FTSE 100 and other instruments can help traders to understand internal market dynamics and possible trading opportunities. The challenge is in finding these candlestick patterns. This is where the algorithmic screeners can help.
The Premium Analytics Candlestick Screener
The Admirals Premium Analytics candlestick screener is a powerful tool that can elevate your trading strategies. It scans thousands of global markets, keeping you informed about emerging technical events.
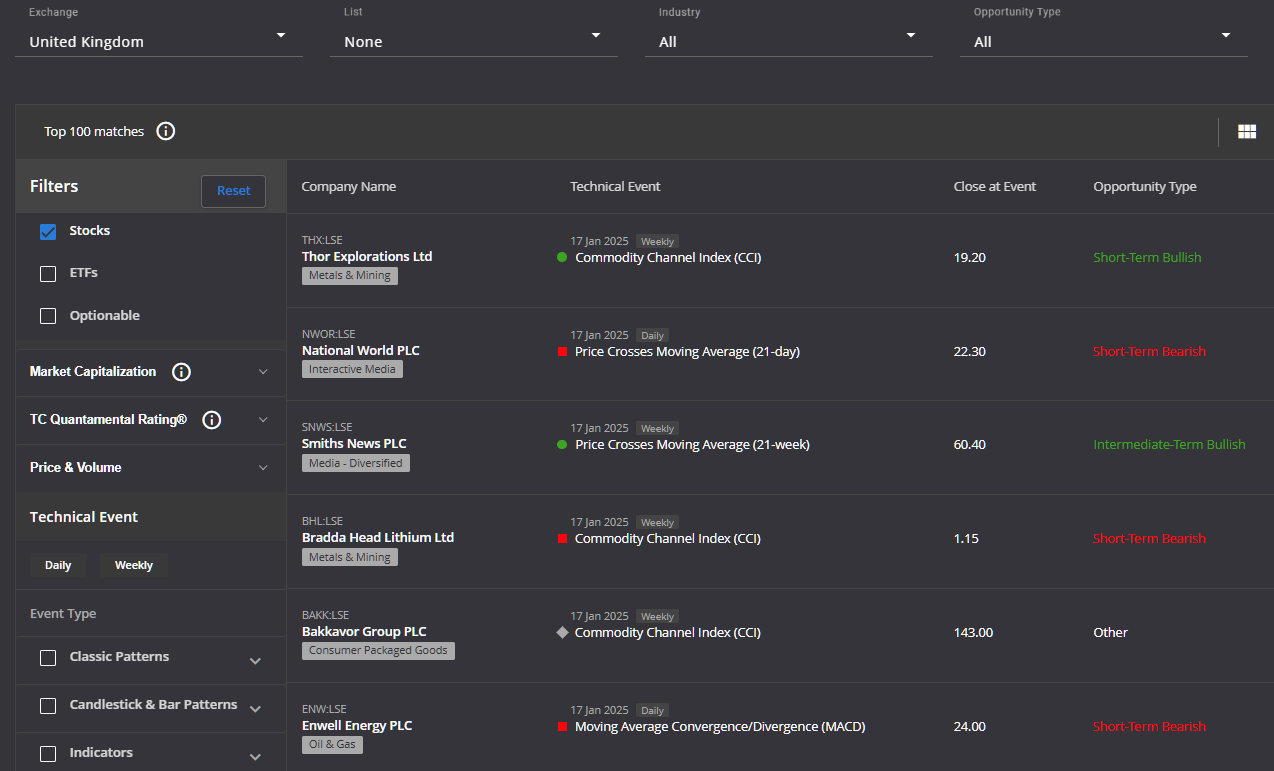
You can opt to scan global stocks or narrow your focus to UK stocks, with multiple filter options for Classic Patterns, Candlestick Patterns, Indicators, and more. The algorithm then identifies UK stocks that are showcasing key technical events, saving you hours of research.
By clicking on any stock, you’ll gain access to in-depth information about the technical events the stock is exhibiting, along with support and resistance levels.
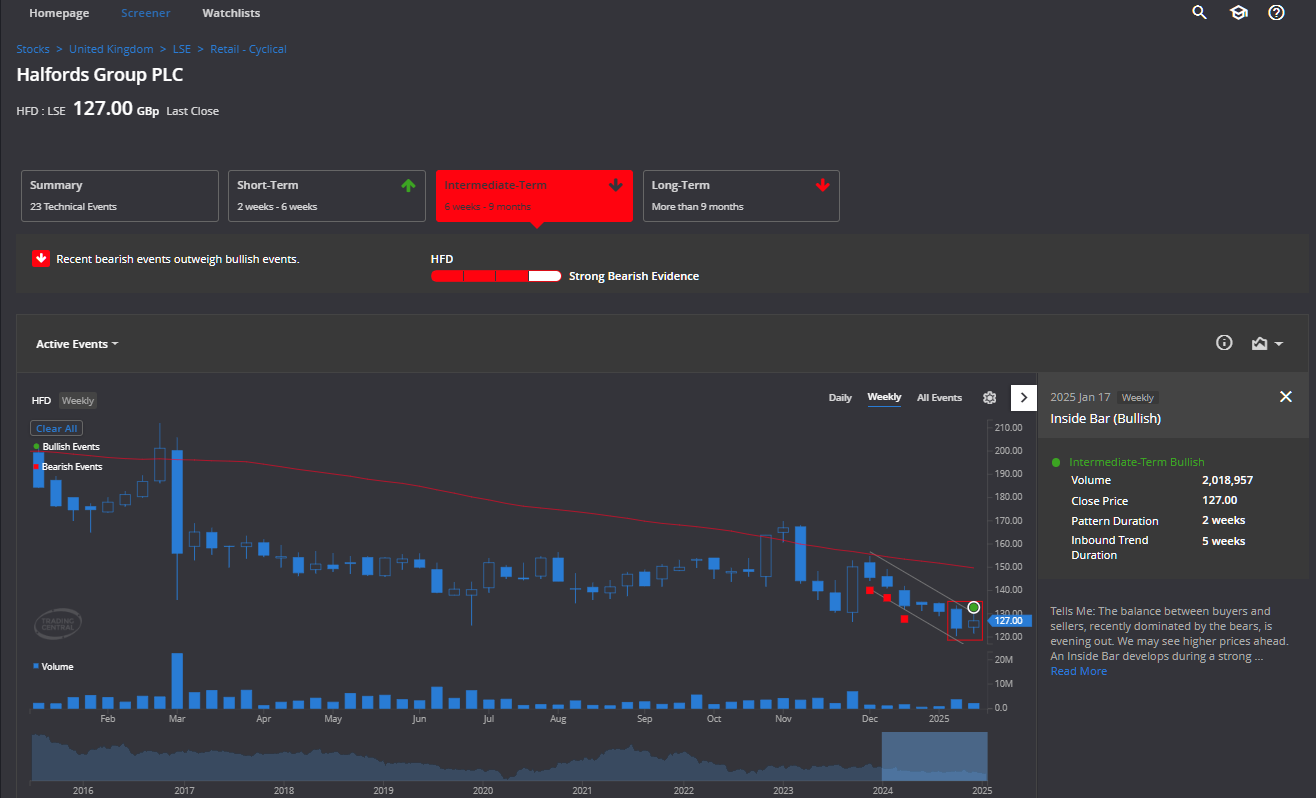
You can access this screener by creating an Admirals Dashboard account.

Identifying Morning Star and Confirmation Signals
The morning star candlestick pattern analyses shifts in market psychology and behaviour, and therefore, can be applied across various asset classes, including currencies, stock indices, shares, bonds, ETFs (exchange-traded funds), and more.
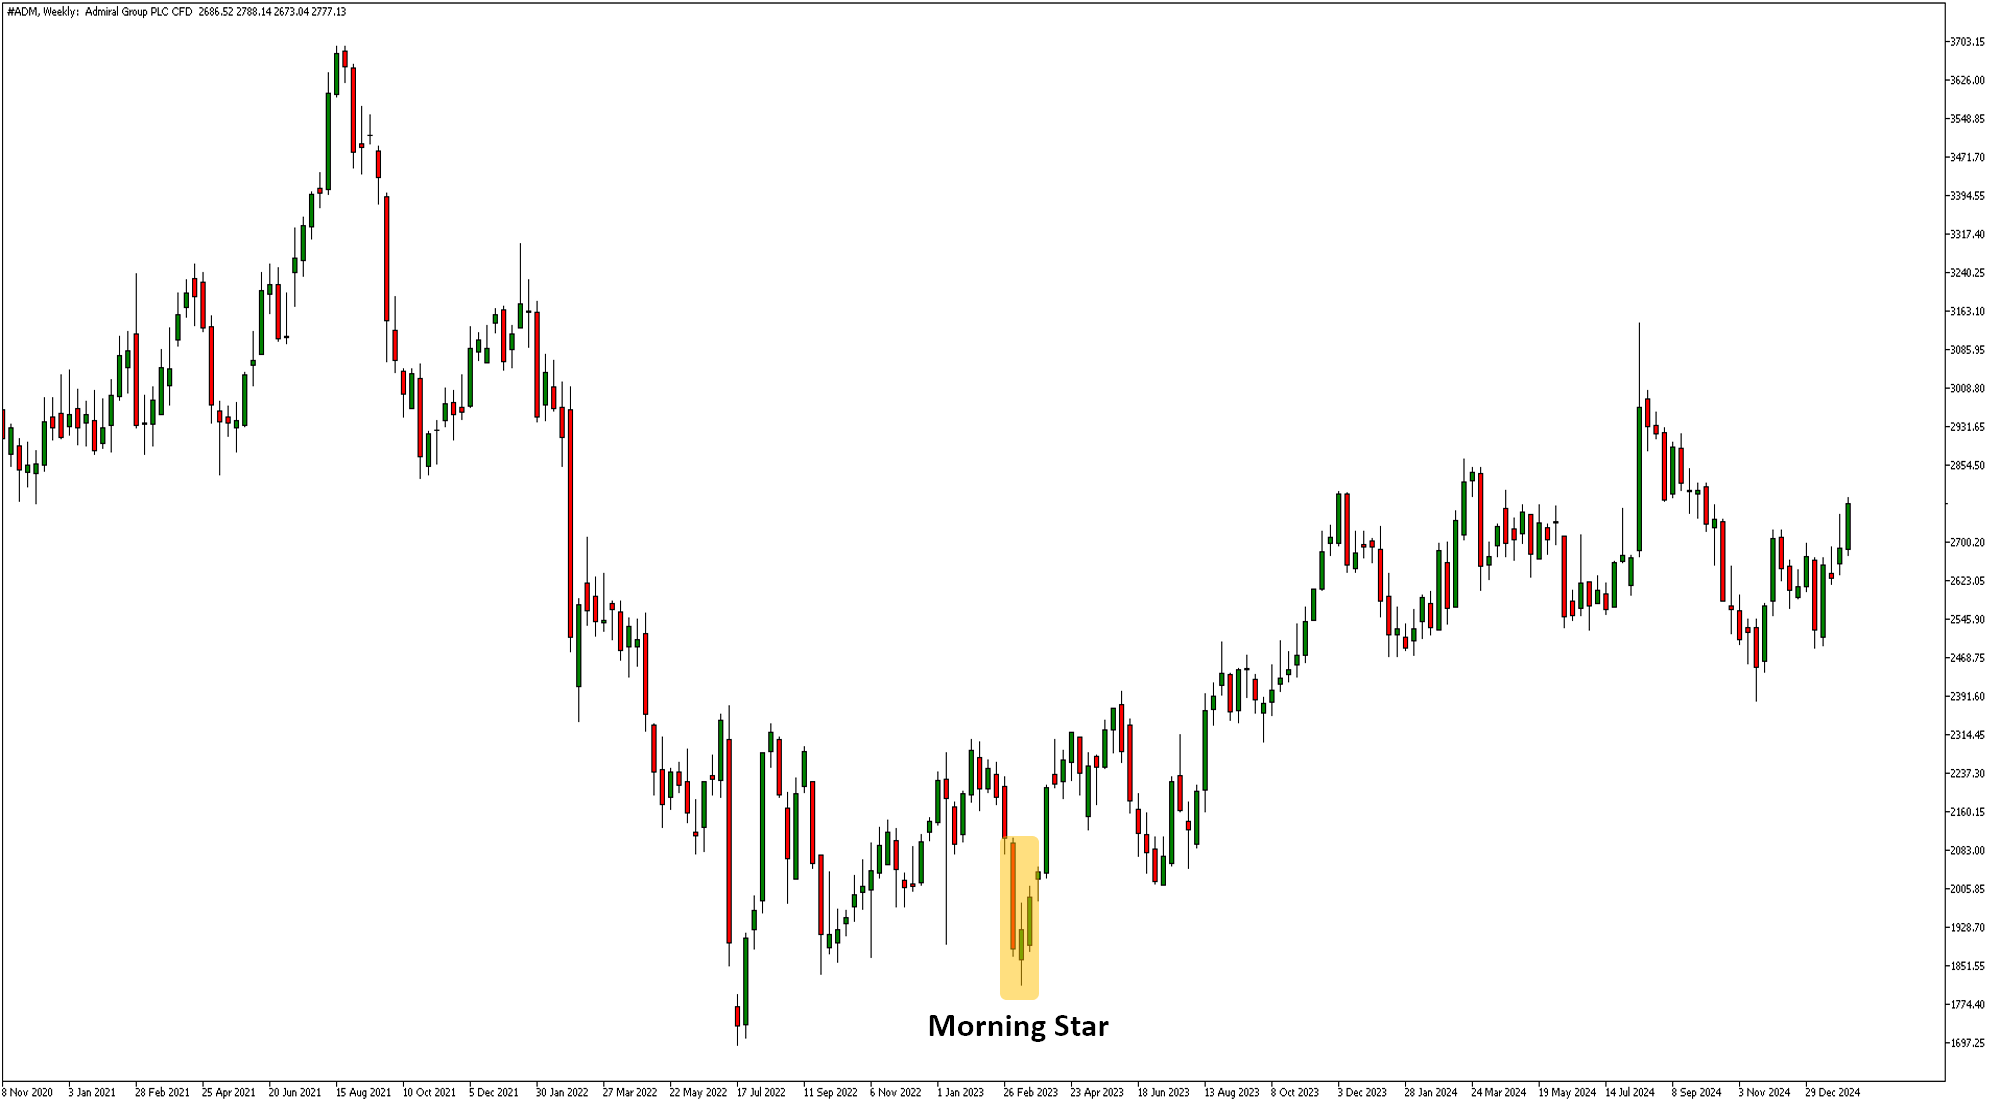
For instance, the chart below shows a weekly candlestick price chart of the UK insurance company, Admiral Group PLC.

In the chart above, one example of a morning start pattern has been highlighted in the yellow box. The 5 March 2023 weekly candle was significantly bearish. The next weekly candle was much smaller, with the body of the bar in the middle and equal upper wick and lower wick, highlighting a pause in the preceding selloff. The next, third weekly candle was bullish. In this example, the morning star pattern started a long-term uptrend but that will not always be the case and many times the pattern will fail.
The key is context. There are several other interesting factors to note. The third candle closed above the high of the upper wick from the second candle. This shows that buyers are willing to close above price levels they couldn't break through before, signifying a greater shift from bearish to bullish momentum.
In the example above, the share price has also approached a horizontal support level where the market had turned before several times in 2022. In essence, all these clues converging around the same area builds a higher probability picture of what is happening in the market. Traders may also opt to add on other types of indicators.
- RSI. The Relative Strength Index is a technical indicator that measures the strength and speed of a market's price movement. When using it with a morning start pattern, traders may want to see the RSI is oversold.
- MACD. The Moving Average Convergence Divergence indicator measures the momentum of a market. When using it with a morning star candlestick pattern, traders may want the MACD to be above the zero line, with the MACD line above the Signal line suggesting bullish momentum.
Even then, no matter how many technical clues converge together, nothing can predict the future with 100% certainty. This is why risk management is very important in navigating the winning and losing times. By keeping the risk low this can help to navigate a string of losing trades.
Trading Concepts and Strategies
There are a variety of different trading methodologies and strategies available. Let's go through two popular styles of trading: swing trading and day trading using a morning star candlestick pattern.
Swing Trading
Swing trading is known as medium-term style of trading. It involves trading the swings, or turning points, of a market on medium to higher timeframes such as the weekly, daily and 4-hour chart. Swing traders may hold positions from several days to several weeks.
There are two ways swing traders can use a morning star pattern.
- Enter a long position for a bullish reversal after a preceding downtrend
- Exit a short position before the potential of a bullish reversal and change in trend
Using the example above of the weekly share price of Admiral Group, there are several ways that traders could have used the formation of the morning start pattern highlighted.
Firstly, if they were already short the market, they could see it as a sign that the move lower may not continue and decide to exit their short trade. Alternatively, traders may have opted to trade the potential move higher for a potential bullish reversal.
Which method the trader uses, or if they opt to trade both situations, depends on the individual trader's style. The most important factor will be risk management and in particular the position size and stop loss. If the position size is too high, then several losing trades could wipe out your capital.
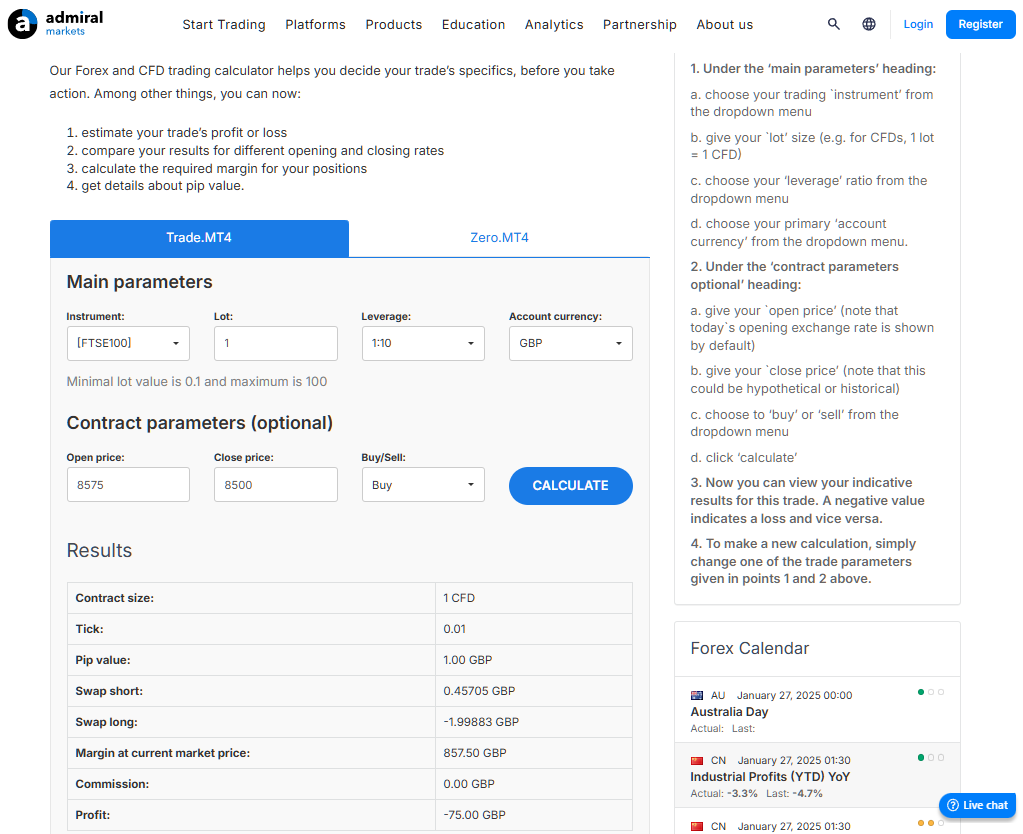
You can use the Admirals Trading Calculator to determine your position size and how much you could potentially gain or lose on a trade, helping to exercise proper risk management.
Day Trading
Day trading is a much more shorter-term style of trading. Common timeframes for this style are typically the 1-hour, 30-minute, 15-minute and 5-minute charts. The style of trading involves identifying short-term opportunities that develop within a trading day. Very rarely would day traders hold a trade for longer than a day.
This is a very difficult style of trading and is very aggressive. It's not suitable for beginner traders and even experienced traders will struggle with it. There will be many more morning star candle setups but also many more that will fail as day traders need to contend with the random nature of price that develops throughout the day.
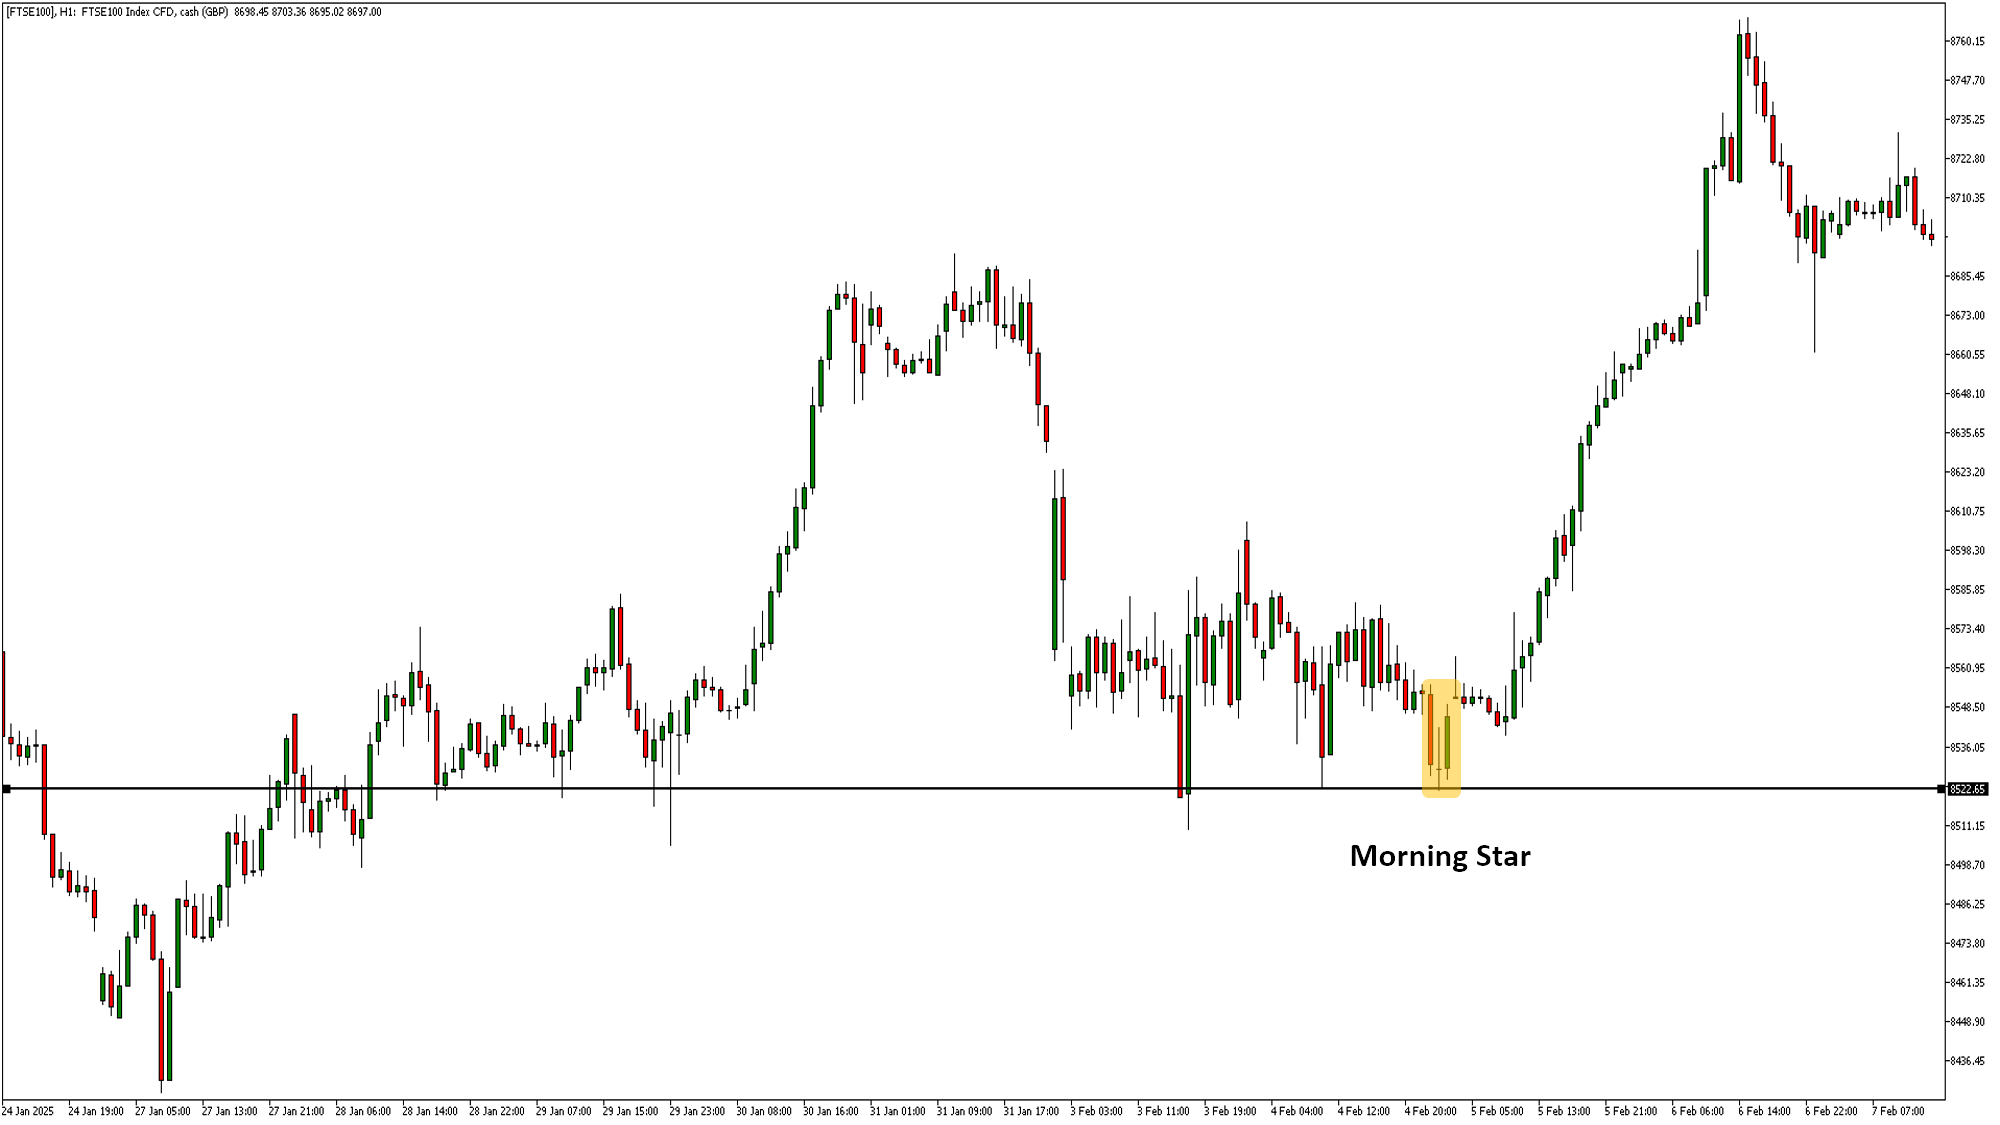
The chart above shows the hourly candles of the FTSE 100 stock market index during 24 January 2025 and 7 February 2025. The FTSE 100 is an index of the largest 100 shares listed on the London Stock Exchange by market cap. On the 5 February 2025, a morning star candlestick pattern developed at a horizontal support line (denoted by the yellow box and the black horizontal line).
While some day traders may have been around during this three-hour candle formation, risk management will determine the overall result. Many traders may have been shaken out on the pullback that developed after the morning star formation, only for the market to continue a bullish reversal move higher.
In some cases, the market may go back down to the horizontal support line and decided to break through it, causing a loss before the trader has a chance to amend their position or scale out. By using the Admirals Trading Calculator you can determine your potential profit and loss, thereby always exercising proper risk management.
Conclusion
The morning star pattern consists of three candles that indicate a shift from selling to buying sentiment. When combined with other technical analysis tools and effective risk management, it can be a powerful signal. However, risk management is the most important factor in navigating the wins and losses that occur.
The Admirals Premium Analytics Candlestick Screener and Trading Calculator are valuable resources to enhance your trading performance. Open a trading account today to experience these features and hone your skills with a free demo account until you're ready to trade live.

INFORMATION ABOUT ANALYTICAL MATERIALS:
The given data provides additional information regarding all analysis, estimates, prognosis, forecasts, market reviews, weekly outlooks or other similar assessments or information (hereinafter “Analysis”) published on the websites of Admirals' investment firms operating under the Admirals trademark (hereinafter “Admirals”). Before making any investment decisions, please pay close attention to the following:
1. This is a marketing communication. The content is published for informative purposes only and is in no way to be construed as investment advice or recommendation. It has not been prepared in accordance with legal requirements designed to promote the independence of investment research, and that it is not subject to any prohibition on dealing ahead of the dissemination of investment research.
2. Any investment decision is made by each client alone whereas Admirals shall not be responsible for any loss or damage arising from any such decision, whether or not based on the content.
3. With view to protecting the interests of our clients and the objectivity of the Analysis, Admirals has established relevant internal procedures for prevention and management of conflicts of interest.
4. The Analysis is prepared by an analyst (hereinafter “Author”). The Author, Jitanchandra Solanki, is an employee of Admirals. This content is a marketing communication and does not constitute independent financial research.
5. Whilst every reasonable effort is taken to ensure that all sources of the content are reliable and that all information is presented, as much as possible, in an understandable, timely, precise and complete manner, Admirals does not guarantee the accuracy or completeness of any information contained within the Analysis.
6. Any kind of past or modeled performance of financial instruments indicated within the content should not be construed as an express or implied promise, guarantee or implication by Admirals for any future performance. The value of the financial instrument may both increase and decrease, and the preservation of the asset value is not guaranteed.
7. Leveraged products (including contracts for difference) are speculative in nature and may result in losses or profit. Before you start trading, please ensure that you fully understand the risks involved.