The Evening Star Pattern: A Potential Warning Sign for UK Investors?
This guide on the evening star candlestick pattern draws upon insights from our top market analysts and seasoned traders in the UK, ensuring valuable insights for investors at all skill levels.
While there is a wide range of candlestick patterns to use, the evening star provides some unique market insights. It is a bearish reversal signal found in candlestick charting, often indicating a potential downturn in an asset's price. By understanding its formation and implications, traders can make more informed decisions about entering, exiting, or adjusting their positions.
This material is for informational purposes only and not financial advice. Consult a financial advisor before making investment decisions.

Table of Contents
Key Takeaways
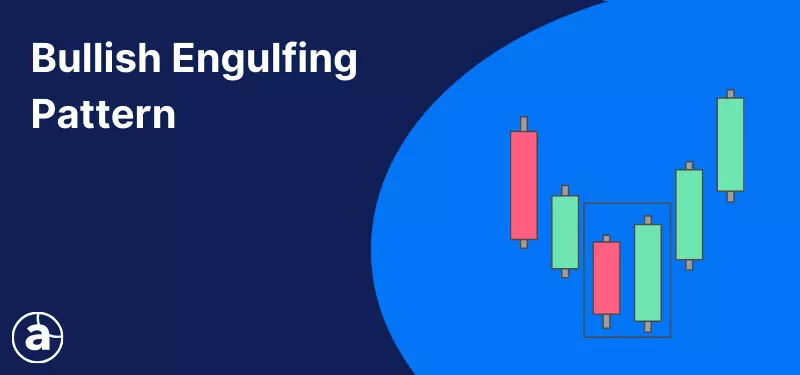
- The evening star candlestick pattern consists of three candles and is a bearish signal.
- It features a bullish first candle, a small or indecisive second candle and a third bearish candle.
- The evening star pattern signifies a transition from bullish to bearish momentum and typically appears at the end of an uptrend, highlighting a significant shift in sentiment.
- The Admirals Premium Analytics Screener can automatically detect a wide variety of chart and candlestick patterns on over 8,000 global instruments.
Deconstructing the Evening Star: Formation and Characteristics
The evening star candlestick pattern consists of three candles. The combination of these candles represents the potential of a significant downturn in the market.
- Candle 1: Bullish
- Candle 2: Indecision
- Candle 3: Bearish

The first candle should be a bullish candle representing a continuation of the preceding uptrend. The second should be a small, indecisive candle formation. This could be a doji or spinning top candlestick. The third candle should be a large red candle in which the opening price gaps down from the previous day's close. It should also close significantly within the first bullish candle's body.
The combination of these three candles represents a shift from buying to selling sentiment. When seen after a significant uptrend it can be a warning sign of the end of that trend and lower prices in the future.
Candlestick patterns like these can provide more understanding into current market behaviour and also provide potential trading opportunities. There are 42 recognised candlestick patterns which all represent a type of market psychology such as a trend continuation, a reversal, indecision and more.
Ideally, traders want to see candlestick patterns form alongside other technical clues in the market such as levels of support and resistance. This is because no one tool or pattern will work 100% of the time. Rather, look for the convergence of multiple clues to build a higher probability understanding of market behaviour.
Spotting the Evening Star: Identifying the Pattern in Action
As the evening star candlestick pattern merely analyses a change in market psychology and behaviour, it can be used across global asset classes including currencies, stock indices, shares, bonds, ETFs (exchange-traded funds) and more.
For example, below is a weekly chart of the FTSE 100 CFD (contracts for difference) stock market index which represents the value of the largest 100 shares listed on the London Stock Exchange.
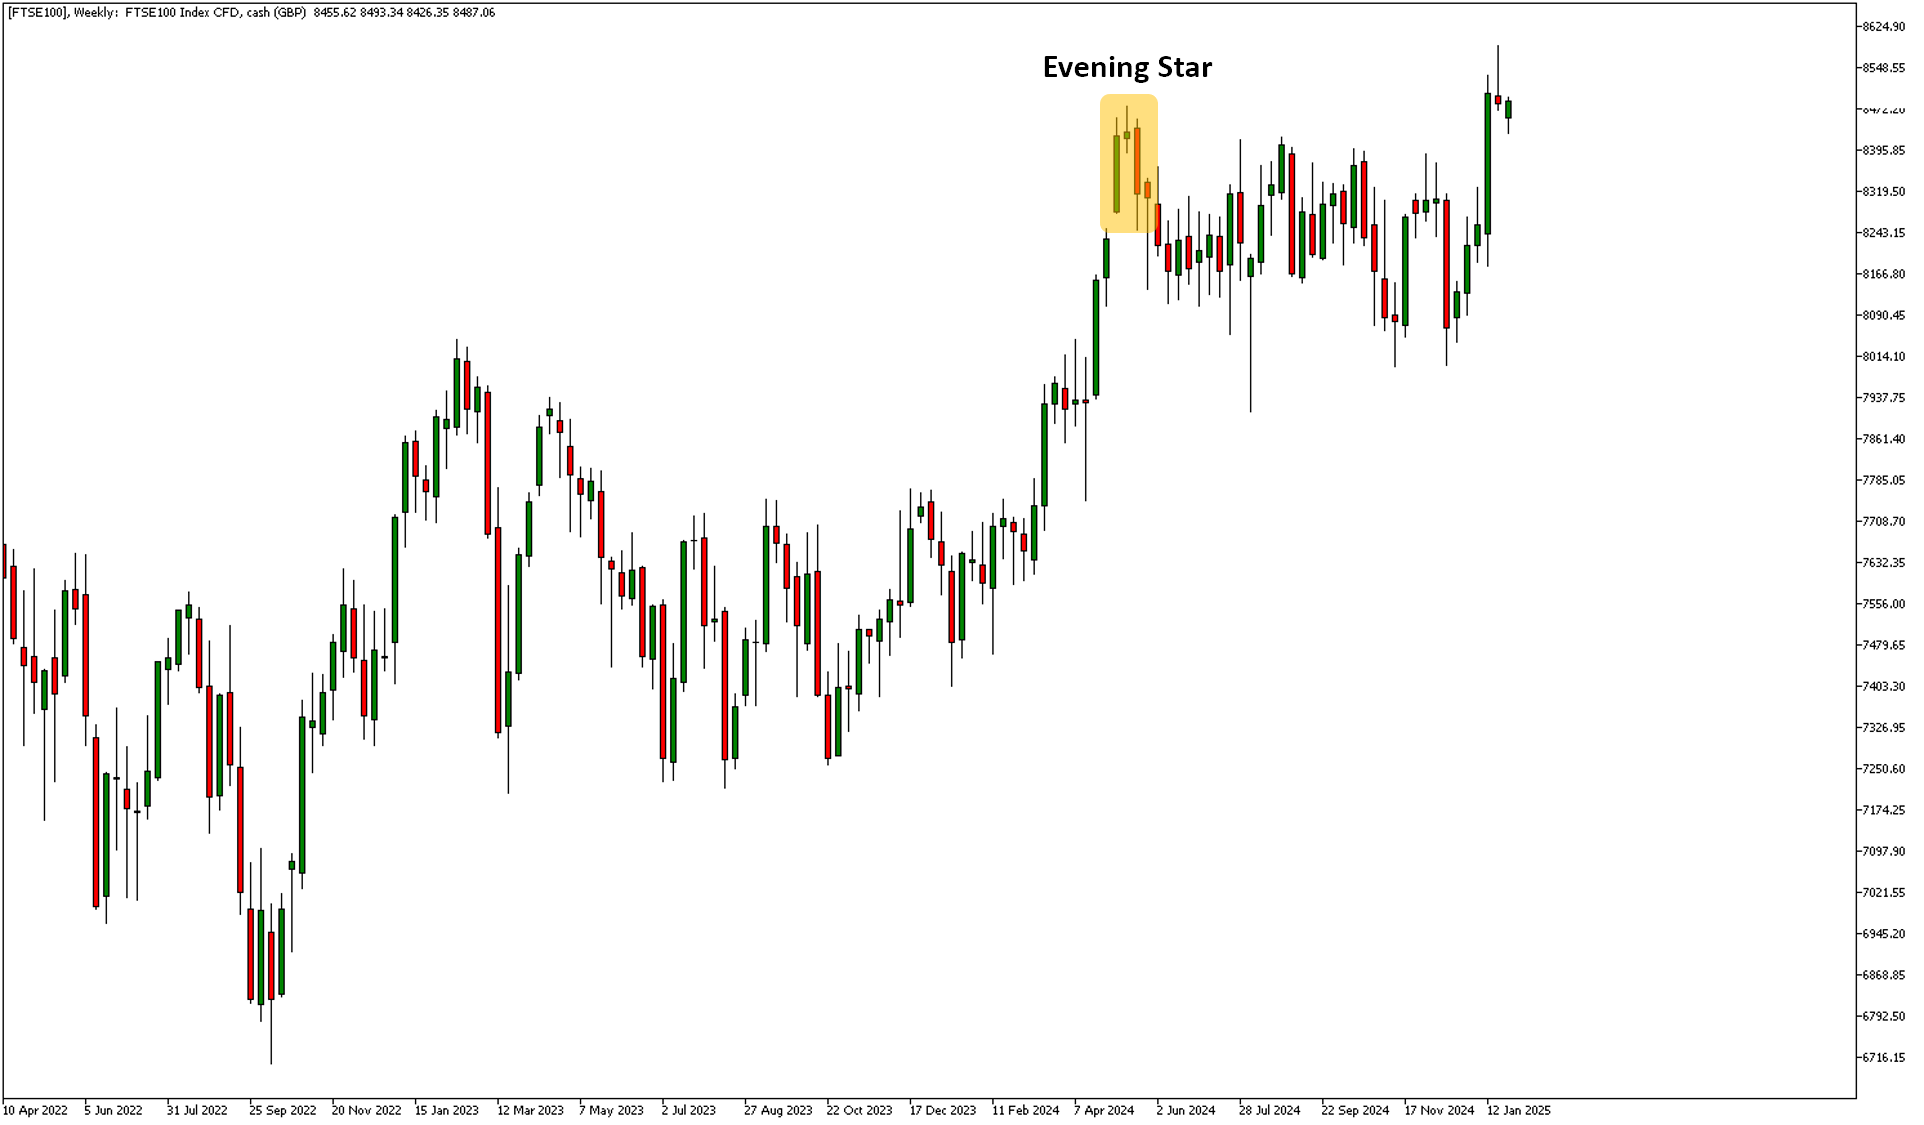
The three weekly candles in 2024 covering the 5 May, 12 May and 19 May combined to form an evening star pattern. The first candle was significantly bullish signifying a continuation of the preceding uptrend which started from March. The second candle was a spinning top formation - significantly smaller in size with a very small body around the middle of the candle. The third candle was significantly bearish and closed well into the body of the first candle.
This highlighted the bullish move on the first week lacked momentum on the second week which gave a warning sign for traders to exit some of their positions, causing a significant sell-off by the third week. Prices continued lower for the next few months until the beginning of August.
There are some important considerations to note. The third weekly candle didn't gap down. However, gaps are more common on individual shares as they have limited trading hours. Stock indices have longer trading hours so tend to have fewer gaps in the market (although they will still appear, in particular on the opening of a weekly candle). Currency pairs trade 24 hours a day, so any gaps between the closing and opening of a new day tend to be small. Therefore, adapting the pattern to the individual market you trade is essential.
In the chart above, you may see many other examples of evening star patterns. The key is to identify the three-candle sequence after a significant uptrend to show a change in market sentiment. While the evening star will also develop in a range-based market, it may have less impact on the market. Context is key.
Applying the Knowledge: Trading Strategies Using the Evening Star
There are a variety of ways traders can incorporate the evening star candlestick pattern into a trading strategy. Let's take a look at its use in some of the most common styles of trading: day trading and swing trading.
Day Trading the Evening Star
Day trading is a short-term style that is mainly done on intraday timeframes such as the 1-hour, 30-minute and 15-minute charts. It involves trying to profit from short-term swings during the day and closing all positions by the end of the day. It's one of the most difficult styles of trading to master and it involves a high level of emotional mastery.
Day traders can use the evening star pattern in two ways:
- Exit a long position
- Enter a short position
Most day traders tend to stick to trading with the trend. It is very aggressive to try and day trade against the trend and is not a strategy for beginners. This is because a trend can last for a significant amount of time. If a trader keeps on trying to short an uptrend, it can lead to many, many losses.
It's also important to note that the lower timeframes will have more false signals as the market conditions can change very quickly. Therefore, day traders may opt to use the evening star pattern to help identify when to exit a long position or use it as a warning sign to start scaling out of a trade or moving stop losses to protective levels.
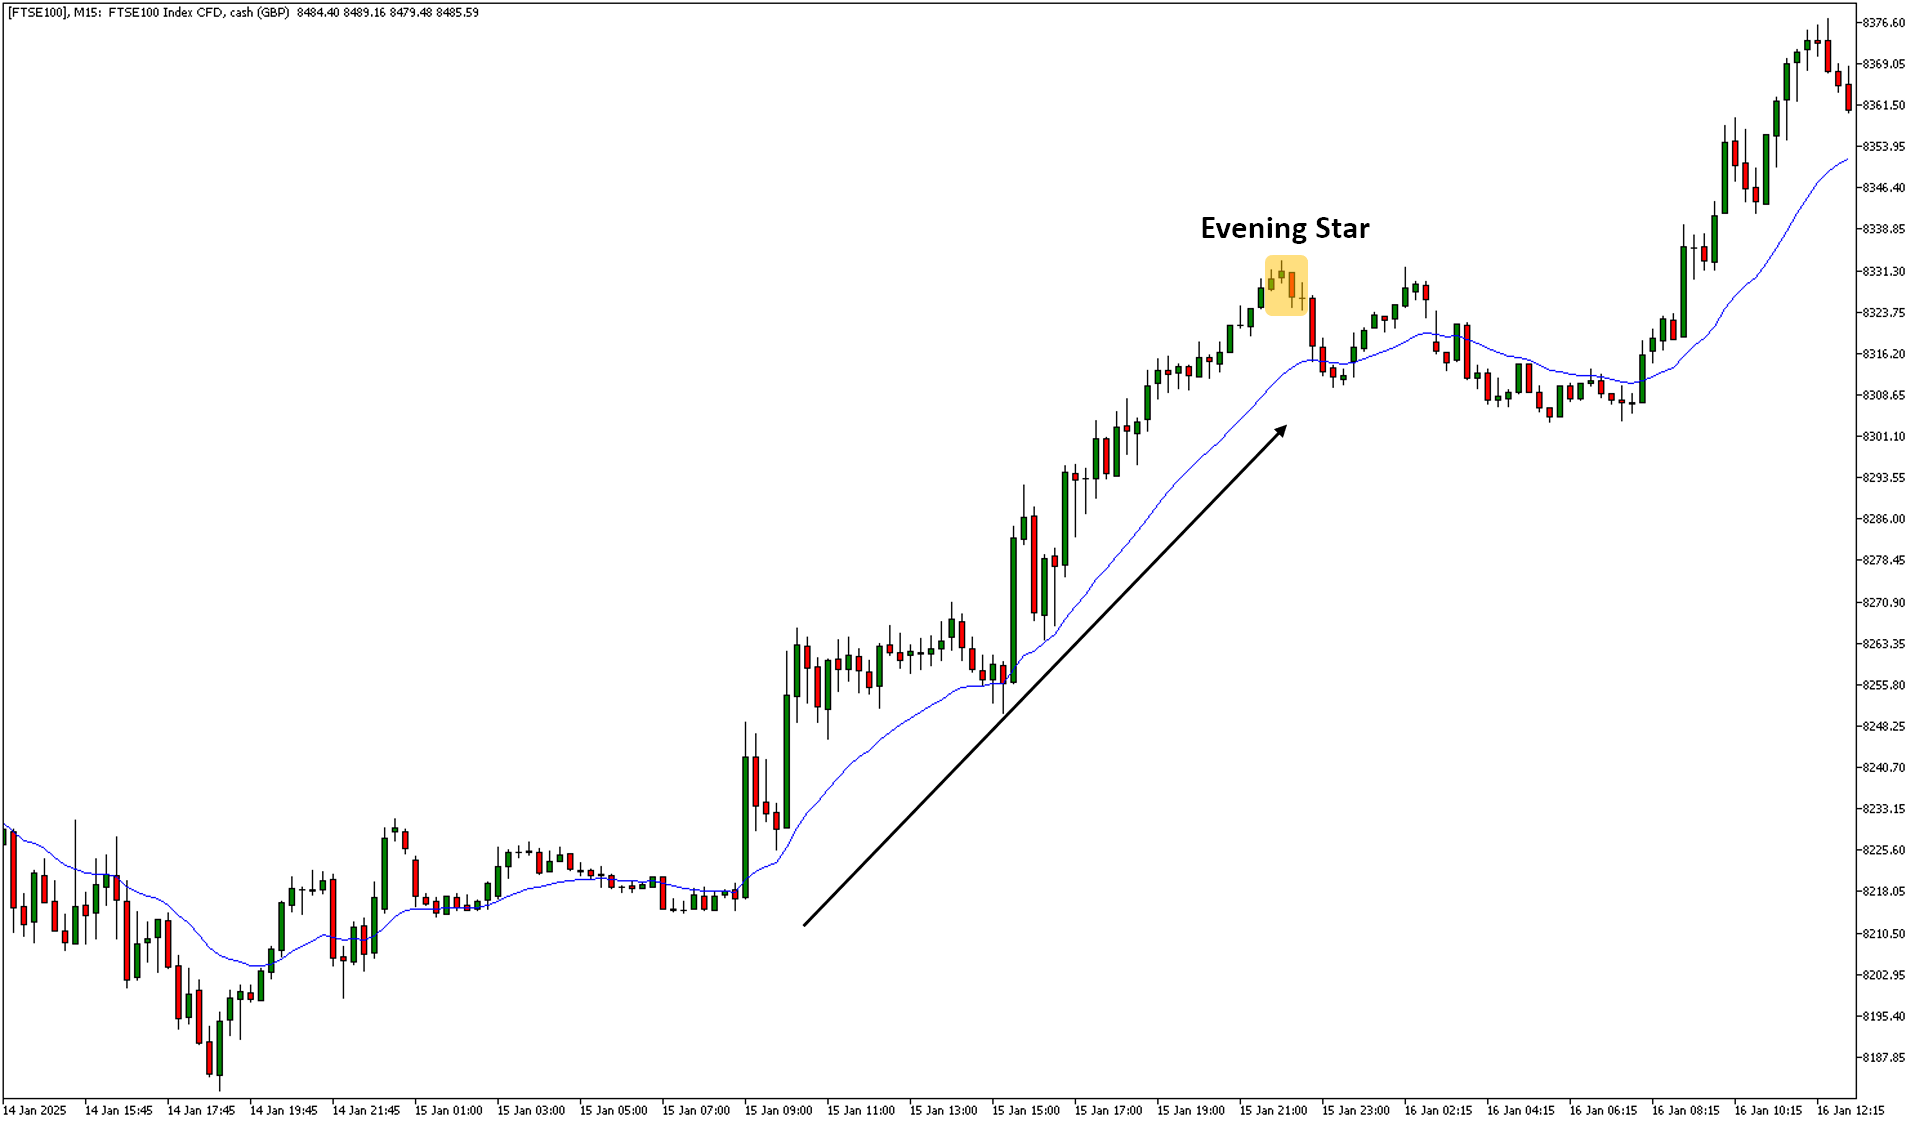
In the 15-minute chart of the FTSE 100 CFD shown above, there is a sustained uptrend throughout the black up arrow. The chart also has a 20-exponential moving average (EMA - blue line). This indicator gives a smooth line of price direction and can confirm a trending market.
The 20 EMA was moving higher and the price stayed above it signifying an uptrend. During this period of time, day traders may have used trend strategies to trade this move and build long positions.
The formation of the evening star further into the uptrend was a warning sign that the trend's momentum may be coming to an end. Day traders may have used this warning as a sign to either:
- Exit their trade entirely.
- Scale out of the trade by booking a small profit and leaving the rest of their stake to try and run higher.
- Decide to move their stop loss to a protective level and trail it to try and capitalise on further upside but lock in profits on a pullback.
- A combination of two and three above.
It's important to note that a day trader could have been stopped out of the trade at a loss well before the evening star pattern formed due to market volatility and the fact the trend may not have continued.
Most day traders will also use other technical analysis indicators to make their decisions. For example, identifying support and resistance levels on the chart can help to enter and exit markets, alongside price action confirmations from candlestick analysis.
Swing Trading the Evening Star
Swing trading is a medium-term style of trading. Swing traders try and trade the swings of the market, usually on medium to higher timeframes such as the 4-hour, daily and weekly charts. The holding time of trades could be several days to weeks.
Swing traders can use the evening star pattern in two ways:
- Exit a long position
- Enter a short position
Using the evening star pattern to exit a long position can be done in the same way as day trading, as already discussed above. For swing trading, it can also be used to enter a short position as the higher timeframes offer more information regarding market behaviour.
Below is the weekly price chart of the Gold vs US Dollar CFD.
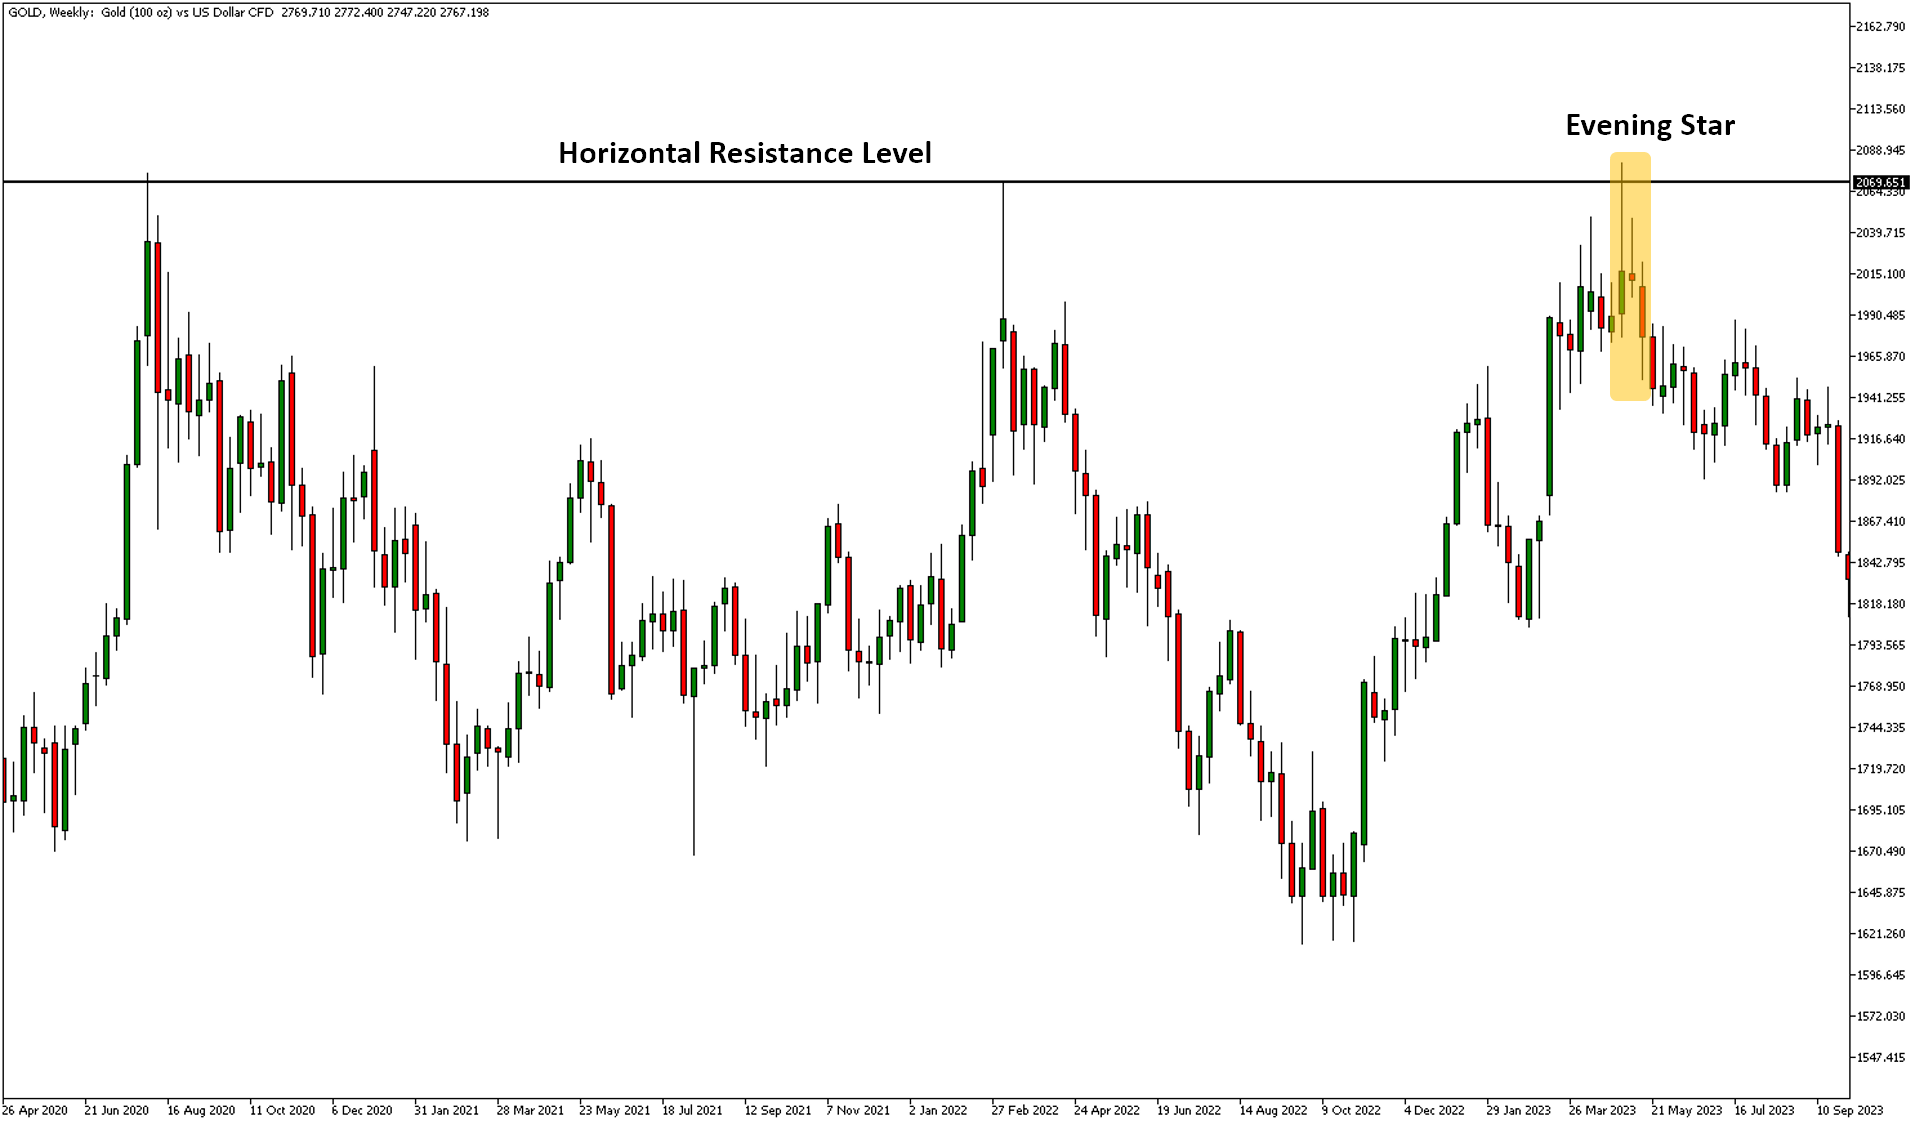
In May 2023, the price of gold approached a historic level of horizontal resistance as denoted by the black horizontal line. This is an area of supply where historically sellers have turned up. Swing traders will use technical analysis levels like this to help identify potential swing trades - areas where the market could turn.
Candlestick patterns at these levels can help to increase the understanding of current market behaviour. In the chart above, an evening star pattern formed at this price level signifying a potential shift from buying to selling sentiment.
The first candle was large and bullish. The second candle is smaller with indecision. The third candle was bearish, closed well into the body of the first candle and also gapped down on the open.
Swing traders may have used the combination of these clues to initiate a short position. The entry could have been on the break of the low of the third candle with a stop loss at the high. The most important element here is risk management to navigate the wins and losses.
The Premium Analytics Candlestick Screener
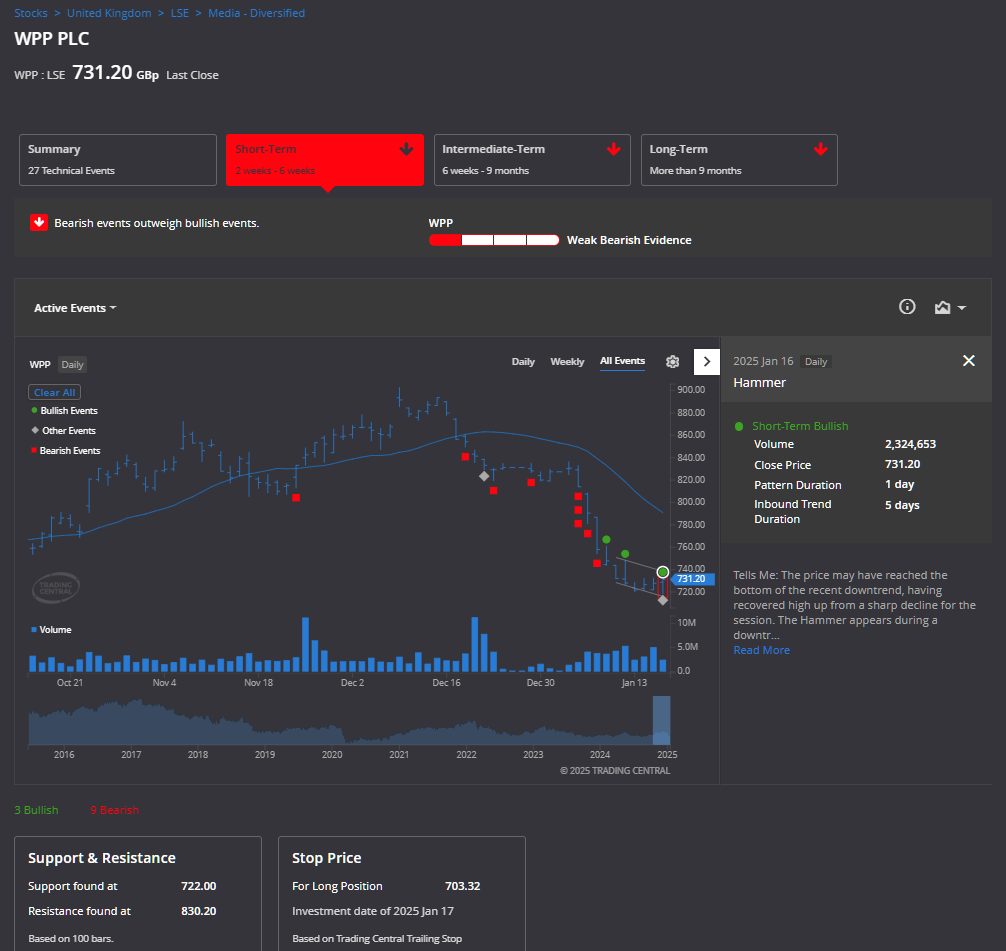
A valuable tool to enhance your trading strategies is the Admirals Premium Analytics candlestick screener. It scans thousands of global markets to help you stay updated on emerging technical events.
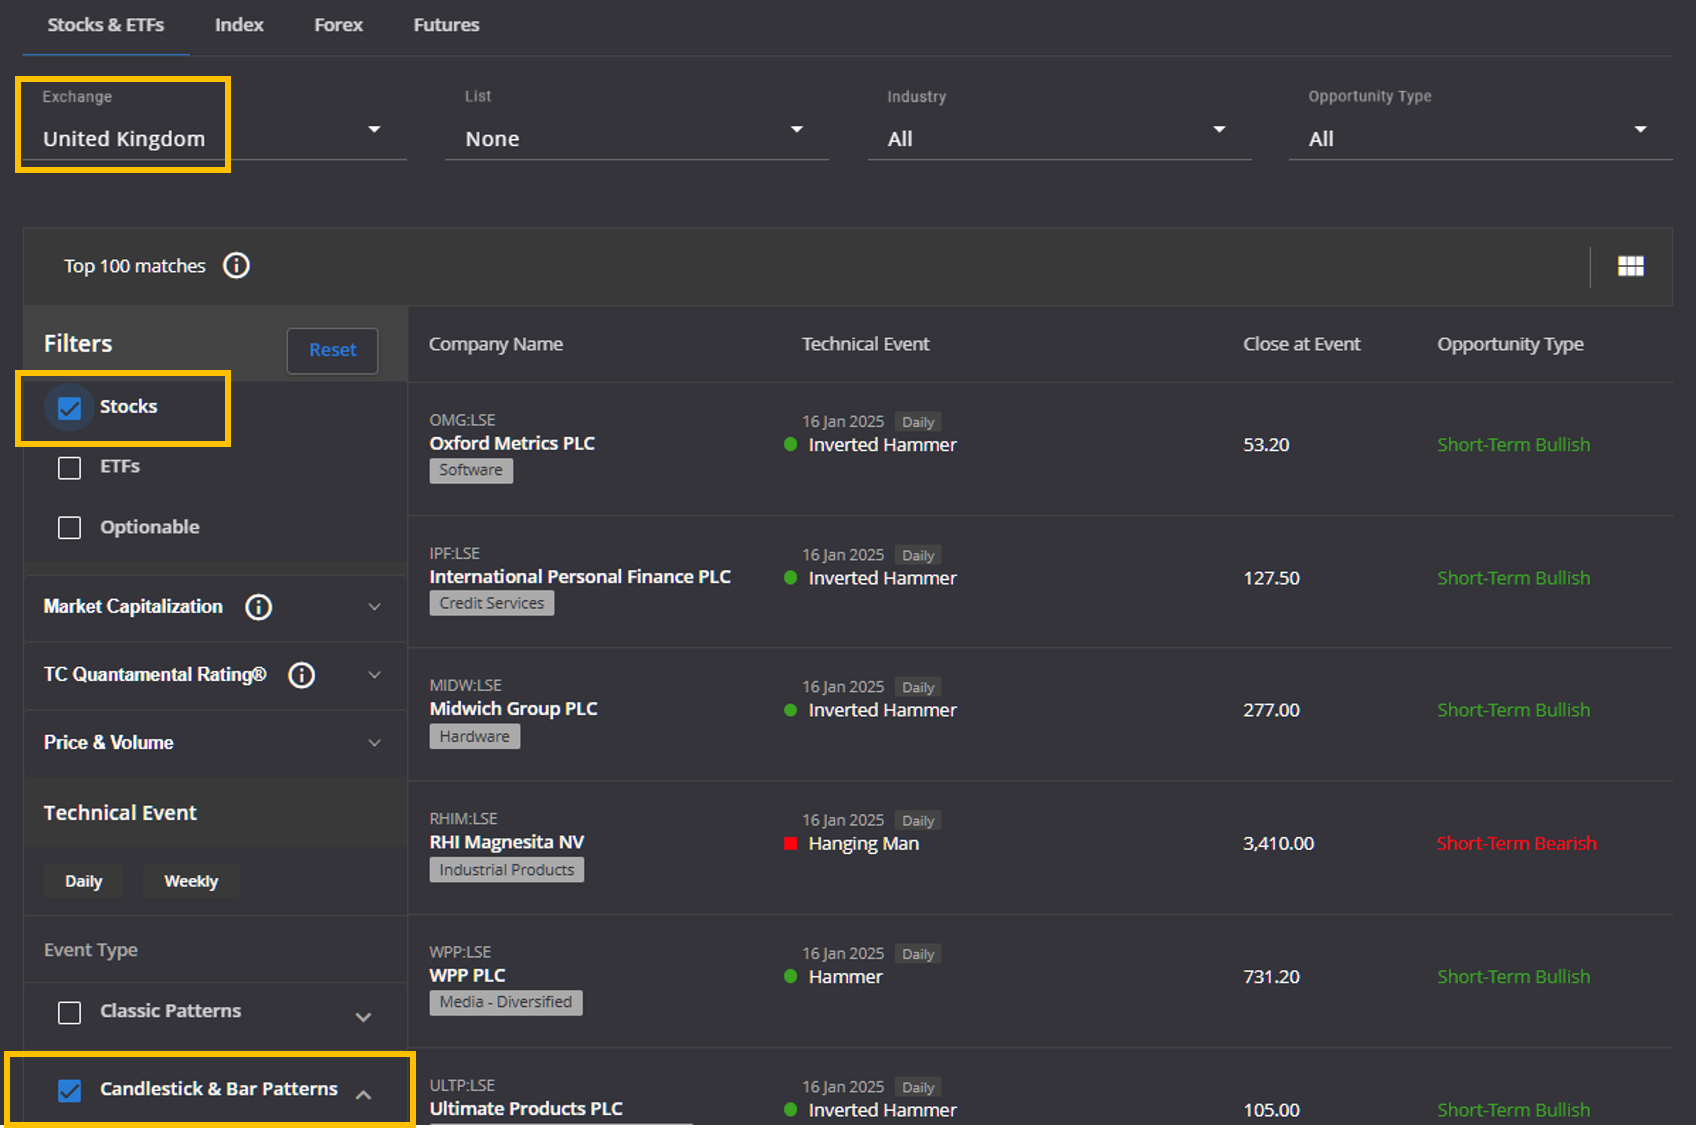
You can choose to scan global stocks or focus solely on UK stocks, with various options to filter for Classic Patterns, Candlestick Patterns, Indicators, and more. The advanced algorithm will then identify UK stocks displaying key technical events, saving you hours of research time.
By clicking on any stock, you can then access detailed information about the technical events it’s showing, as well as support and resistance levels.
You can access this screener by creating an Admirals Dashboard account.

Mastering the Mind Game: Risk Management and Trading Psychology
While candlestick patterns offer unique insights into the market, they will not work 100% of the time. This is why traders will also use candlesticks with other technical analysis tools such as indicators and support and resistance levels. Even then, there are no guarantees on the outcome.
This is why no matter how many tools or patterns a trader uses, the most important element of trading is risk management. In particular, the importance of using a stop loss and correct position sizes should not be underestimated.
Stop Losses
A stop loss is an instruction sent to the broker to automatically exit a trade when the price exceeds a certain price level defined by the trader. If a trade starts to move in the opposite direction, a stop loss order can be used to minimise the loss. It's very important to use as not every trade will work out and move in the direction you think.
When trading markets that are not open 24 hours a day, such as stocks and shares, there is also a gap risk to take into consideration. If the market price opens or gaps beyond your stop loss then you may get exited at the next available price the market trades at. This means you could lose more than you intended on a trade which is why position sizing is important.
Position Sizing - Importance of the Admirals Trading Calculator l M
Your position size is the amount you risk per trade. It's important to keep risk as low as possible. For example, a trader may decide to risk 1% of their total capital on a trade. This means with a £10,000 trading account, the total amount they are willing to lose on one single trade is £100 (£10,000 * 1%).
If a trader decides to risk 50% on a trade, then after two losing trades they have wiped out all of their capital - which is why keeping the risk low is hugely important. The Admirals Trading Calculator is an excellent tool to aid in your risk management.
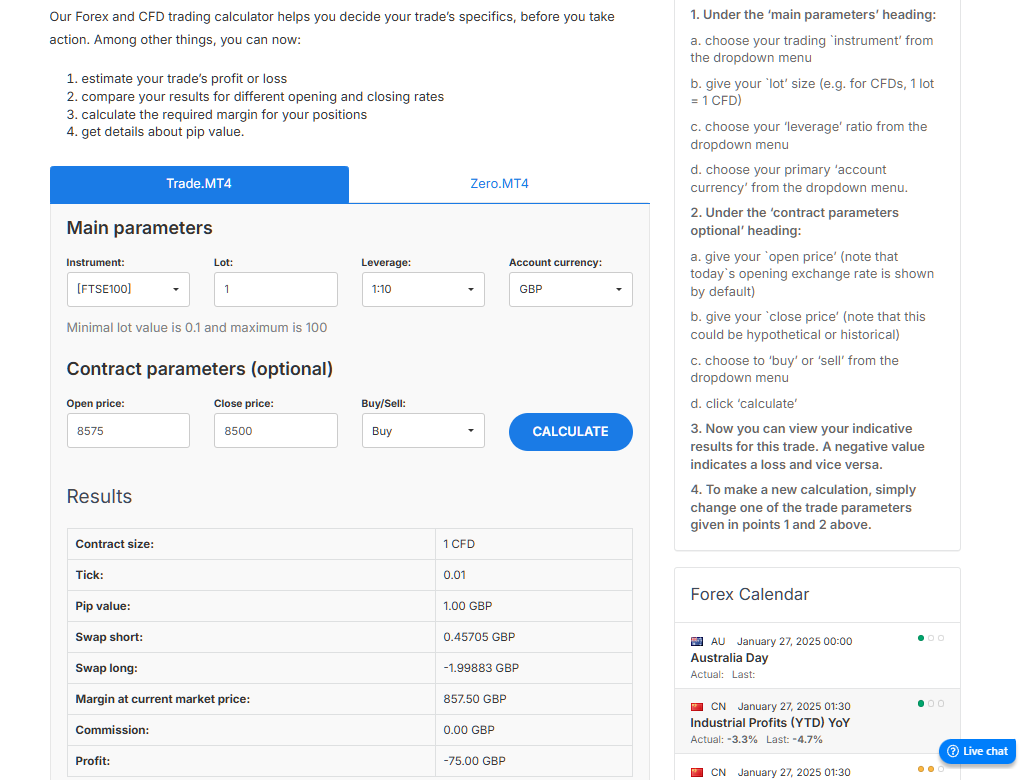
The trading calculator allows you to risk manage effectively on global asset classes including currencies, stocks, indices and commodities. By inputting your price levels, it will tell you how much you could win or lose on a trade. Traders can then amend their 'lot' value to find the right monetary risk per trade for their individual requirements.
Knowing how much you could lose on a trade from the outset is important to grasp the mental game of trading. Most amateur traders focus on the emotions of fear and greed when trading. It's important to have a plan with proper risk management to shift the focus from emotions into statistical probabilities to navigate uncertain outcomes.
Backtesting
One of the advantages of candlestick patterns is that they are recognisable on a chart. This means a trader can look back historically and backtest the outcomes of their trading parameters. This can give a trader more insight into the historical winning and losing streaks for their chosen strategy which can help with the mental aspect of trading.
Backtesting is also useful to know when to stop trading a certain strategy. If your current strategy is yielding strings of losing trades that you have not seen before, it could be a sign that your strategy no longer works. Managing the inevitable losing periods is essential to controlling portfolio drawdowns.
Conclusion
The evening star pattern involves three candles that signify a shift from buying to selling sentiment. It can be a powerful tool when used in conjunction with other forms of technical analysis and risk management.
The Admirals Premium Analytics Candlestick Screener and Trading Calculator are useful tools to aid in your trading performance. Open a trading account today to explore these features firsthand and practice your skills in a free demo account until you're ready to trade live.

INFORMATION ABOUT ANALYTICAL MATERIALS:
The given data provides additional information regarding all analysis, estimates, prognosis, forecasts, market reviews, weekly outlooks or other similar assessments or information (hereinafter “Analysis”) published on the websites of Admirals' investment firms operating under the Admirals trademark (hereinafter “Admirals”). Before making any investment decisions, please pay close attention to the following:
1. This is a marketing communication. The content is published for informative purposes only and is in no way to be construed as investment advice or recommendation. It has not been prepared in accordance with legal requirements designed to promote the independence of investment research, and that it is not subject to any prohibition on dealing ahead of the dissemination of investment research.
2. Any investment decision is made by each client alone whereas Admirals shall not be responsible for any loss or damage arising from any such decision, whether or not based on the content.
3. With view to protecting the interests of our clients and the objectivity of the Analysis, Admirals has established relevant internal procedures for prevention and management of conflicts of interest.
4. The Analysis is prepared by an analyst (hereinafter “Author”). The Author, Jitanchandra Solanki, is an employee of Admirals. This content is a marketing communication and does not constitute independent financial research.
5. Whilst every reasonable effort is taken to ensure that all sources of the content are reliable and that all information is presented, as much as possible, in an understandable, timely, precise and complete manner, Admirals does not guarantee the accuracy or completeness of any information contained within the Analysis.
6. Any kind of past or modeled performance of financial instruments indicated within the content should not be construed as an express or implied promise, guarantee or implication by Admirals for any future performance. The value of the financial instrument may both increase and decrease, and the preservation of the asset value is not guaranteed.
7. Leveraged products (including contracts for difference) are speculative in nature and may result in losses or profit. Before you start trading, please ensure that you fully understand the risks involved.