Shooting Star Candlestick Explained
The shooting star candlestick is a single candlestick pattern which appears during an uptrend and signals a potential bearish reversal in price. However, before traders seek to exploit this pattern, they should use other technical analysis tools to look for additional confirmation of a reversal.
In this article, we will examine the shooting star pattern in detail, explaining how to identify and interpret it. We will also demonstrate how traders can use other tools to find additional confirmation of a price reversal and much more!
| The information in this article is provided for educational purposes only and does not constitute financial advice. Consult a financial advisor before making investment decisions. |

Table of Contents
Understanding the Shooting Star Candlestick Pattern
Candlestick patterns provide a visual demonstration of what is happening in the market at any given time. Sometimes, certain patterns can form amongst these candlesticks which give insight into current market sentiment and provide clues as to where prices might go next. One of these patterns is known as the shooting star.
Definition
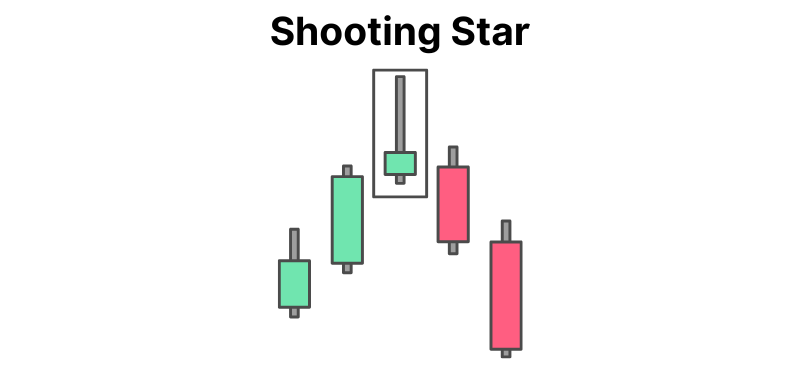
The shooting star candlestick is a single candle pattern which forms after an uptrend and signals a potential bearish reversal. It is characterised by a small candle body, a long upper wick and a small, or no, lower wick. The body of the candle can be either bullish (green) or bearish (red).
Visual Representation
Below is an example of what the shooting star candlestick looks like.
How to Interpret the Shooting Star Pattern
Every trading session represents a battle between buyers and sellers, and each candle on a candlestick chart tells a story of how that battle panned out.
A bullish candle, which is typically green, tells us that buyers dominated the session in question, resulting in price moving upwards. On the other hand, a bearish candle, which is often red, tells us that sellers were in control, causing prices to drop.
In addition to this basic information, we can sometimes gain even more knowledge from a candlestick or a pattern. So, what can we interpret from the shooting star?
Remember, the shooting star appears after an uptrend. The long upper wick tells us that the buyers, or bulls, were in control at some point during the session and successfully drove price upwards.
However, despite the upward move in price, sentiment suddenly shifts. The sellers, or bears, wrestle back control of the session and prices are forced back down. Ultimately, this results in the session closing back near to where it opened.
Whilst the candle can be bullish or bearish, in either case, the failure of the bulls to maintain control suggests that their enthusiasm is fading and that the upward trend may be losing momentum.
This interpretation is the logic as to why the shooting star candlestick is considered by many to be a signal of a potential bearish reversal.
Reliability and Limitations
Whilst the shooting star signals a potential price reversal, it does not guarantee one. Consequently, traders might want to avoid jumping into a trade based on the candlestick alone.
Instead, the reliability of the signal can be increased if traders seek additional confirmation of a reversal in price. For example, traders might choose to wait to see what happens in the session following the shooting star. If the next candle is bearish, it might help to confirm the pattern.
In addition to this, traders can look for:
- An increase in trading volume, which can denote heavy selling pressure
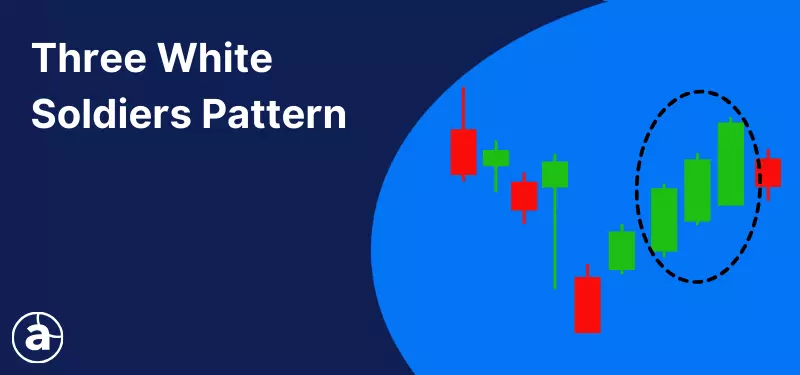
- Other bearish chart patterns
- Signs of a reversal from technical indicators
Confirmation Signals for the Shooting Star Pattern
We’ve already touched on the importance of confirming the reversal instead of opening a trade straightaway, but let’s explain this in further detail.
Volume Analysis
If the shooting star is accompanied by an increase in trading volume, this can improve the reliability of the reversal signal.
The logic here is that the higher the trading volume, the more aggressively the sellers entered the market during the session. An increase in volume, therefore, suggests that sellers have gathered and may be ready to take control of the market.
However, if trading volume is low, the signal is considered to be weaker.
Subsequent Price Action
When trading the shooting star, and various other chart patterns, many traders will wait for a confirmation candle before they enter the market. In the case of the shooting star, rather than entering the market as soon as the session has closed, traders might want to wait until the following session closes.
If the following session results in a bearish candle, this may be interpreted as confirmation of the reversal.
Technical Indicators
Instead of relying on candlesticks and trading volume, traders can also use technical indicators to look for further bearish signals.
For example, the Money Flow Index (MFI) indicator is one such indicator which can be used by traders to spot potential reversals in an asset’s price. The MFI indicator can be used to identify potential reversals in two ways:
- Identifying overbought and oversold conditions. When the market is in overbought or oversold territory, it can be a sign that a reversal is about to take place. Values higher than 80 may indicate an overbought market, whilst values lower than 20 may indicate an oversold market.
- Spotting divergence. When the MFI indicator and an asset’s price move in different directions, it can be a signal that prices are about to reverse.
In the following section, we’ll look at an example how to trade the shooting star pattern with the Money Flow Index in more detail.
Education with Admirals
Interested in mastering more candlestick patterns and other trading related topics? Explore our free educational resources today!

How to Trade the Shooting Star Pattern
We can now piece all this information together to see how to trade the shooting star candlestick pattern. Firstly, we need to identify a shooting star which follows an uptrend.
Below is a 15-minute chart of UK bank stock Barclays. At the top of an upward movement in price, a shooting star candlestick forms.
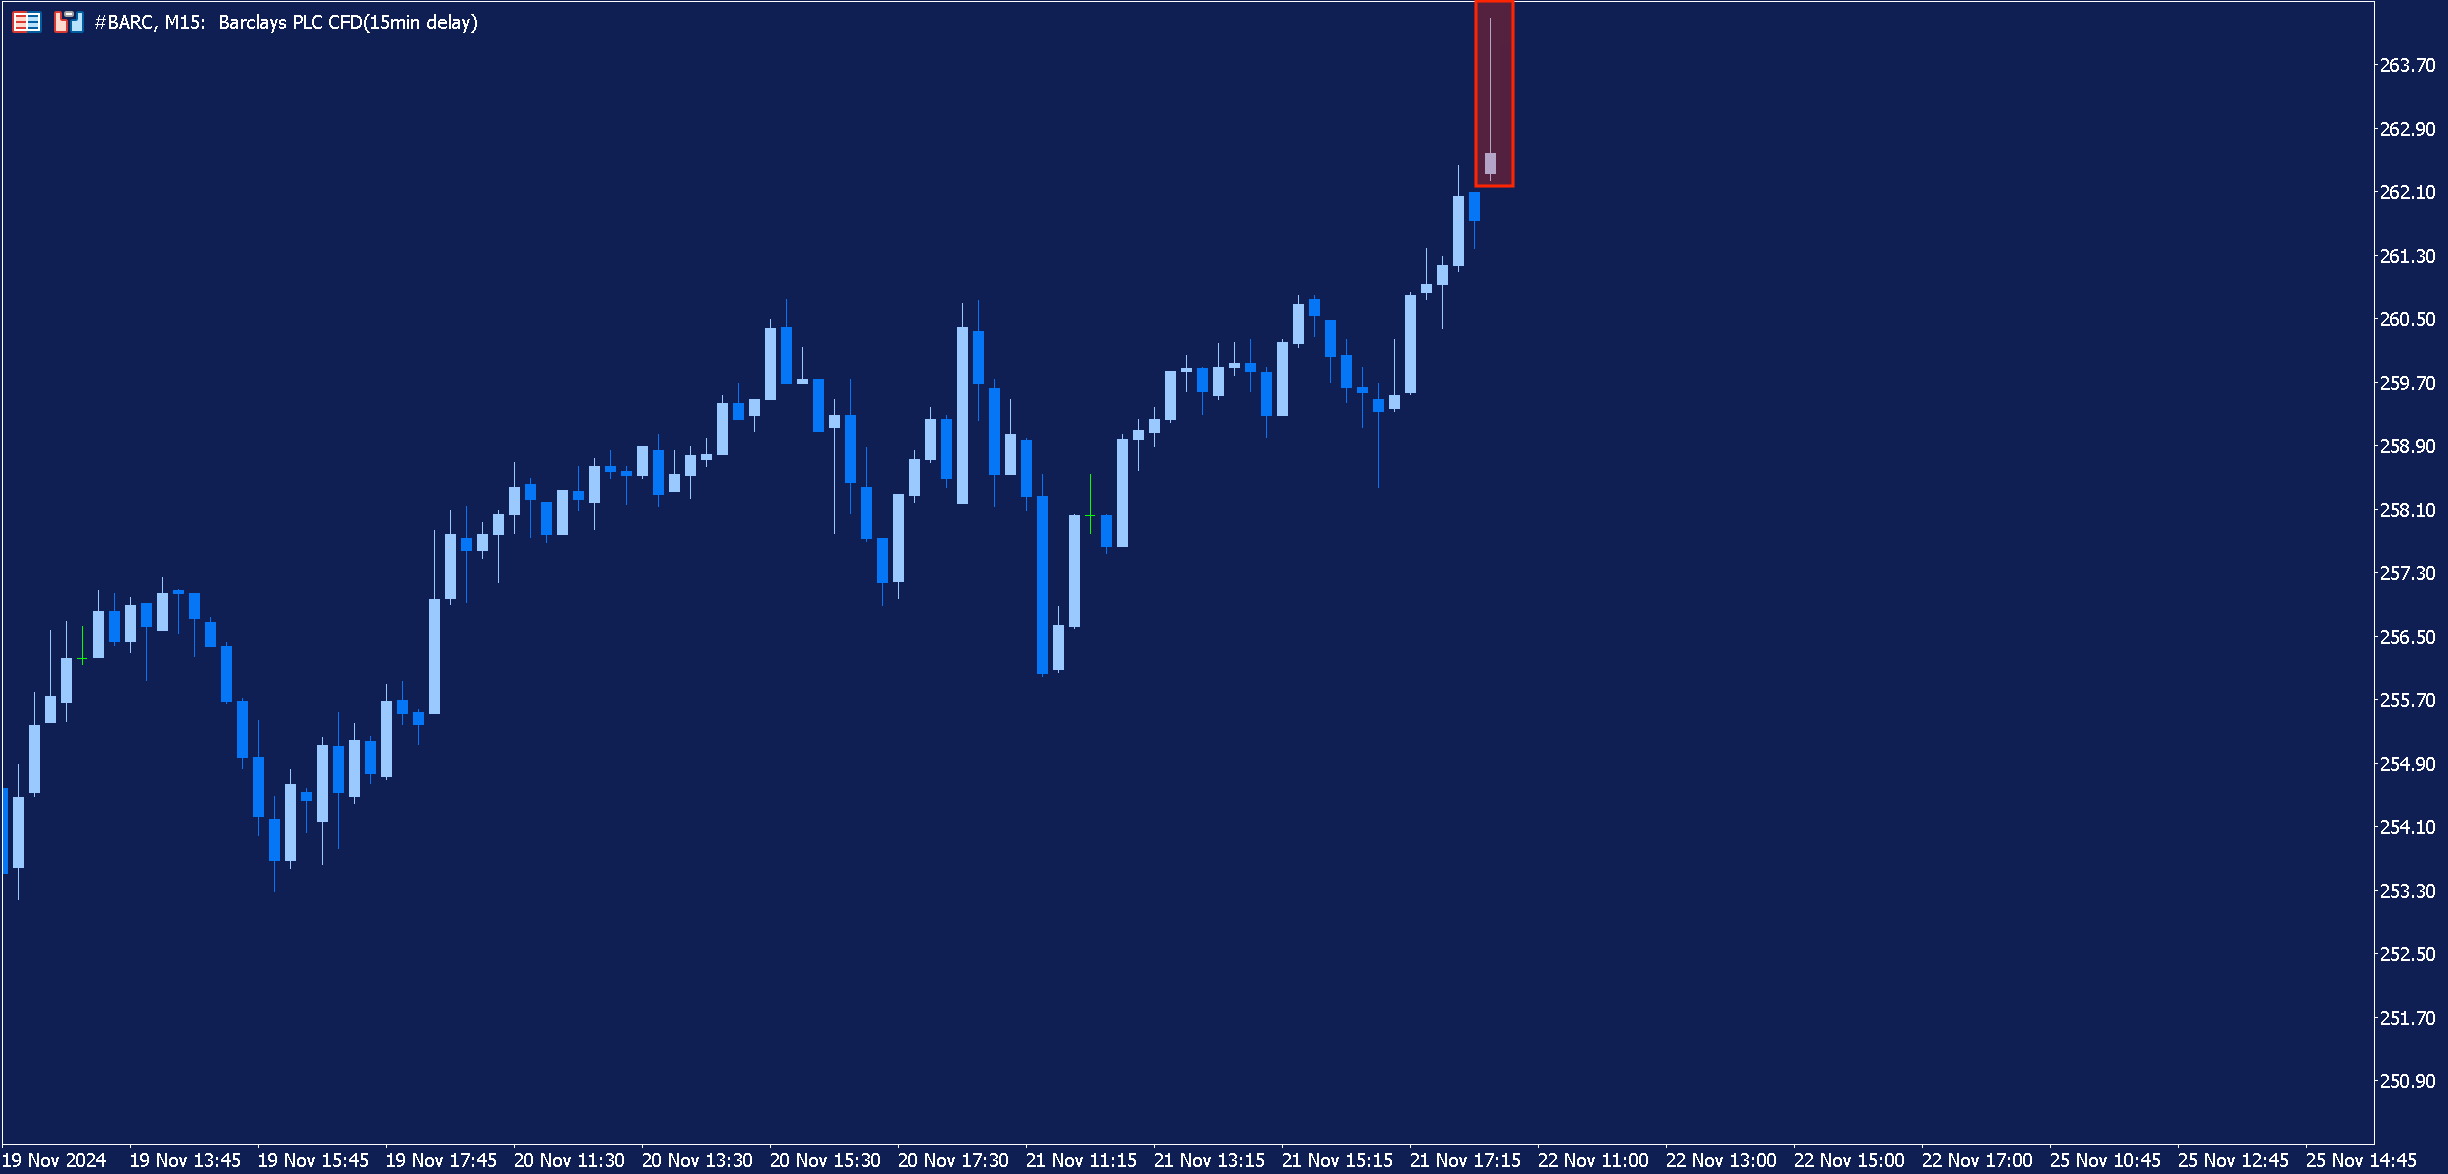
We have our initial signal of a potential bearish reversal but, remember, before entering the market, the prudent thing to do is to seek confirmation from a different source.
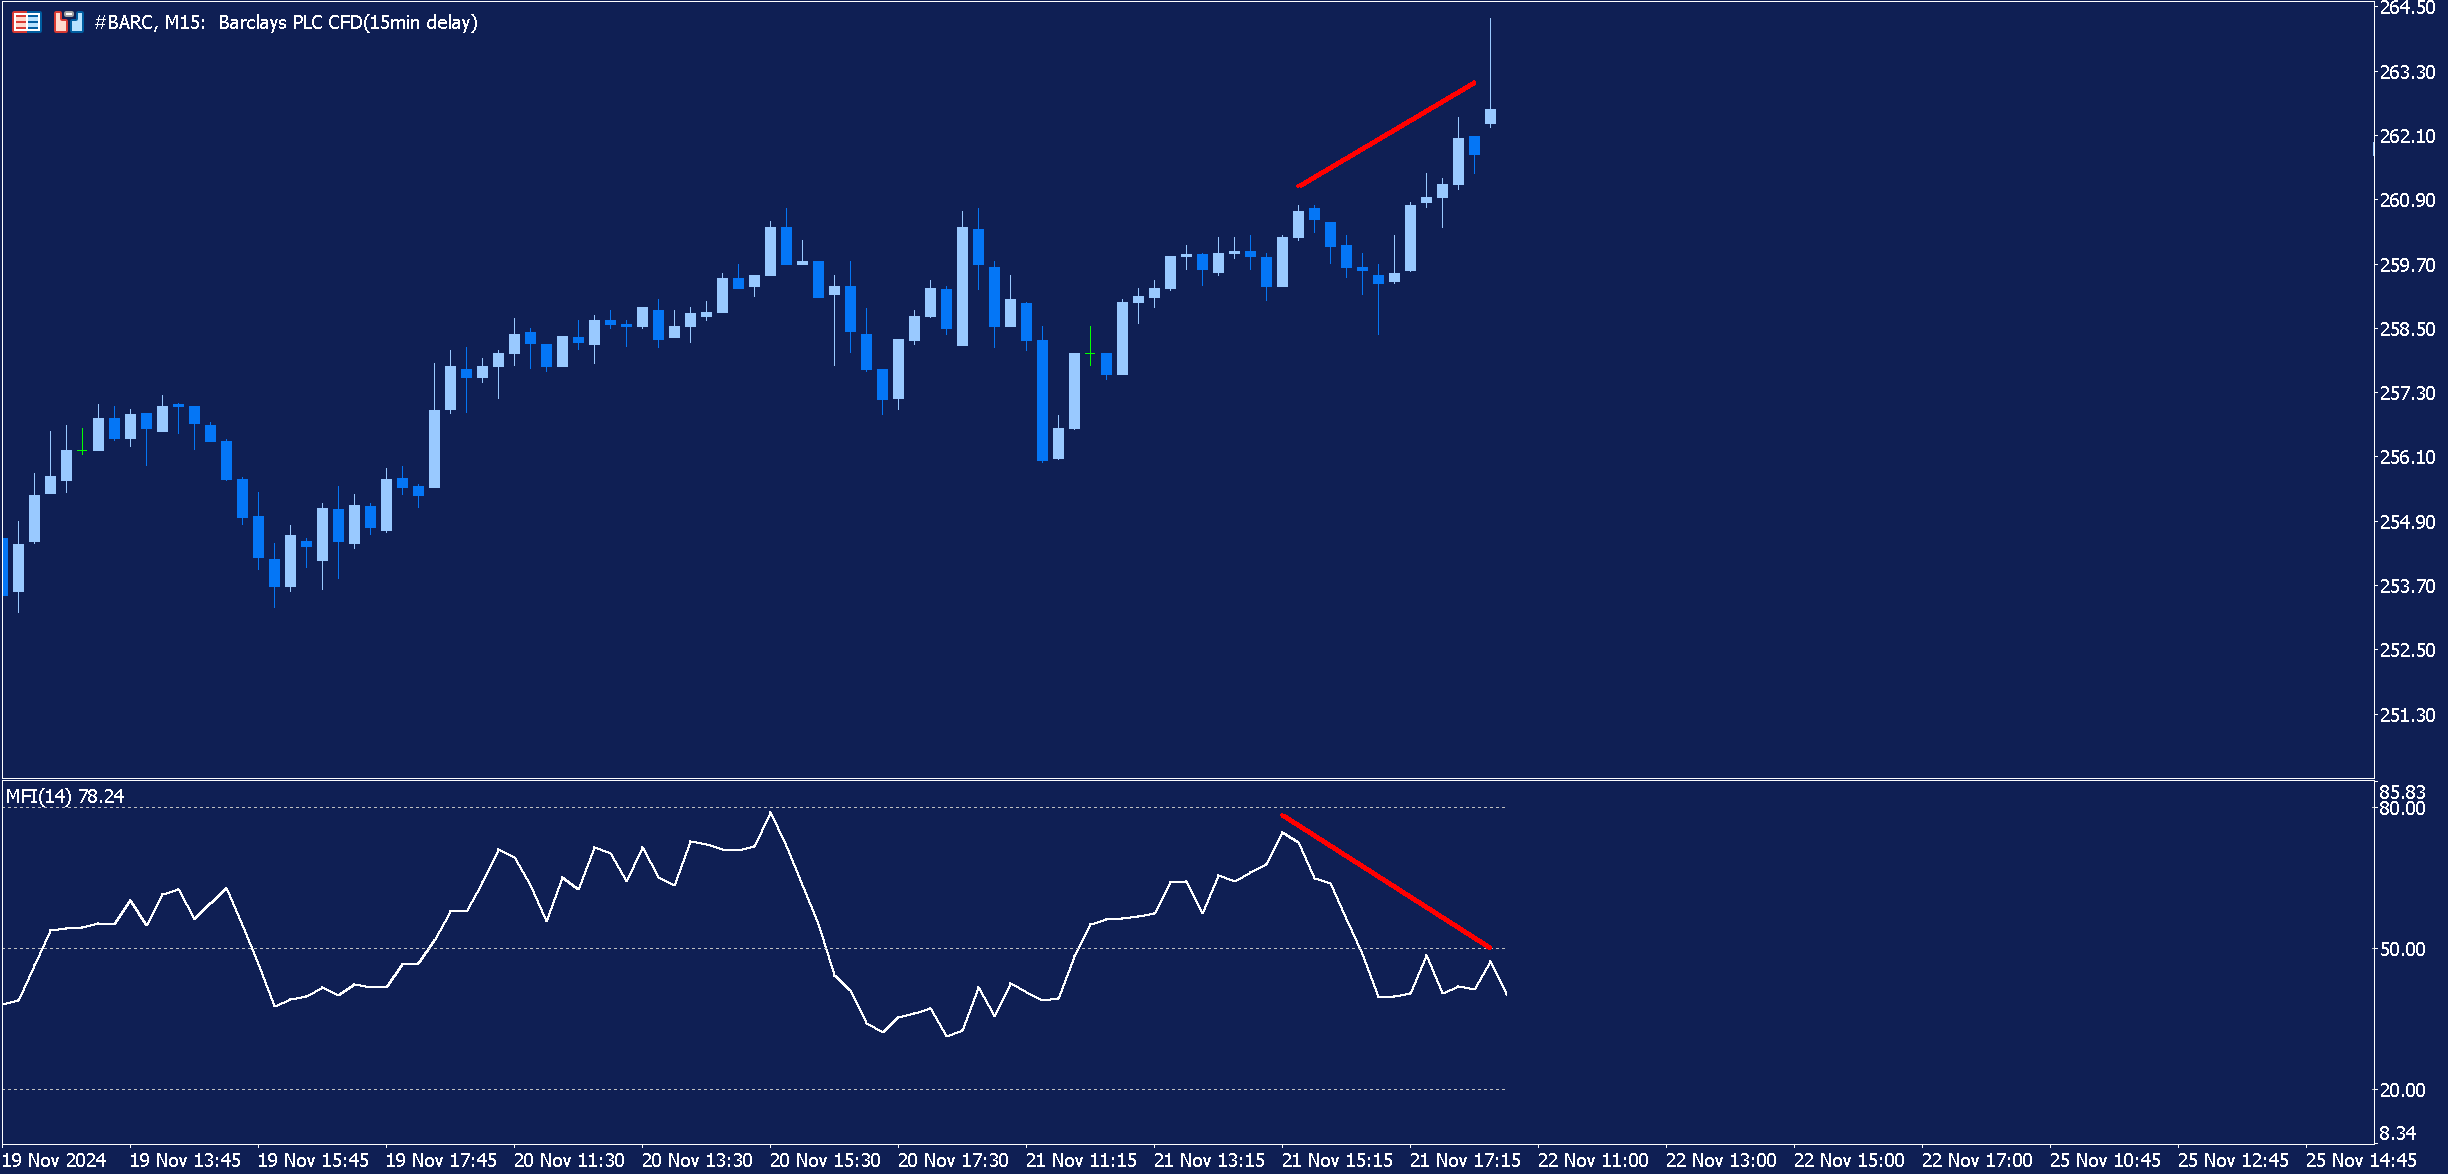
Below is the same 15-minute chart as above, however, now we have added the Money Flow Index indicator. We can see that, whilst the share price of Barclays continues to move upwards, the MFI indicator moves in the opposite direction. This divergence can signal an imminent reversal in price.
Entry and Exit
Now we have identified a shooting star and found additional evidence of a potential reversal by way of identifying divergence between price and the MFI indicator.
At this point, more aggressive traders may choose to enter the market at the close of the shooting star. However, a more conservative approach would be to wait to see what happens in the following session.
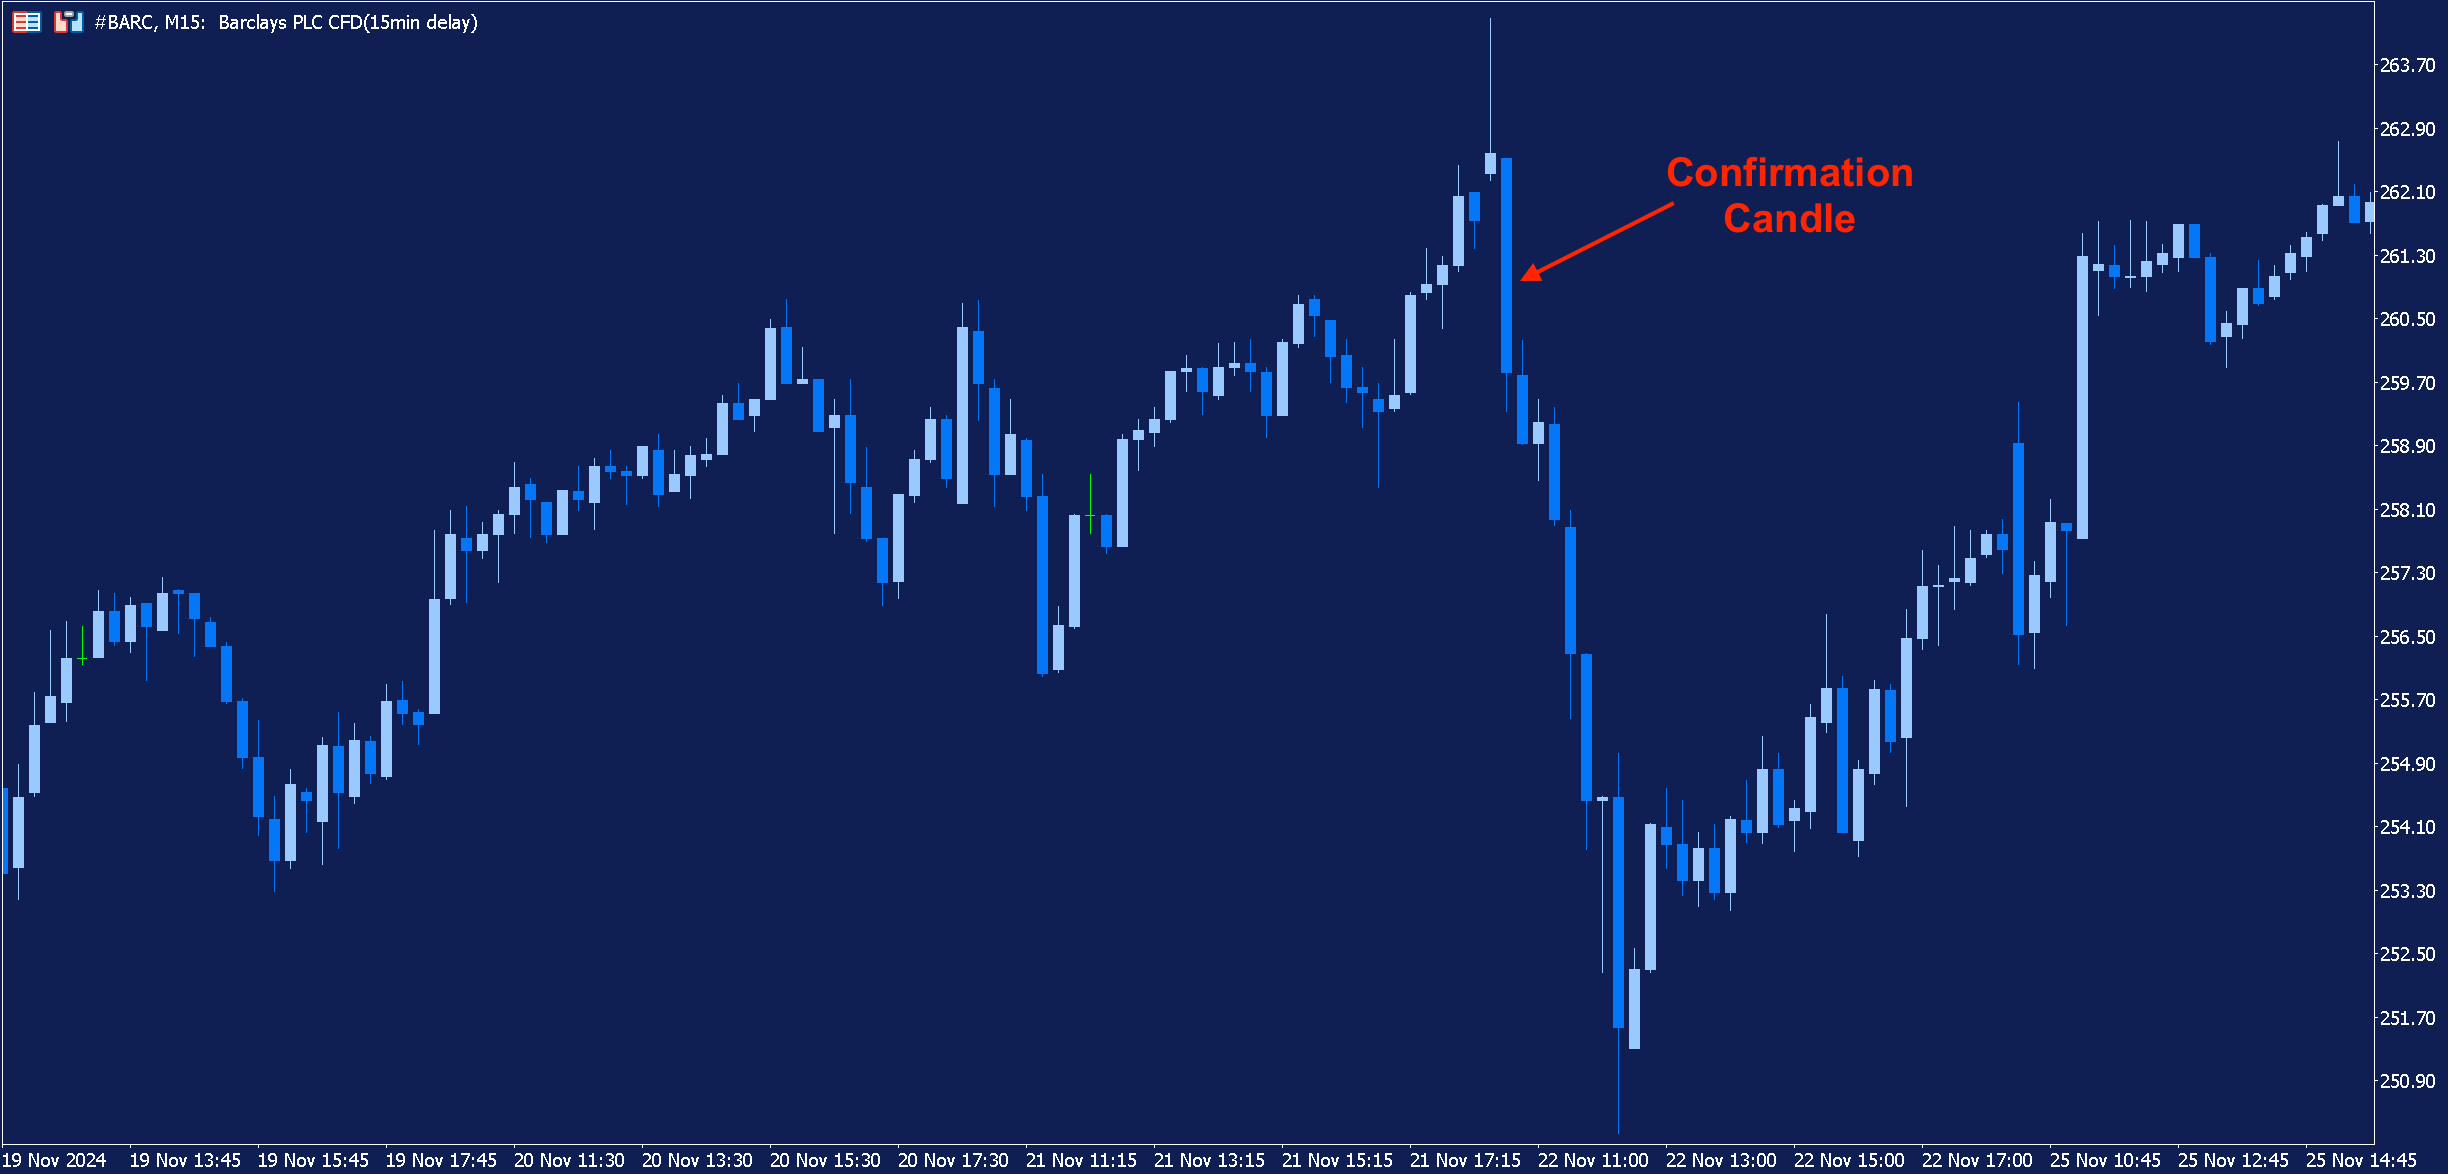
The next session results in a bearish candle, confirming the downward movement and providing a potential entry signal.
The candlestick pattern doesn’t provide a specific exit point, traders can seek exit points using technical indicators, analysing support and resistance levels or identifying a change in sentiment in the form of bullish candlestick patterns.
Risk Management
The markets can be unpredictable and, even with additional confirmation, price may not behave how traders anticipated. A bearish reversal may never materialise.
Consequently, it’s important to practice good risk management when trading. Never risk too much on any one trade and set a stop-loss to help limit losses if the market moves against you. When trading the shooting star candlestick, a stop-loss could be placed above the high of the shooting star.
Traders might also want to set a take profit in order to secure any gains. Previous support levels or tools such as Fibonacci retracement levels could be used to help set these profit targets.
Conclusion
The shooting star candle is a bearish reversal signal which appears during an uptrend. However, its appearance alone is not typically considered a strong enough signal to take a position in the market. Instead, traders can seek additional confirmation by analysing trading volume, using technical indicators and waiting for confirmation of the downwards move.
Even with additional confirmation, it is still crucial for traders to exercise proper risk management techniques such as setting a stop-loss to protect capital from adverse market movements.
Risk-Free Demo Trading Account
Interested in testing a strategy using the shooting star candlestick but not yet ready for the live markets? With a demo account from Admirals, you can practise trading in realistic market conditions using virtual currency. Click the banner below to open your free demo account today:

INFORMATION ABOUT ANALYTICAL MATERIALS:
The given data provides additional information regarding all analysis, estimates, prognosis, forecasts, market reviews, weekly outlooks or other similar assessments or information (hereinafter “Analysis”) published on the websites of Admirals' investment firms operating under the Admirals trademark (hereinafter “Admirals”). Before making any investment decisions please pay close attention to the following:
- This is a marketing communication. The content is published for informative purposes only and is in no way to be construed as investment advice or recommendation. It has not been prepared in accordance with legal requirements designed to promote the independence of investment research, and that it is not subject to any prohibition on dealing ahead of the dissemination of investment research.
- Any investment decision is made by each client alone whereas Admirals shall not be responsible for any loss or damage arising from any such decision, whether or not based on the content.
- With view to protecting the interests of our clients and the objectivity of the Analysis, Admirals has established relevant internal procedures for prevention and management of conflicts of interest.
- The Analysis is prepared by an analyst (hereinafter “Author”). The Author, Roberto Rivero, is a contractor for Admirals. This content is a marketing communication and does not constitute independent financial research."
- Whilst every reasonable effort is taken to ensure that all sources of the content are reliable and that all information is presented, as much as possible, in an understandable, timely, precise and complete manner, Admirals does not guarantee the accuracy or completeness of any information contained within the Analysis.
- Any kind of past or modeled performance of financial instruments indicated within the content should not be construed as an express or implied promise, guarantee or implication by Admirals for any future performance. The value of the financial instrument may both increase and decrease and the preservation of the asset value is not guaranteed.
- Leveraged products, including Contracts for Difference (CFDs) are speculative in nature and may result in losses or profit. Before you start trading, please ensure that you fully understand the risks involved.