Hammer Candlestick Pattern - UK Traders' Guide
To create this comprehensive guide on the hammer candlestick pattern, I consulted with seasoned traders and market analysts to ensure both accuracy and valuable insights for investors of all experience levels in the UK.
Candlestick patterns are a widely used tool for analysing market price action. Many traders incorporate them into their strategies to understand what is happening in the market and to identify potential trading opportunities. While there are numerous candlestick patterns, the hammer candlestick pattern is particularly useful for the insights it offers.
This material is for informational purposes only and not financial advice. Consult a financial advisor before making investment decisions.
Table of Contents
- Key Takeaways
- Understanding the Hammer Candlestick Pattern
- FTSE 100 and FTSE 250: How the Hammer Affects Major Indices
- GBP/USD and EUR/GBP: Exchange Rates and the Hammer Candlestick Pattern
- Gold and Oil: Safe Haven Assets and the Hammer Candlestick Pattern
- Trading Concepts and Strategies
- The Premium Analytics Candlestick Screener
- Conclusion
Key Takeaways
- The hammer candlestick signals a potential bullish reversal in the market, usually after a downtrend.
- It features a small body towards the top of the candle with a long lower wick. This should be at least twice the size of the body.
- Hammer candles show a reversal of price action after a significant down move in the session, highlighting that buyers are gaining control.
- Due to the hammer candle reflecting the psychological dynamics between buyers and sellers, they can identify bullish trend reversals and impulse waves.
- The Admirals Premium Analytics Screener can automatically detect various chart and candlestick patterns on over 8,000 global instruments.
Understanding the Hammer Candlestick Pattern
The hammer candlestick has several key characteristics and features. Typically, it features a small body that has developed towards the top of the wick. There may be no upper wick, in some cases, or it should be very small. The lower wick, or shadow, should be much longer and at least twice the size of the upper wick.
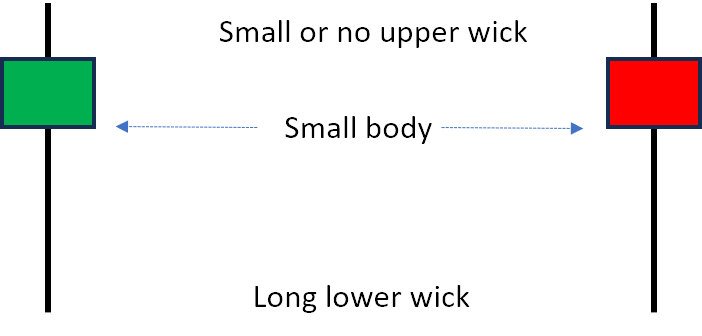
What does the hammer candle tell us? Every candle shows the psychological battle between the buyers and sellers of the market. The hammer is known as a bullish reversal candlestick. This is because the long lower wick shows that sellers drove it lower in the session, but buyers rejected this push lower and the price rallied back towards the top of the candle.
This reversal in price action, is why a hammer is considered to be a bullish reversal signal, signifying a capitulation from sellers to strength in buyers. As the closing price rallies back towards the opening price of the session, it further signifies the strength of buyers.
Importance in Technical Analysis: Reversal or Continuation Signal?
The hammer candlestick can be seen as a reversal and a sign of continuation depending on market context. For example, if the market is in an overall downtrend, approaching a significant level of support, a hammer candle forming may suggest that while sellers tried to break through the support level, buyers rejected the push lower and decided to step. This signals a bullish trend reversal, after a downtrend.
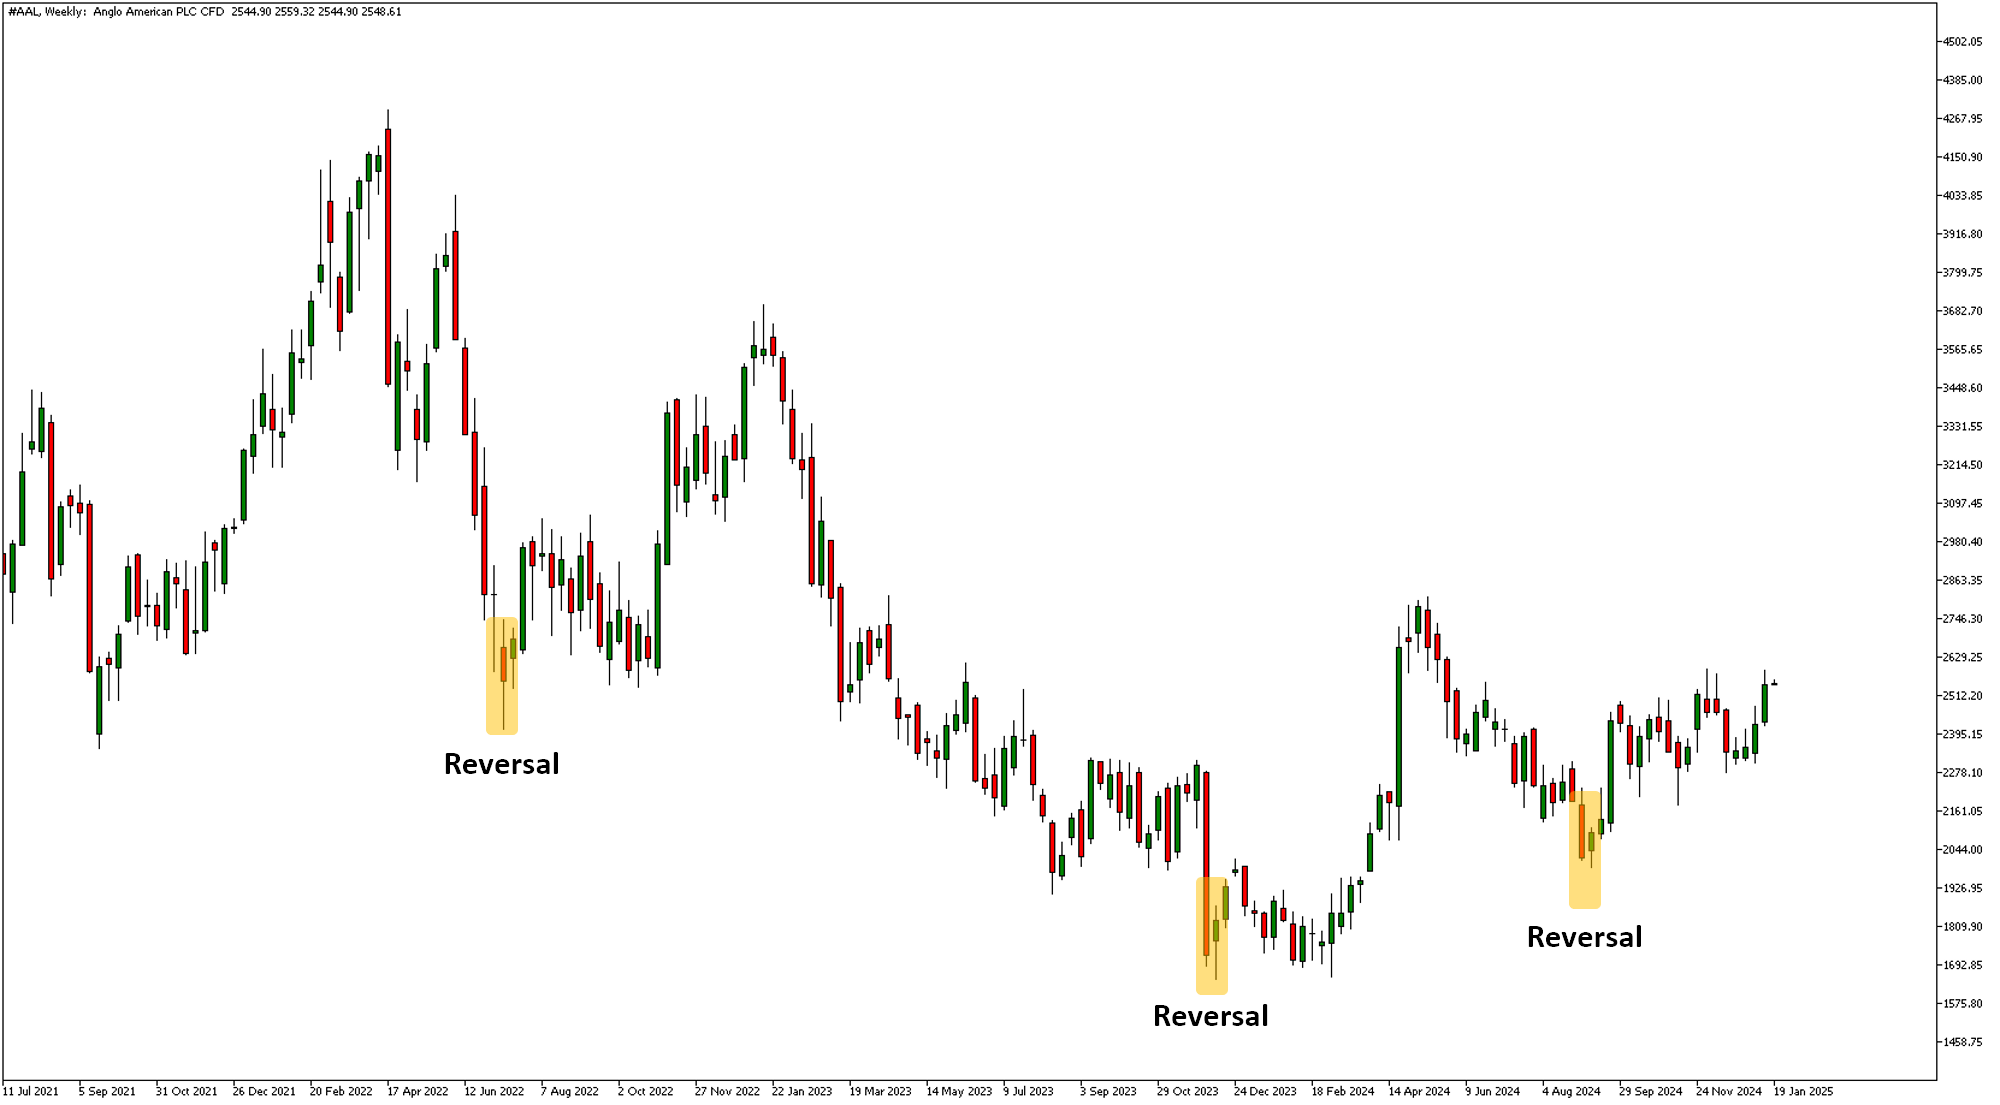
The chart above shows the weekly share price of Anglo American PLC. The yellow boxes highlighted a hammer candlestick pattern that developed after a downtrend, causing a bullish trend reversal. It's important to note that the hammer candle will not start a trend reversal every time, as no one pattern, or indicator, works all the time. The key is to stack probability in your favour by searching for multiple clues the market is presenting to you.
In some cases, the hammer can also signify a continuation of a trend. This is because in an overall uptrend, the market price does not move in a straight line. It creates cycles or waves. Impulse cycles move in line with the trend, while corrective cycles move against the trend. If the market is in a corrective cycle, it may be a matter of time before buyers decide to step in at a low price to start a new impulse cycle. A hammer forming at this point could then signal a continuation of the overall trend.
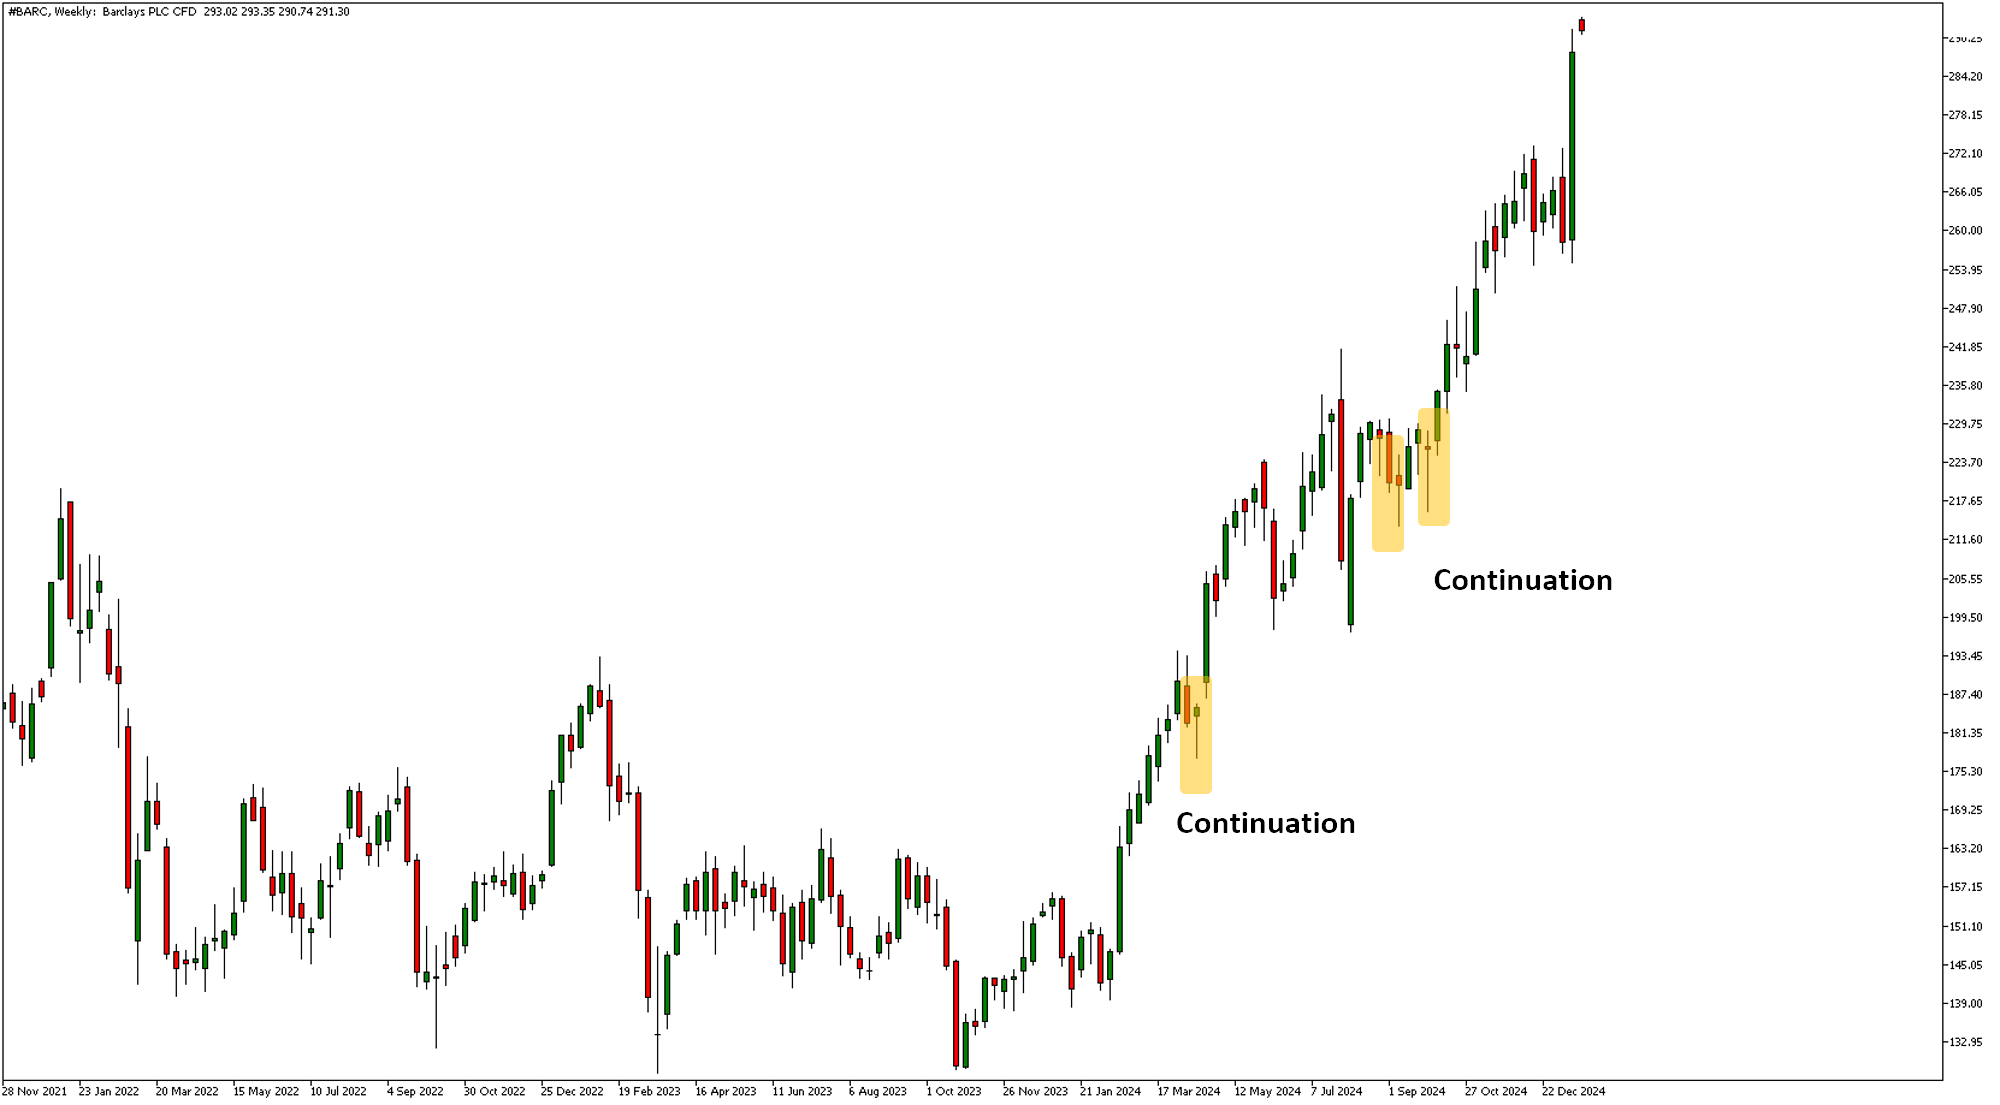
The chart above shows the weekly share price of Barclays PLC. The yellow boxes highlight hammer candles after the small corrective wave cycles in the overall uptrend. Earlier on, we mentioned that a hammer pattern can start a new impulse cycle after a corrective wave cycle, albeit not always.
Whether the hammer candle starts a trend reversal or a continuation of the trend, depends on the market context.
- If the market is in an uptrend, the hammer candle can help to identify the end of corrective wave cycles and the beginning of a new impulse cycle in the direction of the overall trend.
- If the market is in a downtrend, the hammer candle can help to identify the end of that trend and a potential bullish trend reversal.
However, you may notice on a chart that there are many hammer candles that develop. Therefore, it's important to use other analysis techniques to understand the market context. This could be other technical analysis tools, like support and resistance levels or technical indicators.
FTSE 100 and FTSE 250: How the Hammer Affects Major Indices
The hammer candle can be a useful addition when analysing, trading or investing in major UK stock market indices such as the FTSE 100 and FTSE 250. Some analysts may use the hammer on higher timeframes such as monthly and weekly charts to gain better understanding when the index could end a downtrend and start a bullish trend reversal.
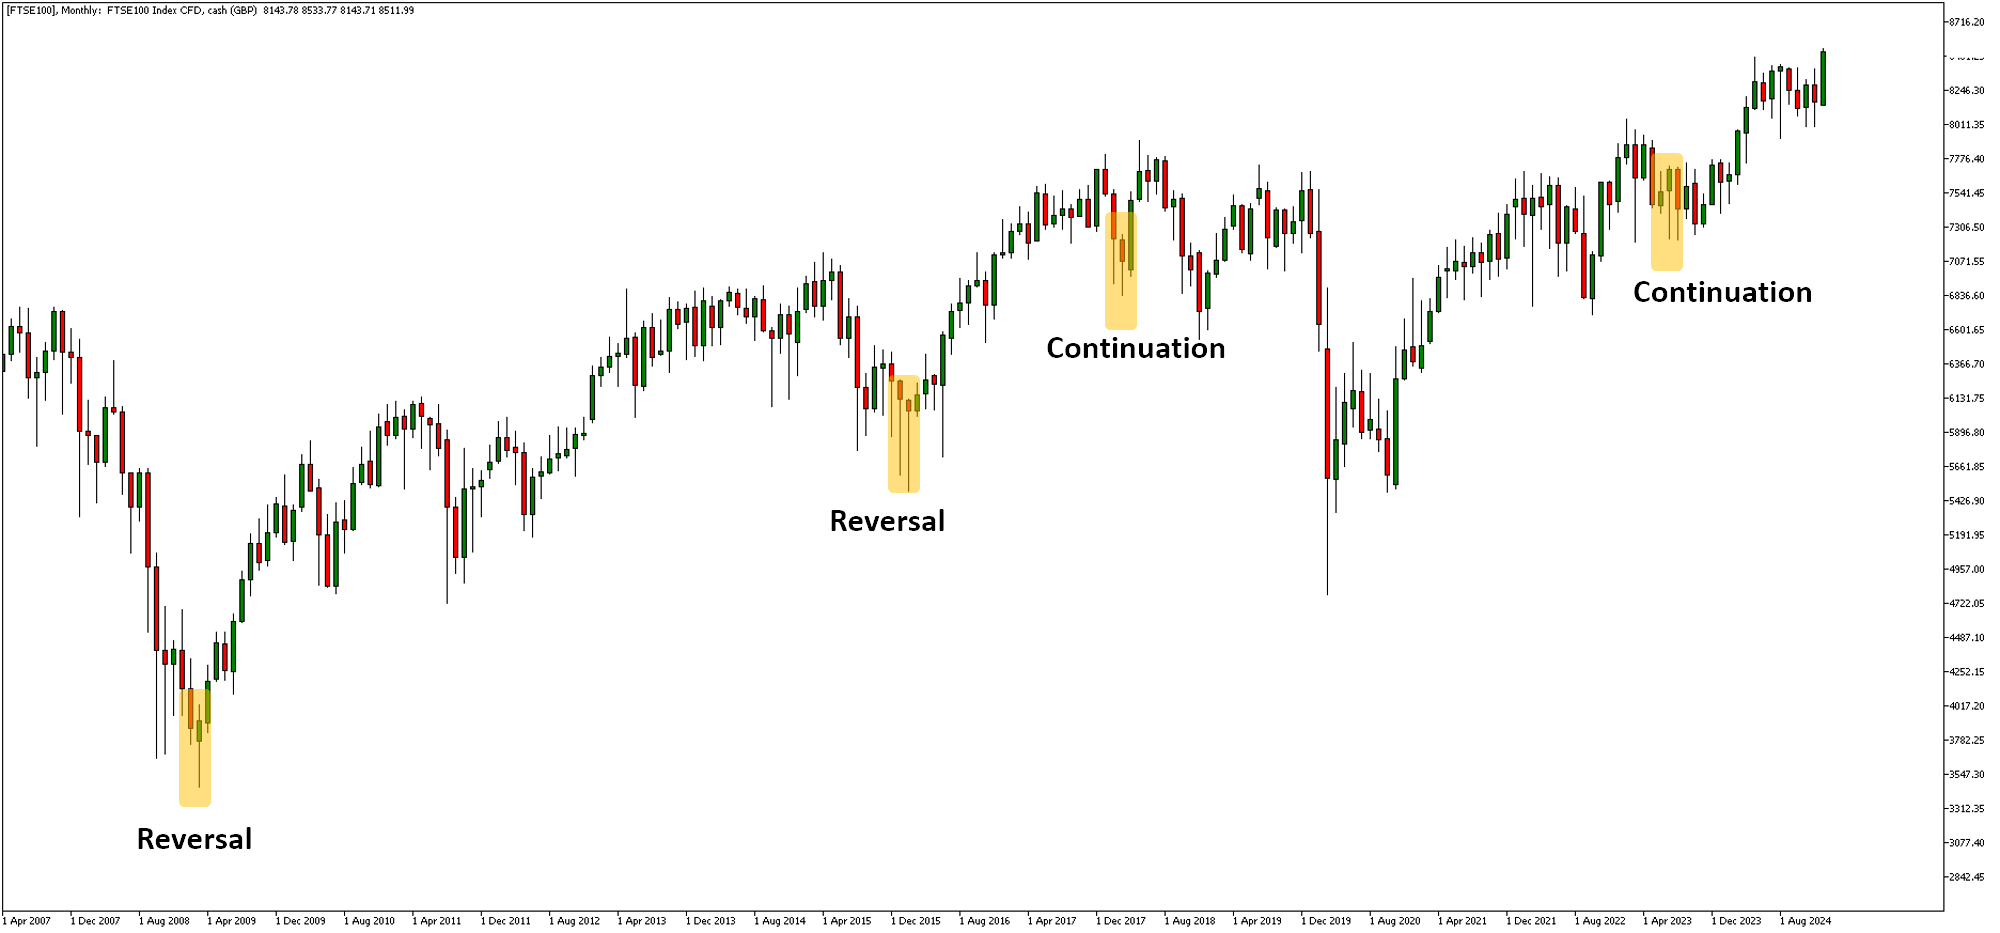
For example, the chart below shows the monthly candles from 2007 of the FTSE 100 index. This is an index of the largest 100 shares listed on the London Stock Exchange.
The far left of the chart shows the long-term downtrend from the 2008 financial crisis. Interestingly, the end of that downtrend recorded a hammer candle, starting a bullish trend reversal. The downtrend from 2014 and 2015 also ended with a hammer candle.
During 2015-2018 and 2019-2024, there was a sustained uptrend. Some of the corrective cycles ended with a hammer candle, signifying the beginning of a new impulse cycle. The hammer candle did not appear on every trend continuation or bullish trend reversal as no pattern will work 100% of the time.
Analysts can use the hammer candle on higher timeframes to gain a better understanding of what is happening in the market. Investors may choose to invest in an FTSE 100 ETF to try and capitalise on any growth in the index. Stock traders may use this as a bias to understand that the market may trend higher and then research individual stocks that could also grow in the future.
Alternatively, medium to short-term traders may decide to view the lower timeframes for opportunities to try and trade the FTSE 100, using the higher timeframes as part of their analysis. There are multiple ways to use hammer candles on the FTSE 100 and FTSE 250 indices, depending on your style and trading or investing philosophy.
GBP/USD and EUR/GBP: Exchange Rates and the Hammer Candlestick Pattern
The hammer candlestick pattern can also be used on the foreign exchange market, in particular GBP/USD and EUR/GBP. A currency pair's exchange rate constantly fluctuates in price 24 hours a day, 5 days a week. Sometimes, these fluctuations can leave clues behind on who is in control of the market - buyers or sellers. This is where candlestick patterns, like hammers, become useful.
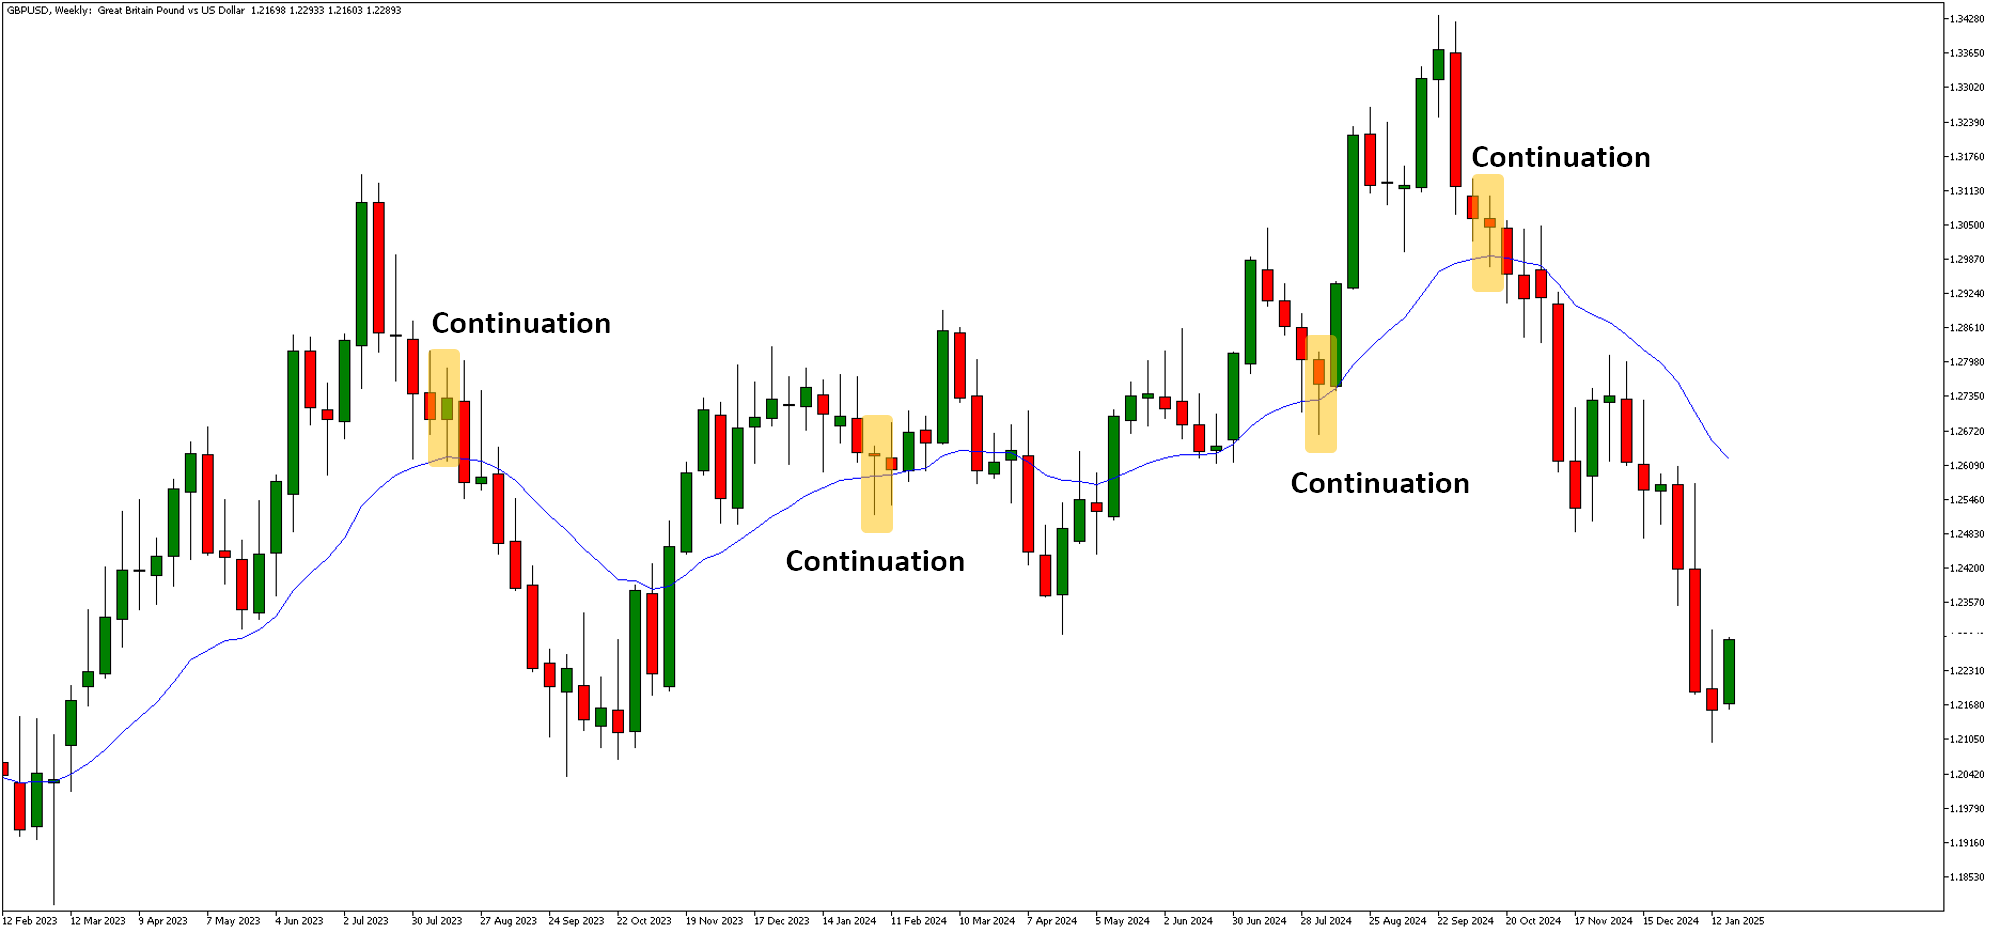
The chart above shows the GBP/USD exchange rate on a weekly timeframe. The blue line is the 20-period exponential moving average. It is an indicator used to help determine the trend. Typically, when the price is above the moving average, the market is bullish; when below the moving average, it's bearish.
The yellow boxes highlight a few of the hammer candles that have developed when the price is above the moving average and the market is bullish. In the first and last examples, the trend did not continue. However, in the two middle examples, the trend did continue, highlighting the usefulness of the hammer candle when combined with other technical clues.
Traders may decide to trade directly from the weekly chart or view the lower timeframes, such as the daily and 4-hour charts, to look for trading opportunities in the same direction as the higher timeframe.
Gold and Oil: Safe Haven Assets and the Hammer Candlestick Pattern
In times of economic turmoil and global uncertainty, some investors may flock to safe-haven assets. These are assets which can act as a hedge to markets that are more vulnerable. For example, during political or military upheaval, investors tend to flock to gold as a safe haven as a provides a store of value for the capital. When there are increasing tensions in the Middle East, investors may choose to invest in oil to protect their interests in the region.
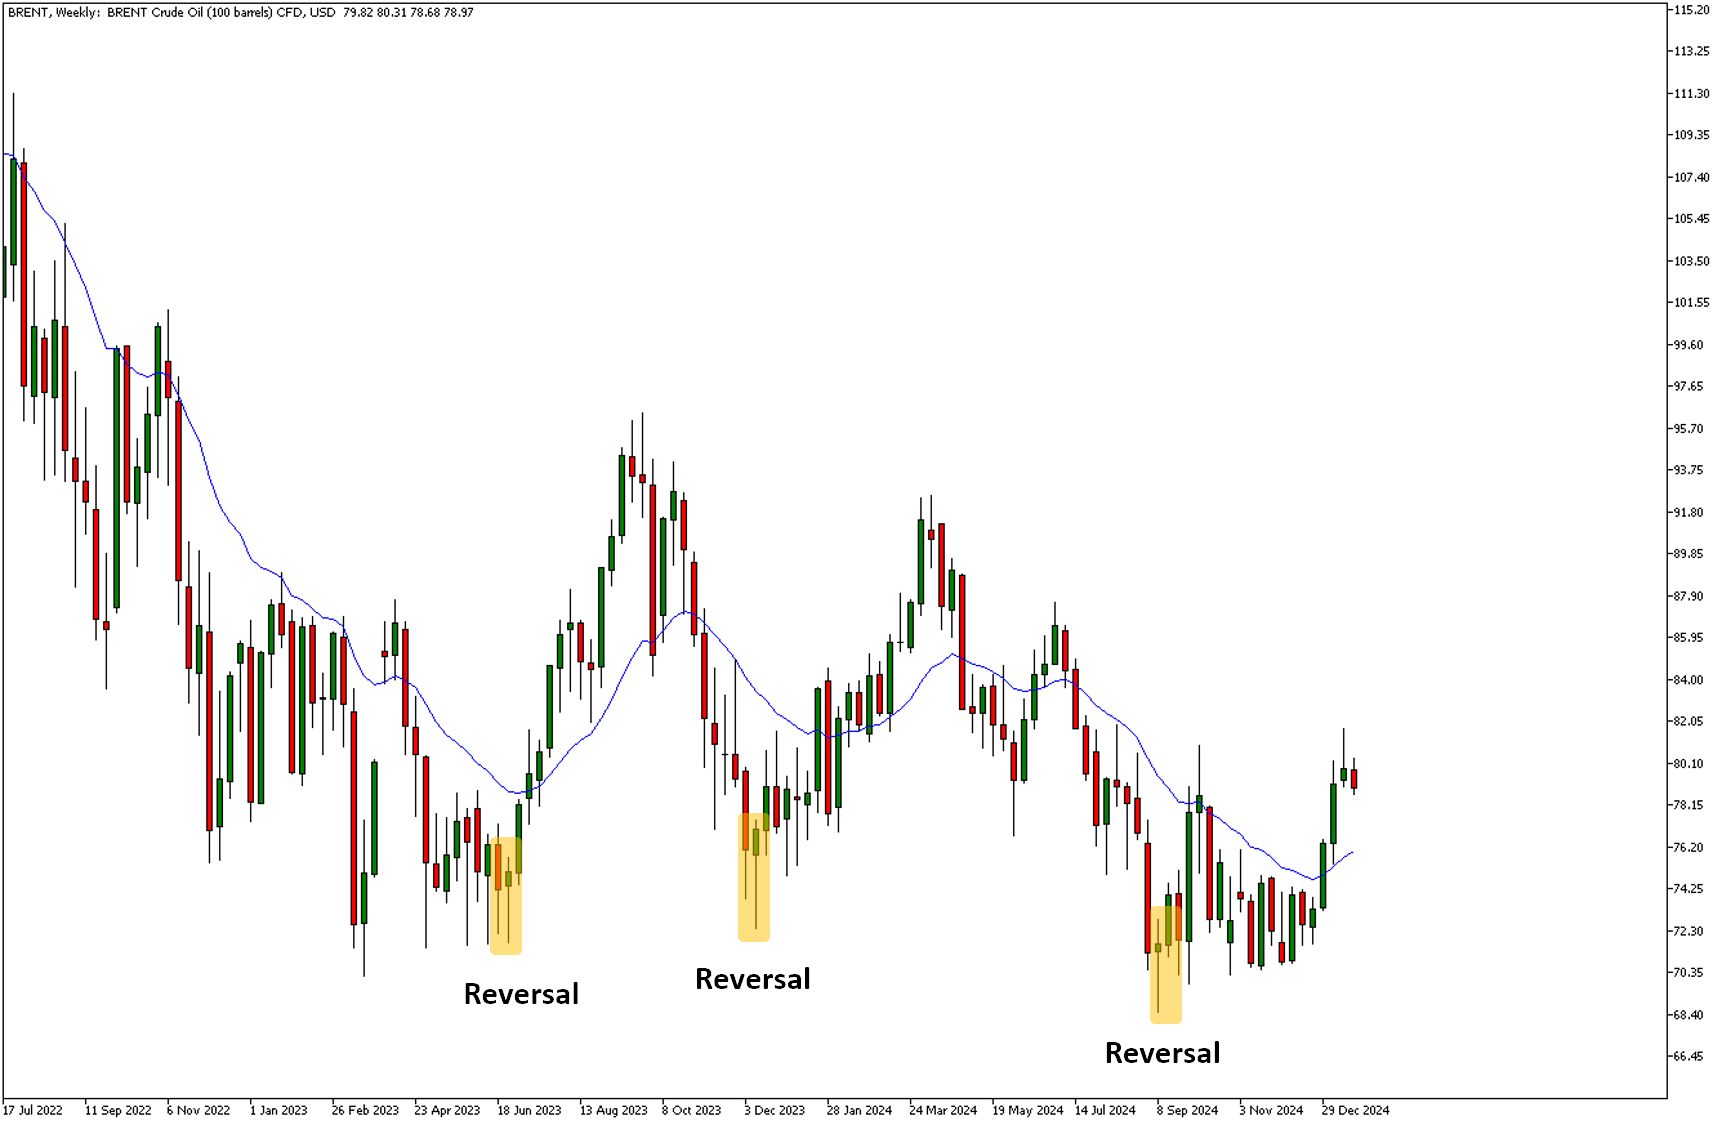
The hammer candlestick pattern, along with other technical indicators, can help to trade both oil and gold. For example, below is the weekly price chart of Brent Crude Oil. The yellow boxes highlight just a few of the hammer candles on the chart. When the price has fallen through the 20 exponential moving average (blue line) on the chart, the hammer has ended the move lower and put in a bullish trend reversal, in some cases, but not all.
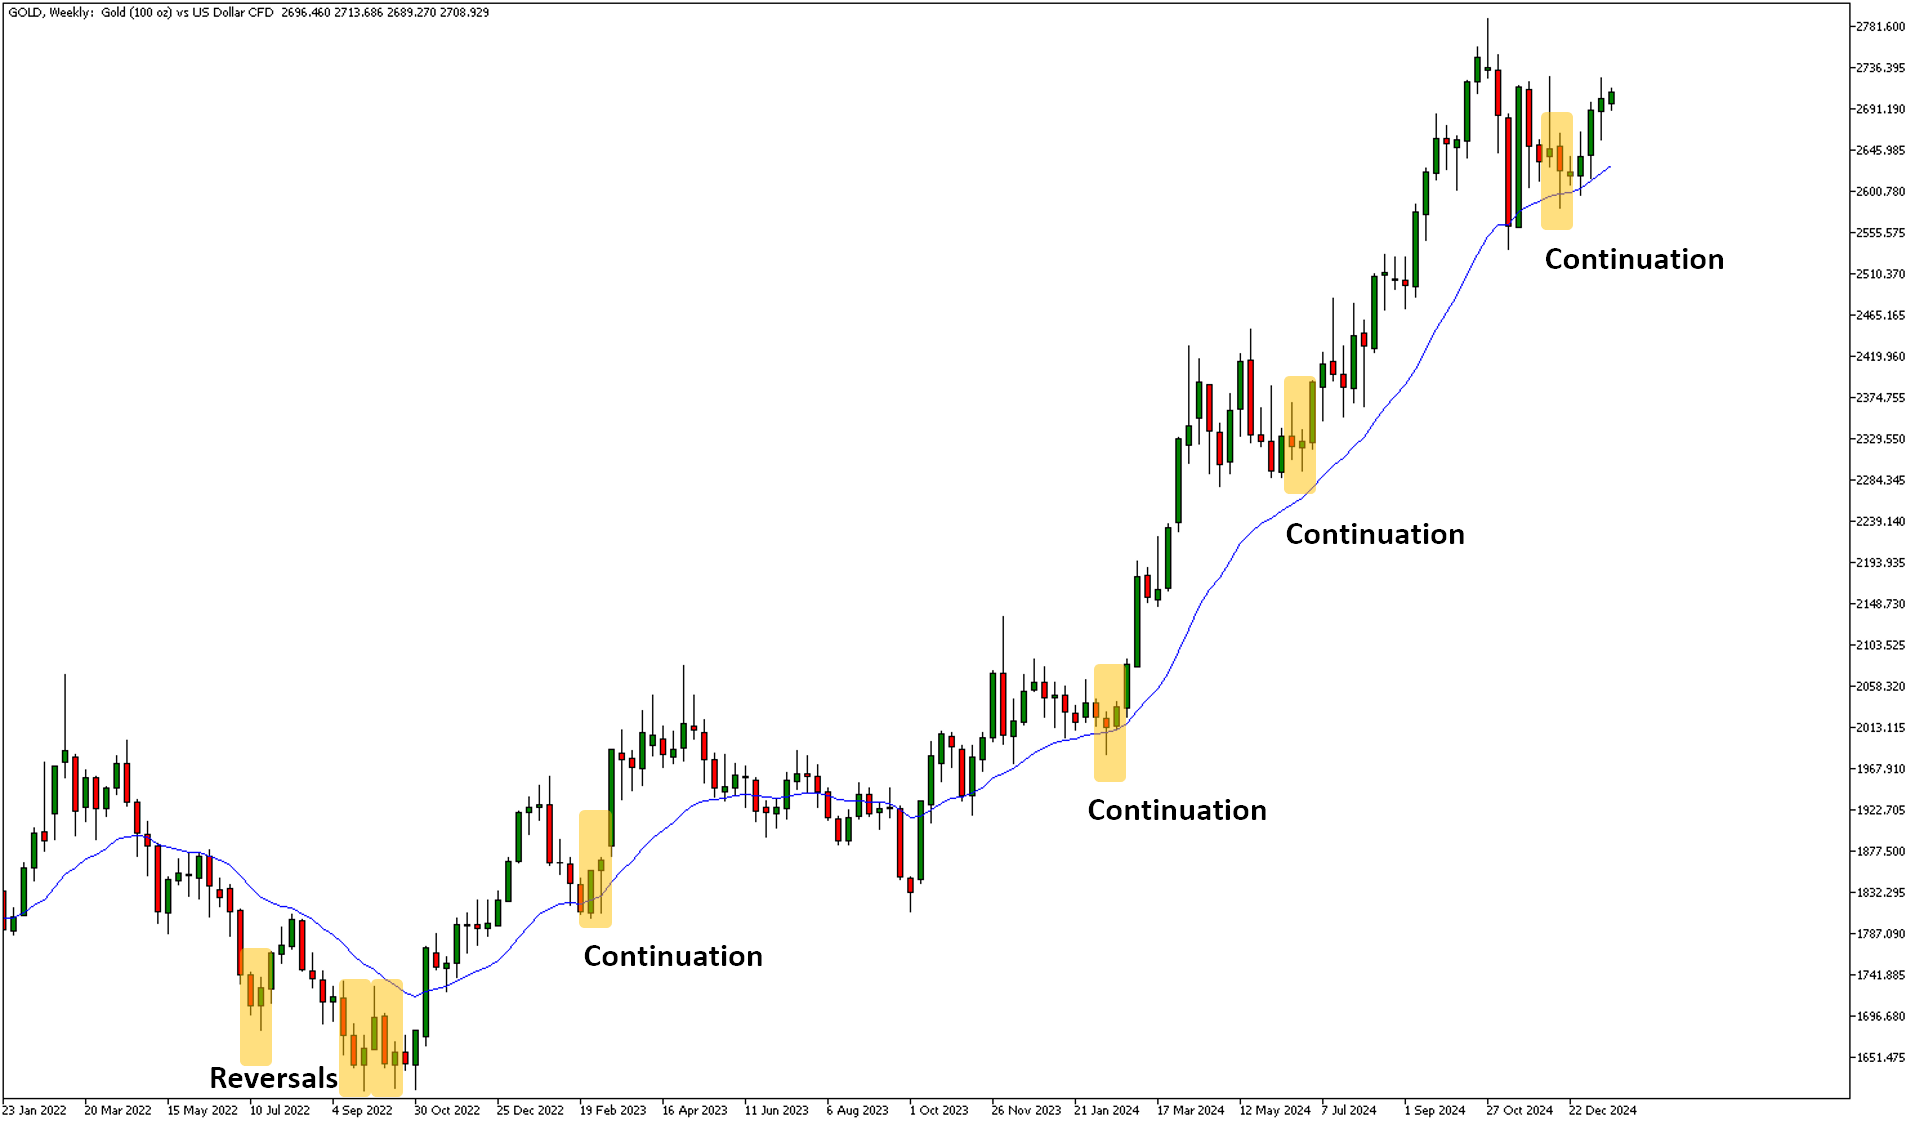
Below is the weekly price chart of Gold against the US dollar. Since October 2023, the price has stayed above the 20 exponential moving average on the trend signifying an uptrend. In some instances, after the small corrective wave cycles, a hammer candle has started a new impulse cycle, a higher signifying trend continuation.
There are some examples of hammer candles that started a new bullish trend reversal. Most notably, the middle of 2022 saw price trading below the moving average on the chart but ending the downtrend with several hammer candles.
The hammer candle is useful in helping to identify changes in supply and demand in the market. Sometimes, these will result in a trend reversal or trend continuation. Market context is important in all markets. This could involve fundamental analysis as well.
Major markets such as gold and oil are frequently discussed in financial media. This can provide beginners with insights in what's happening in the big picture. From a trading perspective, traders will then look for clues on the chart in line with the bigger picture narrative. Combining multiple types of analysis can be useful.
Trading Concepts and Strategies
There are many different types of candlestick patterns, including the hammer, inverted hammer, bullish and bearish engulfing, piercing line, morning star, three soldiers, spinning tops and many others.
Their reliability depends on the market context they are applied. For example, if a market is an uptrend, many traders may focus on using candlestick patterns that can help identify the beginning of an impulse cycle that is in line with the trend. While some traders may focus on candlesticks to trade the corrective cycles, this approach may be more challenging as corrective cycles are smaller, and you are trading against the trend.
This is why using other confirmation signals and technical indicators can be useful. This way, a trader is never solely relying on one clue but rather looking for multiple clues to converge at the same time. While this can increase the probabilities of the market moving in a particular direction, there are no guarantees. Therefore, risk management is also a key ingredient when using candlestick patterns.
Technical Analysis: Other Indicators and Chart Patterns
There is a wide range of diverse technical analysis indicators and chart patterns that can complement the use of hammer candlesticks.
Horizontal Support & Resistance Levels
A horizontal support and resistance level is a price level where there have been many turns in the past. The struggle of sellers breaking through (a support line) or buyers breaking through (a resistance line) is what makes the price level significant.
These levels are useful when trading trend reversals. For example, let's say the price approached a horizontal support line where sellers have struggled to break through before, and buyers have turned up. Maybe a trend reversal could happen again?
At this point, a trader may want to see a hammer candle form here, which is another clue signifying a bullish trend reversal. While there are no guaranteed outcomes, traders look for different clues to converge around the same price levels.
Moving Averages
Moving averages give a smooth line of price direction by showing the average price of the market over a specified number of periods. They help to quickly identify the trend of the market. This makes them useful in understanding the market context to find the right approach.
For example, if the market is an uptrend and the price is above the moving average, traders can then have a focus on waiting to buy at a low price and sell at a high price. This could involve waiting for the end of a corrective wave cycle and using the hammer candle, along with additional support levels, to then try and trade a trend continuation impulse cycle.
Relative Strength Index (RSI)
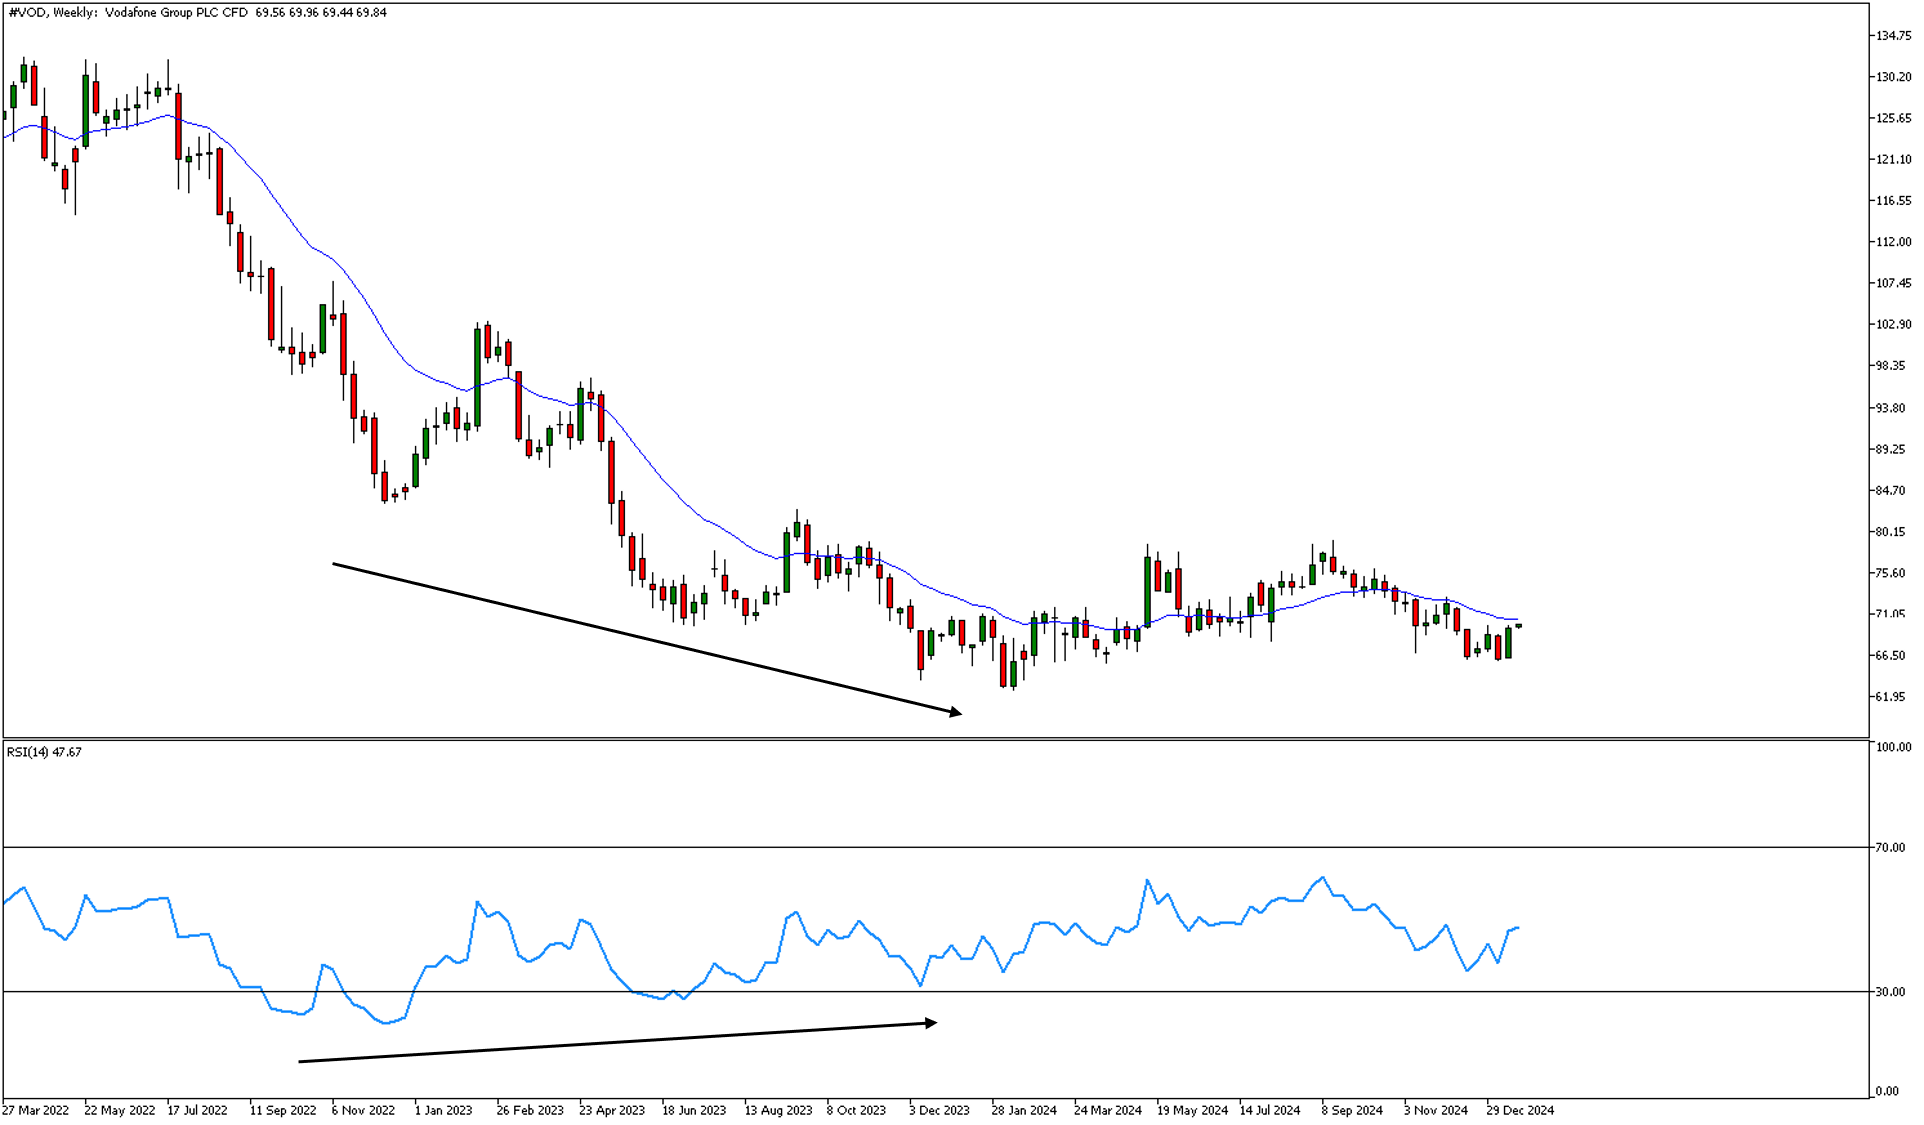
The Relative Strength Index is a momentum oscillator that measures the change and speed of price movement. It is calculated using the number of up and down closes over a specific period of time. It can be used to help identify overbought and oversold conditions and divergences. The latter is when price and the RSI move in opposite directions, signifying that the speed and momentum of the market are waning (as shown in the chart below).
If the market is in a downtrend, approaching a horizontal support level, then traders may want to see the RSI not move in the same direction. If there is a hammer candle present, the trader now has multiple tools telling the same story - there is a higher probability of a bullish trend reversal.
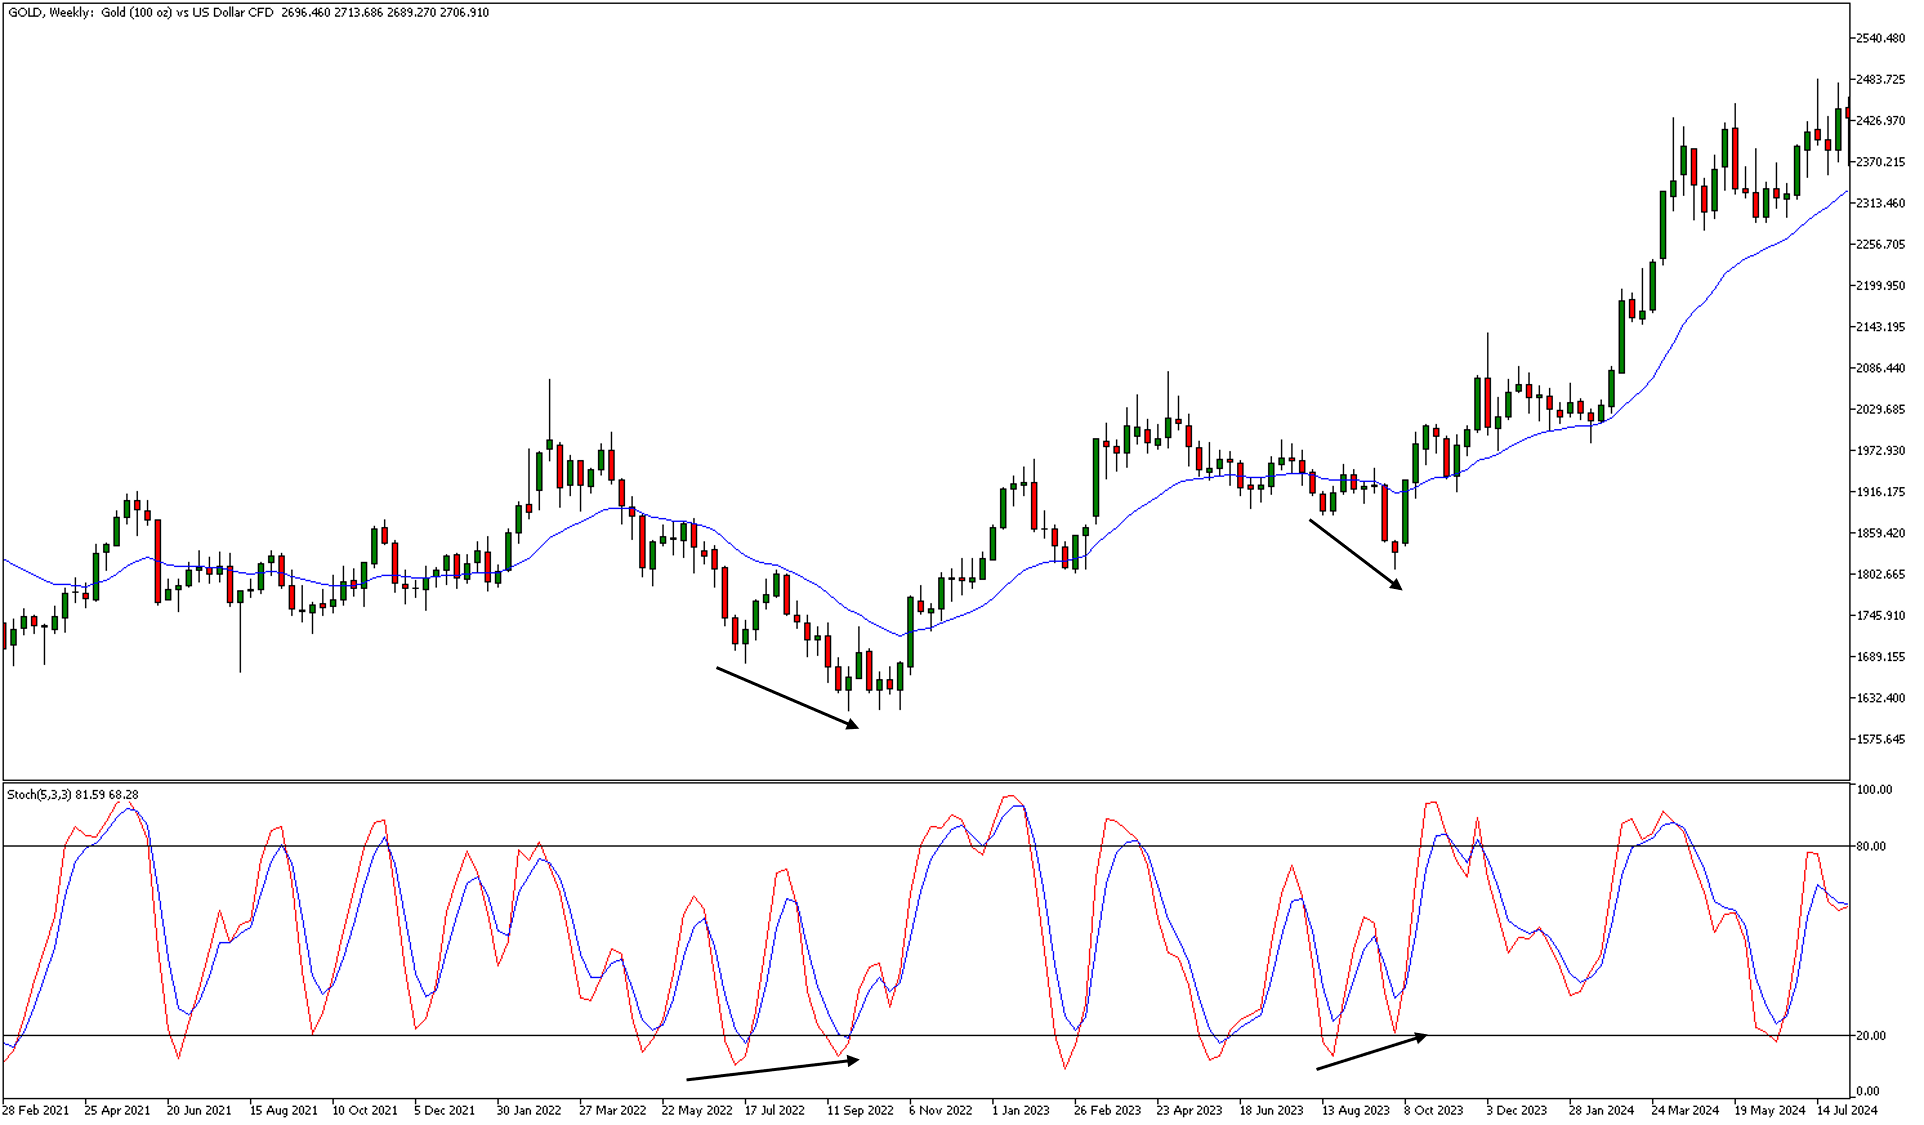
Stochastic Oscillator
The Stochastic Oscillator is another momentum indicator which is used to identify overbought and oversold conditions as well as divergences. It compares an asset's closing price to a specific price range in the past. It is commonly used on smaller cycle formations that develop on the chart.
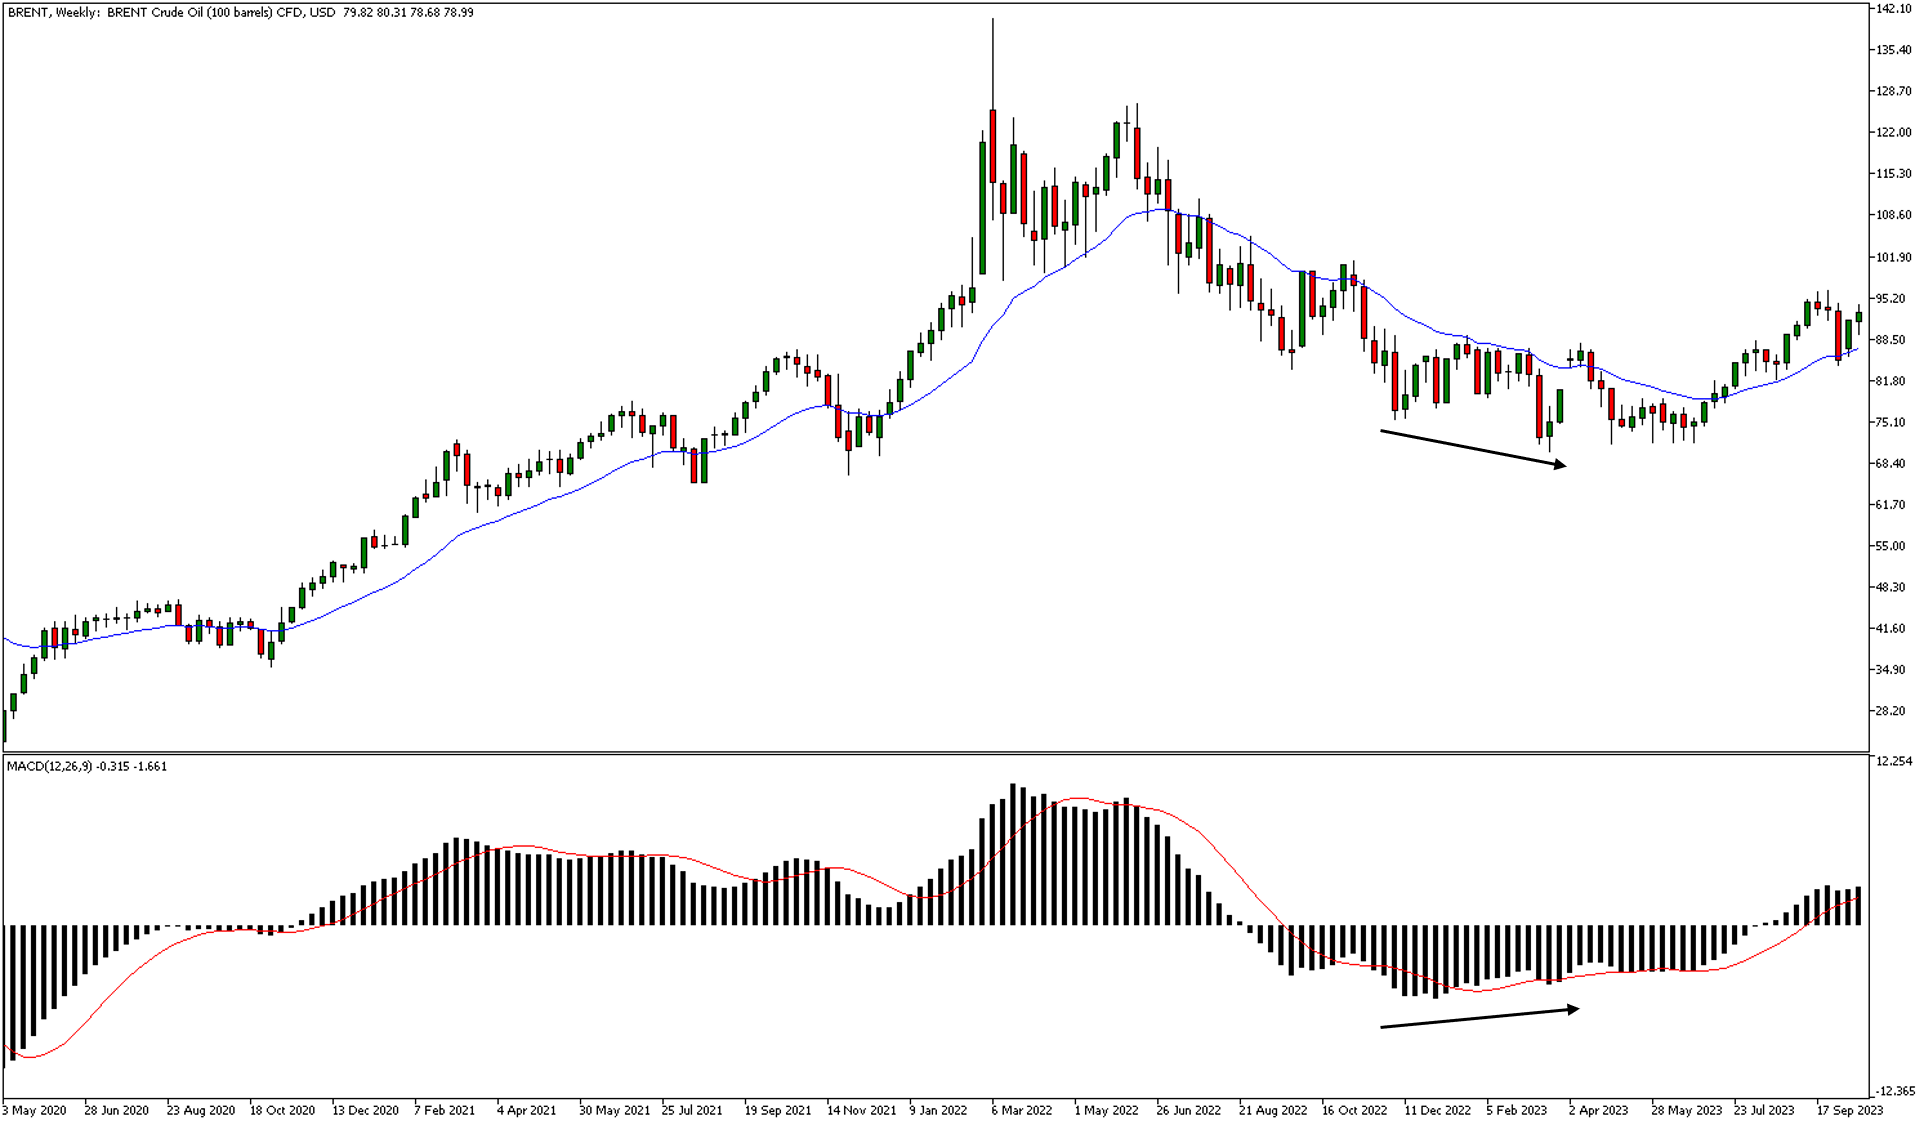
Moving Average Convergence Divergence (MACD)
The MACD is a momentum and trend-following indicator. It consists of three main components: the MACD line, the signal line and a histogram. It can help to identify changes in momentum, direction and strength of a trend. When the histogram is above the zero line, the market is bullish, below and it is bearish.
While the MACD can be used for trend continuation, it can also be used like the RSI and Stochastic Oscillator for divergences. If price and the MACD start moving in opposite directions, it's a sign that momentum is waning, and a trend could be coming to an end.
Implications and Trading Strategies for UK Traders
A trading strategy can help traders to maintain focus and achieve consistency in a very noisy marketplace. A strategy is a set of conditions to assess before entering a trade. These conditions may include technical analysis, candlestick patterns, indicators, and fundamental analysis, along with clear criteria for entry, exit, and risk management.
The example below demonstrates how to build a trading strategy for educational purposes only.
Bullish Hammer Candle Trend Continuation Strategy
- Identify a hammer candle on the chart
- Ensure price is above the 20 exponential moving average
- Check price is on a level of horizontal support
- Check the MACD is above the zero line
- Wait for an oversold Stochastic Oscillator or RSI
- Enter when price breaks above the high of the hammer candle with a stop loss on the low of the candle
- Keep the risk low and target at least one, but ideally two, times your risk
- Whether the trade wins or loses, record it in your trade journal and learn from it
Bullish Hammer Candle Trend Reversal Strategy
- Identify a hammer candle on the chart
- Ensure price is below the 20 exponential moving average
- Check price is on a level of horizontal support
- Wait for divergence on at least two of the following indicators: MACD, RSI, Stochastic Oscillator
- Enter when price breaks above the high of the hammer candle with a stop loss on the low of the candle
- Keep the risk low and target at least one, but ideally two, times your risk
- Whether the trade wins or loses, record it in your trade journal and learn from it
The Premium Analytics Candlestick Screener
A useful tool to aid in your trading strategies is to use the Admirals Premium Analytics candlestick screener. This feature scans thousands of global stocks, including UK shares, to let you know different technical events developing.
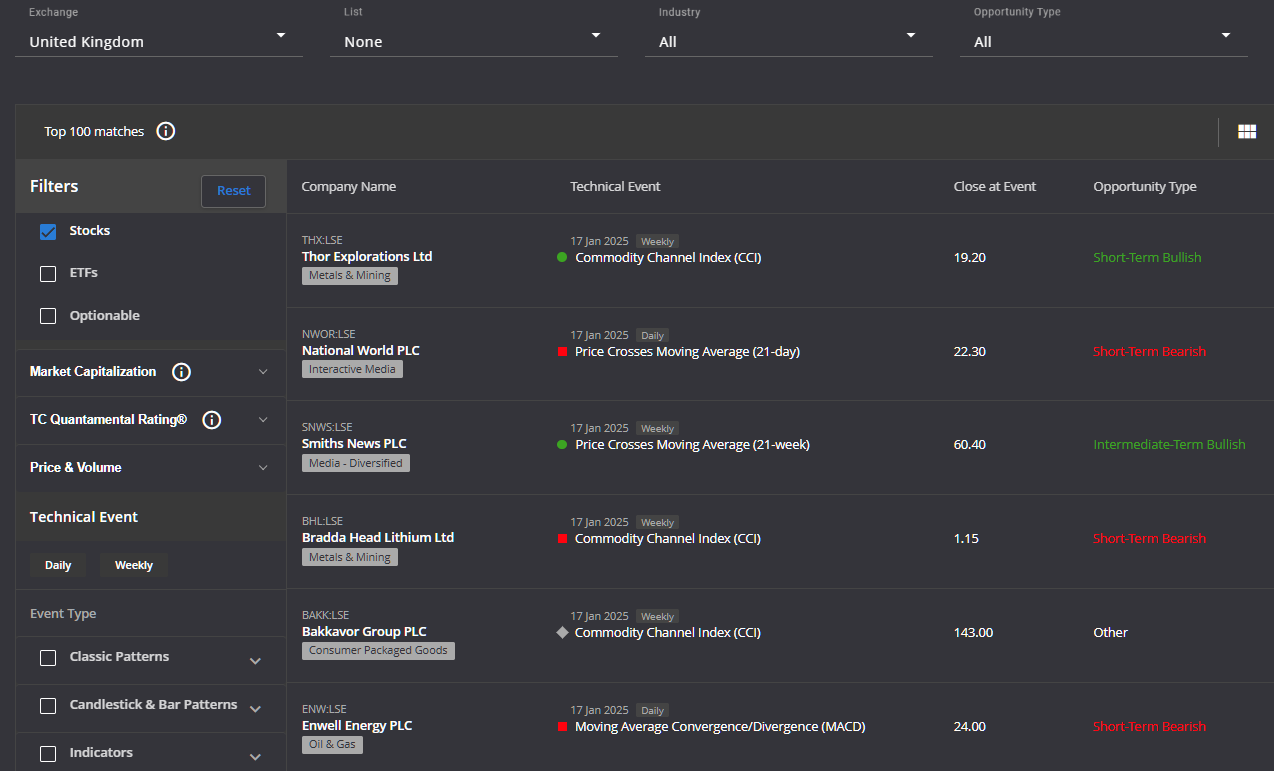
You can select global stocks or just UK stocks and then there are multiple options to scan for Classic Patterns, Candlestick Patterns, Indicators and more. The algorithmic technology will then find all the UK stocks that are exhibiting different technical events, saving you hours of research time.
If you click on any of the stocks, it will then provide further information regarding the different technical events and offer support and resistance levels.
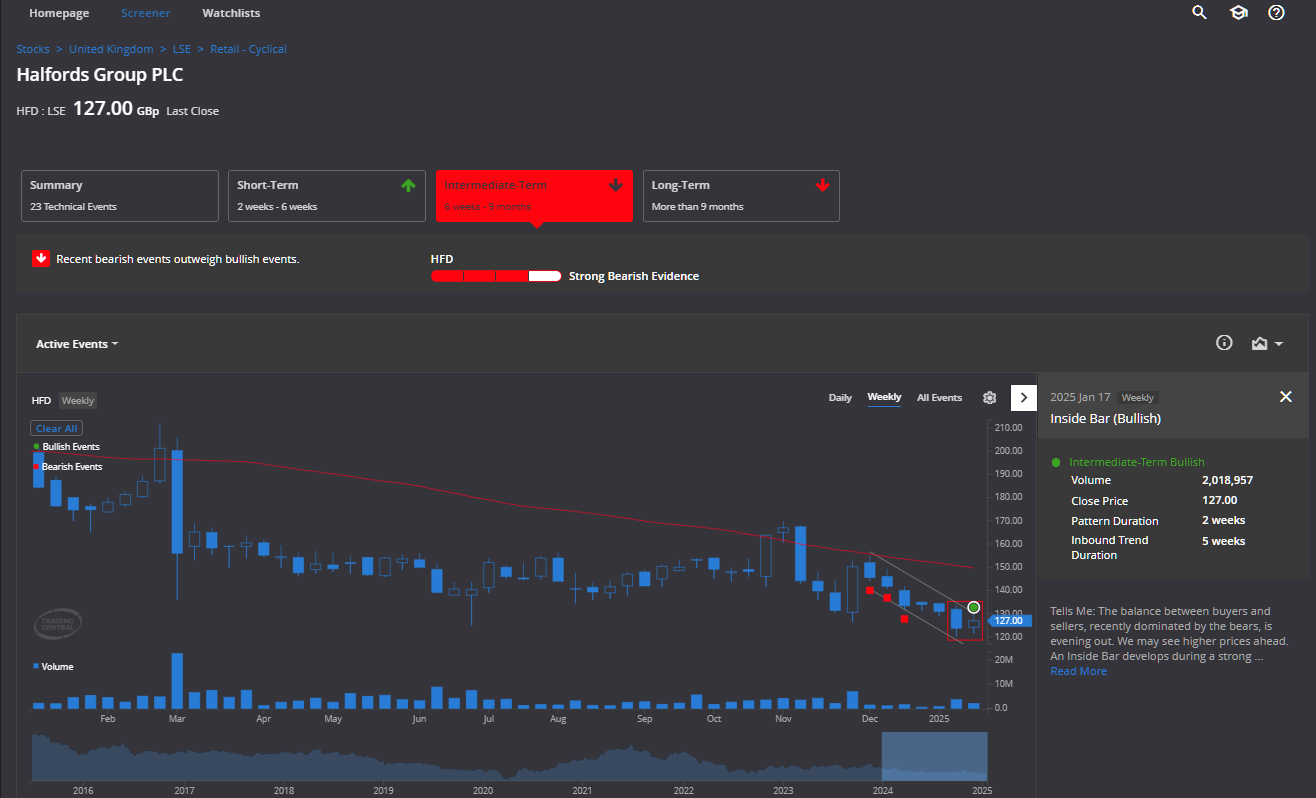
In the screenshot above, the screener highlights both past and current technical events on the chart, including candlestick patterns like the hammer. It also provides sentiment data and key support and resistance price levels.
You can easily access this screener by creating an Admirals Dashboard account in just a few simple steps.

Conclusion
The hammer candlestick pattern provides valuable insights into market behaviour and psychology. It features a small body with a long lower shadow, or wick, but a relatively small upper wick. The pattern indicates a fierce battle between buyers and sellers that ultimately ends with buyers closing out towards the upper wick - a bullish condition. The pattern can help identify bullish trend continuation and bullish trend reversal situations.
For higher probability - as there are no certainties in the market - traders will often utilise other technical analysis indicators, such as indicators and support levels for more confluence. However, it is effective risk management which will be key to navigating both wins and losses.
A common challenge for traders is finding the time to spot candlestick patterns across the wide array of UK stocks, indices, and currencies. This is where the Admirals Premium Analytics Screener can help, as it scans thousands of global stocks to identify all types of candlestick patterns, and other technical analysis events, for you.
Open a trading account to try out the screener, and practice your skills with a free demo account until you're ready to go live.

INFORMATION ABOUT ANALYTICAL MATERIALS:
The given data provides additional information regarding all analysis, estimates, prognosis, forecasts, market reviews, weekly outlooks or other similar assessments or information (hereinafter “Analysis”) published on the websites of Admirals' investment firms operating under the Admirals trademark (hereinafter “Admirals”). Before making any investment decisions, please pay close attention to the following:
1. This is a marketing communication. The content is published for informative purposes only and is in no way to be construed as investment advice or recommendation. It has not been prepared in accordance with legal requirements designed to promote the independence of investment research, and that it is not subject to any prohibition on dealing ahead of the dissemination of investment research.
2. Any investment decision is made by each client alone whereas Admirals shall not be responsible for any loss or damage arising from any such decision, whether or not based on the content.
3. With view to protecting the interests of our clients and the objectivity of the Analysis, Admirals has established relevant internal procedures for prevention and management of conflicts of interest.
4. The Analysis is prepared by an analyst (hereinafter “Author”). The Author, Jitanchandra Solanki, is an employee of Admirals. This content is a marketing communication and does not constitute independent financial research.
5. Whilst every reasonable effort is taken to ensure that all sources of the content are reliable and that all information is presented, as much as possible, in an understandable, timely, precise and complete manner, Admirals does not guarantee the accuracy or completeness of any information contained within the Analysis.
6. Any kind of past or modeled performance of financial instruments indicated within the content should not be construed as an express or implied promise, guarantee or implication by Admirals for any future performance. The value of the financial instrument may both increase and decrease, and the preservation of the asset value is not guaranteed.
7. Leveraged products (including contracts for difference) are speculative in nature and may result in losses or profit. Before you start trading, please ensure that you fully understand the risks involved.