The Hanging Man Candlestick Pattern
On a price chart, candlestick patterns exhibit information about how an asset’s price has behaved during a trading session. Over time, patterns emerge which can be used by traders to find trading opportunities in the market. The hanging man is an example of one of these patterns.
In this article, we will take an in-depth look at the hanging man pattern – explaining how to identify it, interpret it and trade it. Keep reading to find out more!
| The information in this article is provided for educational purposes only and does not constitute financial advice. Consult a financial advisor before making investment decisions. |
Table of Contents
Main Conclusions
- The hanging man is a single candlestick pattern which appears in an uptrend.
- It is identified by a small candlestick body, a long lower wick and either a short upper wick or none at all.
- It is interpreted by some traders as a signal of a bearish reversal.
- Whilst its appearance may provide a trading opportunity, traders should seek additional confirmation of a price reversal before entering the market.
Understanding the Hanging Man Pattern
Candlestick patterns are used by traders to predict future price movements and, consequently, identify trading opportunities. The hanging man is one such candlestick pattern which consists of a single candle and signals a potential bearish reversal.
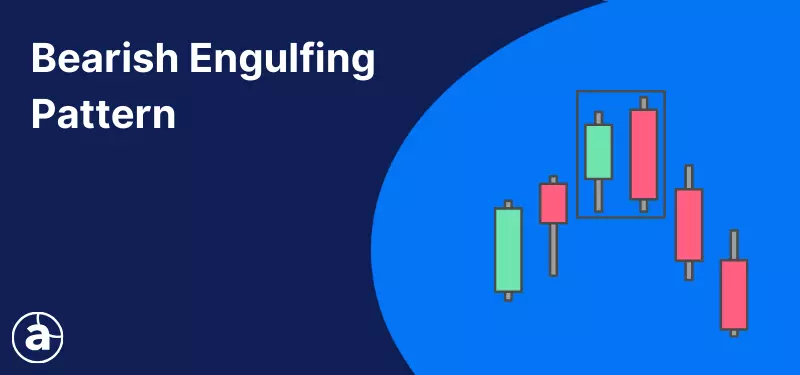
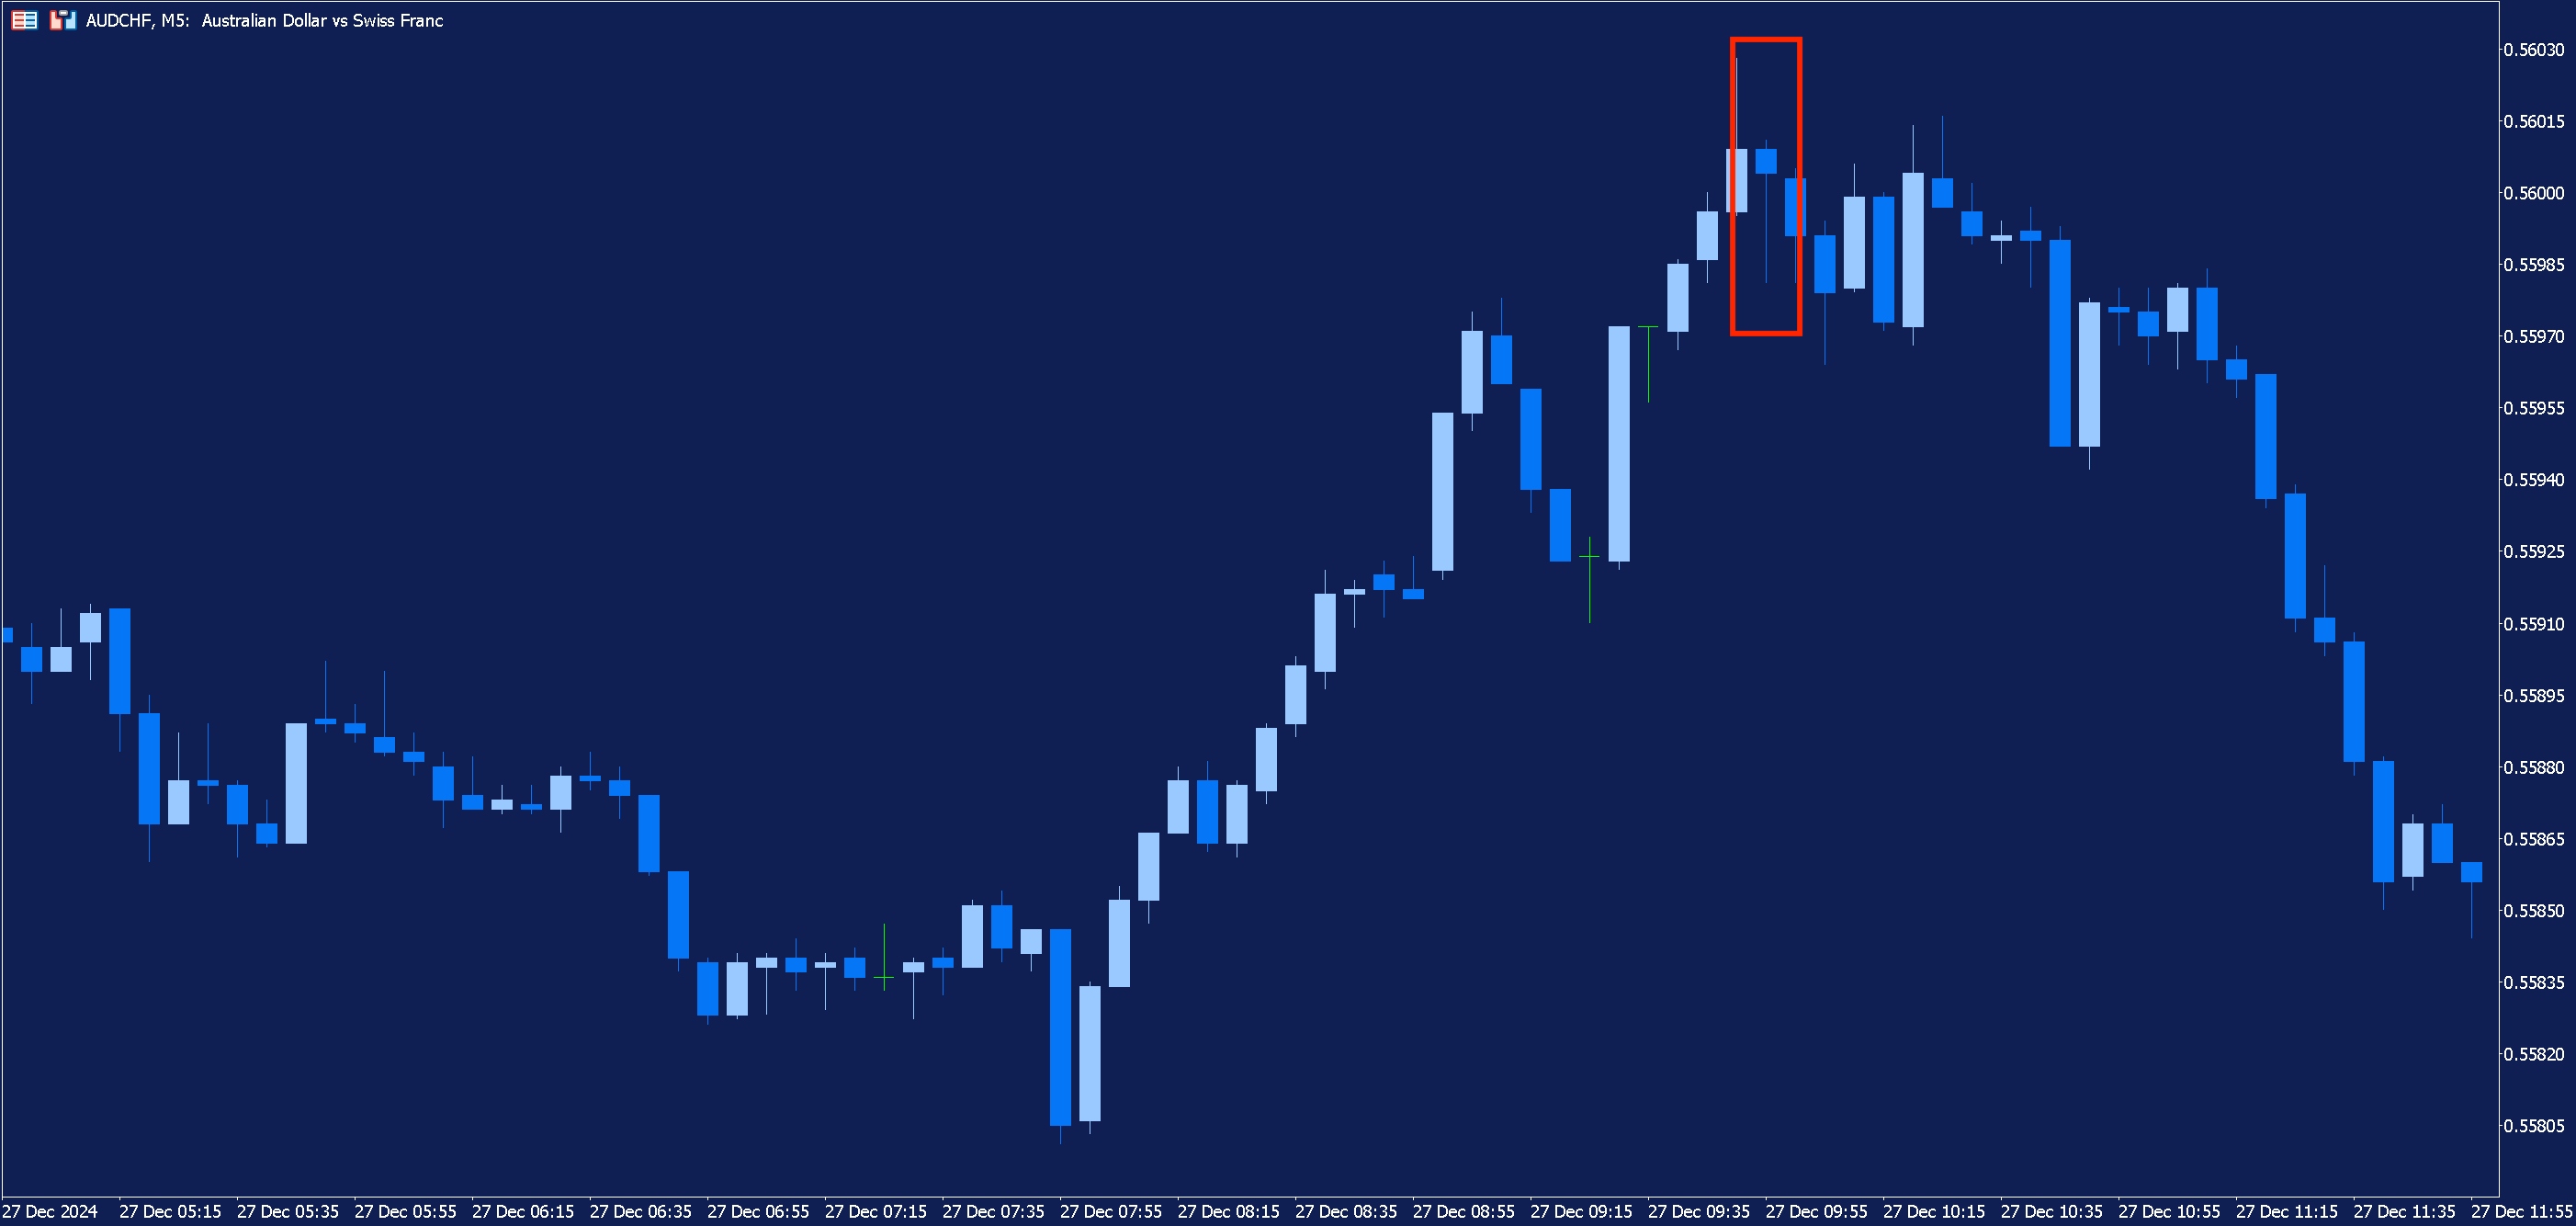
It appears in an uptrend and can be identified by a small body with a long lower wick and a short, or no, upper wick. The candle can either be green (bullish) or red (bearish), as in the image below.

Want to master more candlestick patterns and other trading related topics? Explore our free educational resources today!

Identifying and Interpreting the Hanging Man Pattern
On a price chart, each candlestick is an illustration of how buyers and sellers have interacted during the session in question. A bullish candle indicates that buyers have dominated the session, whereas a bearish candle signals its sellers that had the upper hand.
Despite the preceding uptrend, the long lower wick of the hanging man indicates that there has been strong selling pressure during the session in question, forcing the intraday price down.
However, despite the downwards pressure, buyers managed to take back control and push price back up towards the opening. Nevertheless, the strong selling pressure which occurred during the session can be interpreted as a sign that buyers are running out of steam, and that sellers may be about to take control.
Implications for Future Price Movements
Consequently, the hanging man candlestick pattern is interpreted by many traders as a bearish reversal pattern. In other words, its appearance serves as a signal that price may be about to begin a downwards movement.
Because it is a bearish reversal pattern, there needs to have been a noticeable upward movement in price prior to the pattern for it to be considered valid.
Trading the Hanging Man Candlestick Pattern
The appearance of the hanging man candlestick might present traders with an opportunity to take advantage of a downward movement in price. Let's take a look at how a trader could go about trading the pattern.
Entry and Exit
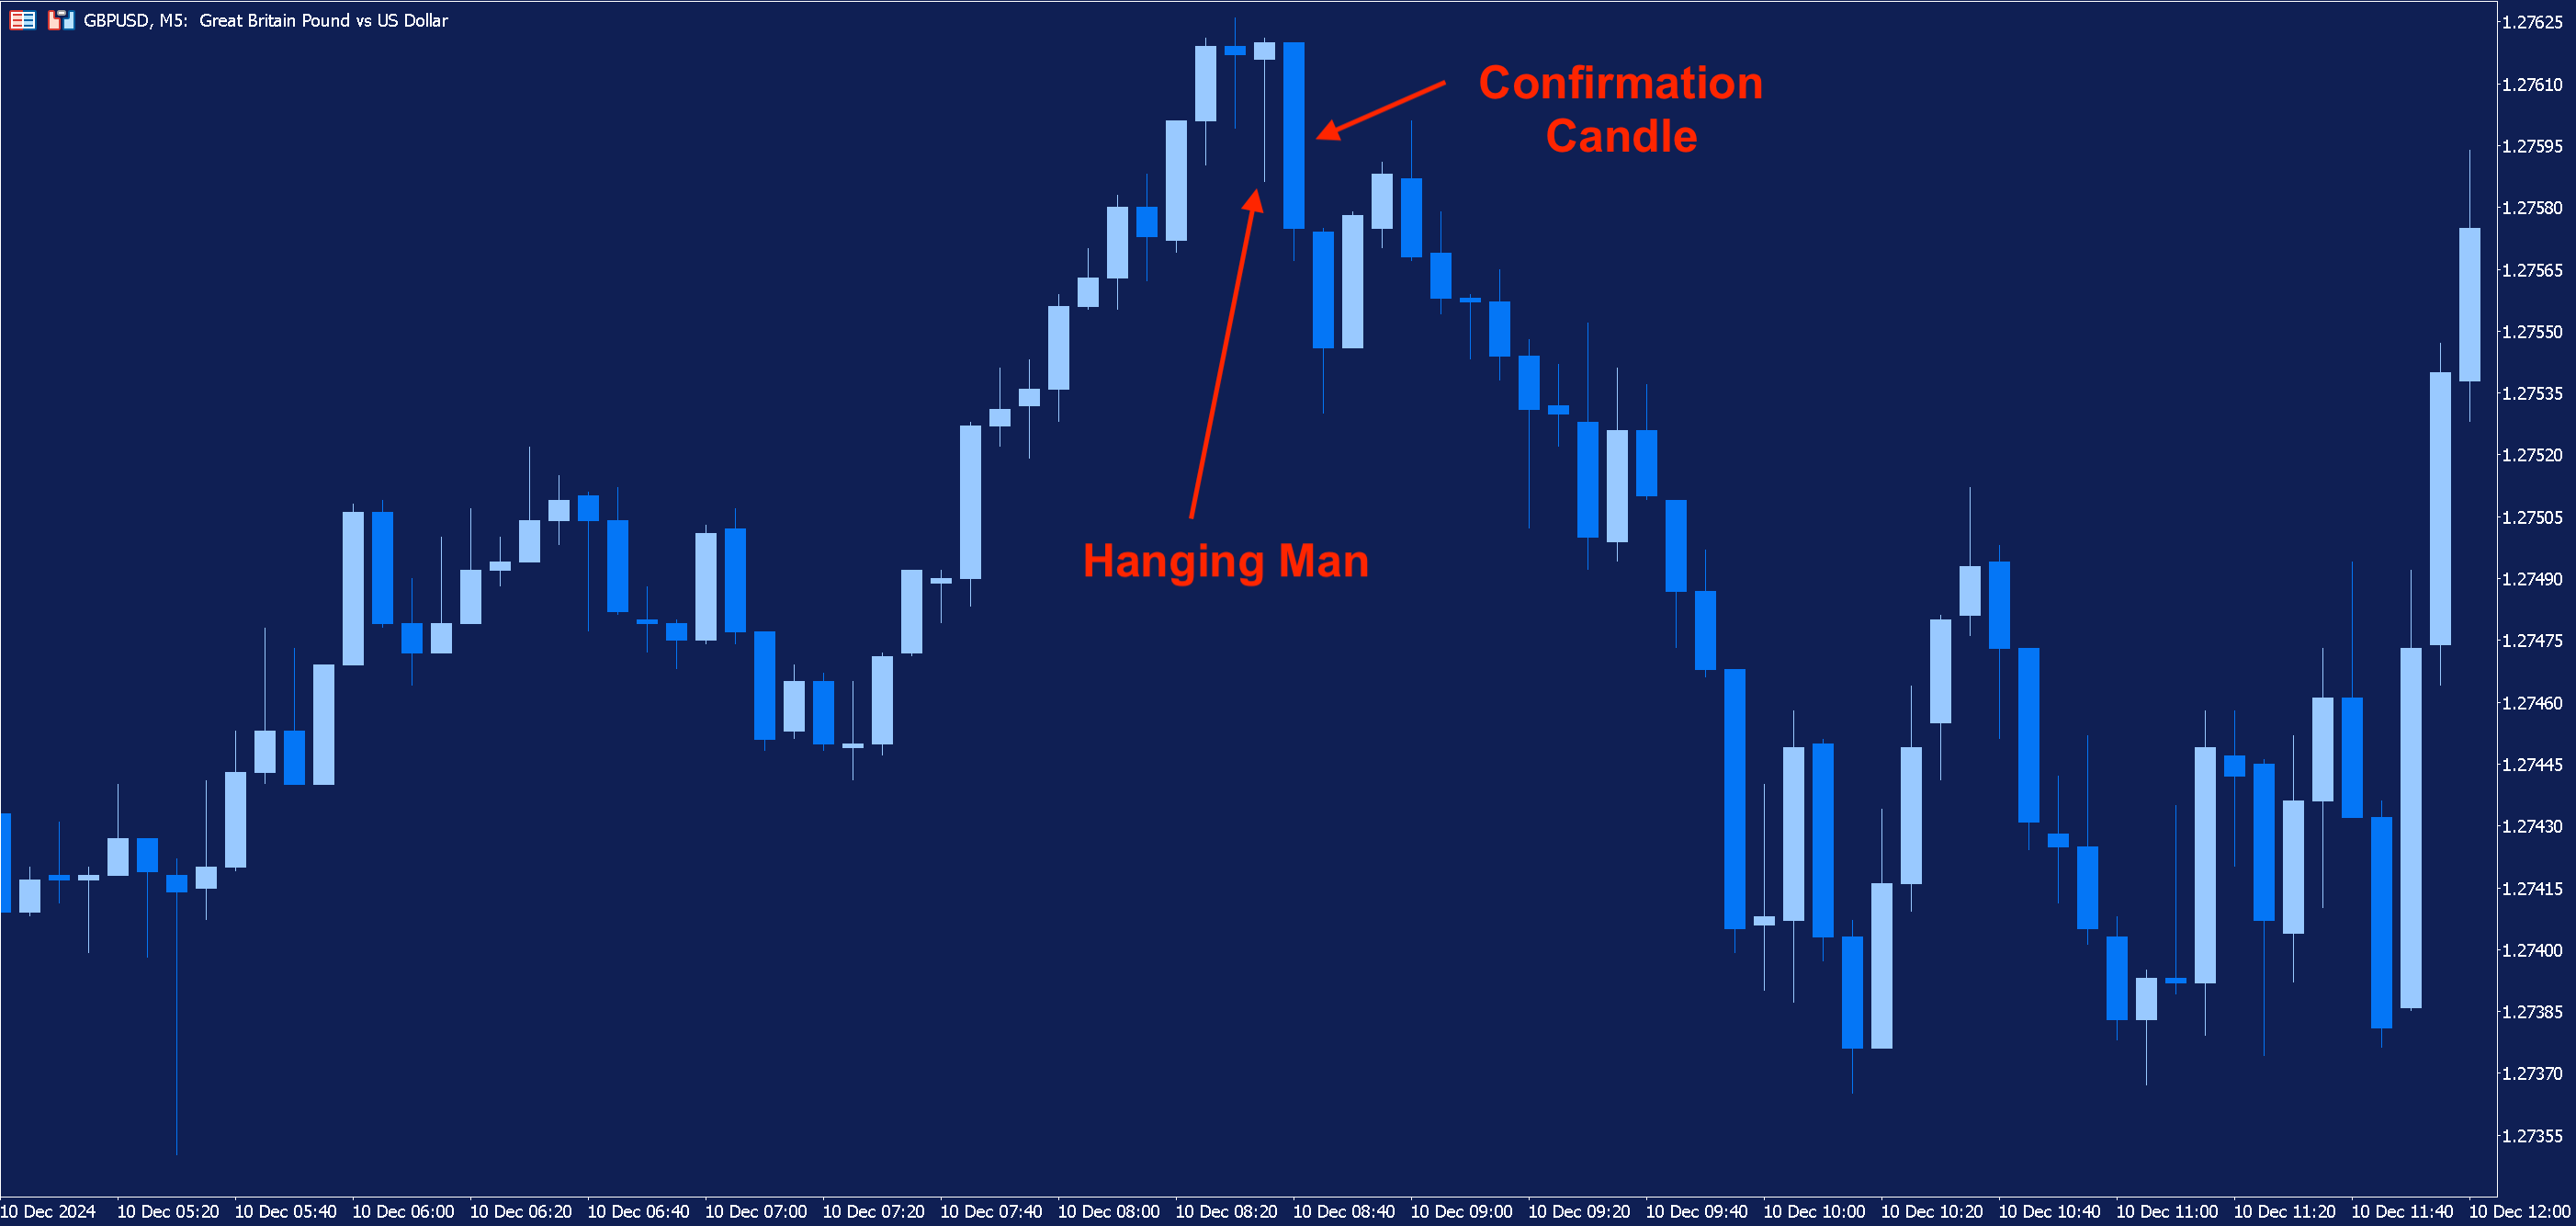
After the hanging man appears, a trader may choose to enter a short position as soon as the session closes. However, its appearance alone is not typically considered sufficient for making trading decisions.
A more conservative approach would be to wait for confirmation of the downward movement by seeing what happens in the following session. In this instance, a trader might choose to initiate a short position after the following session has ended, provided the session ends lower.
In either case, a stop-loss can be placed above the hanging man candlestick in order to mitigate losses if the market unexpectedly resumes its upwards trajectory.
The hanging man pattern itself doesn’t provide a specific profit target, which is perhaps one of its limitations. Therefore, traders might use other tools such as Fibonacci retracement levels to identify a price target. Otherwise, traders may choose to monitor their position and look for signs that the downwards move may be coming to an end.
Technical Indicators and Confirmation
Instead of, or in addition to, waiting for a confirmation candle after the hanging man has appeared, traders may choose to use other technical analysis tools to find further evidence of a reversal.
One way of doing this is by using technical indicators such as the Relative Strength Index (RSI), the Moving Average Convergence Divergence Indicator (MACD) and the Commodity Channel Index (CCI).
Below is the same GBPUSD chart highlighted in the previous section except, this time, we have added the CCI indicator.
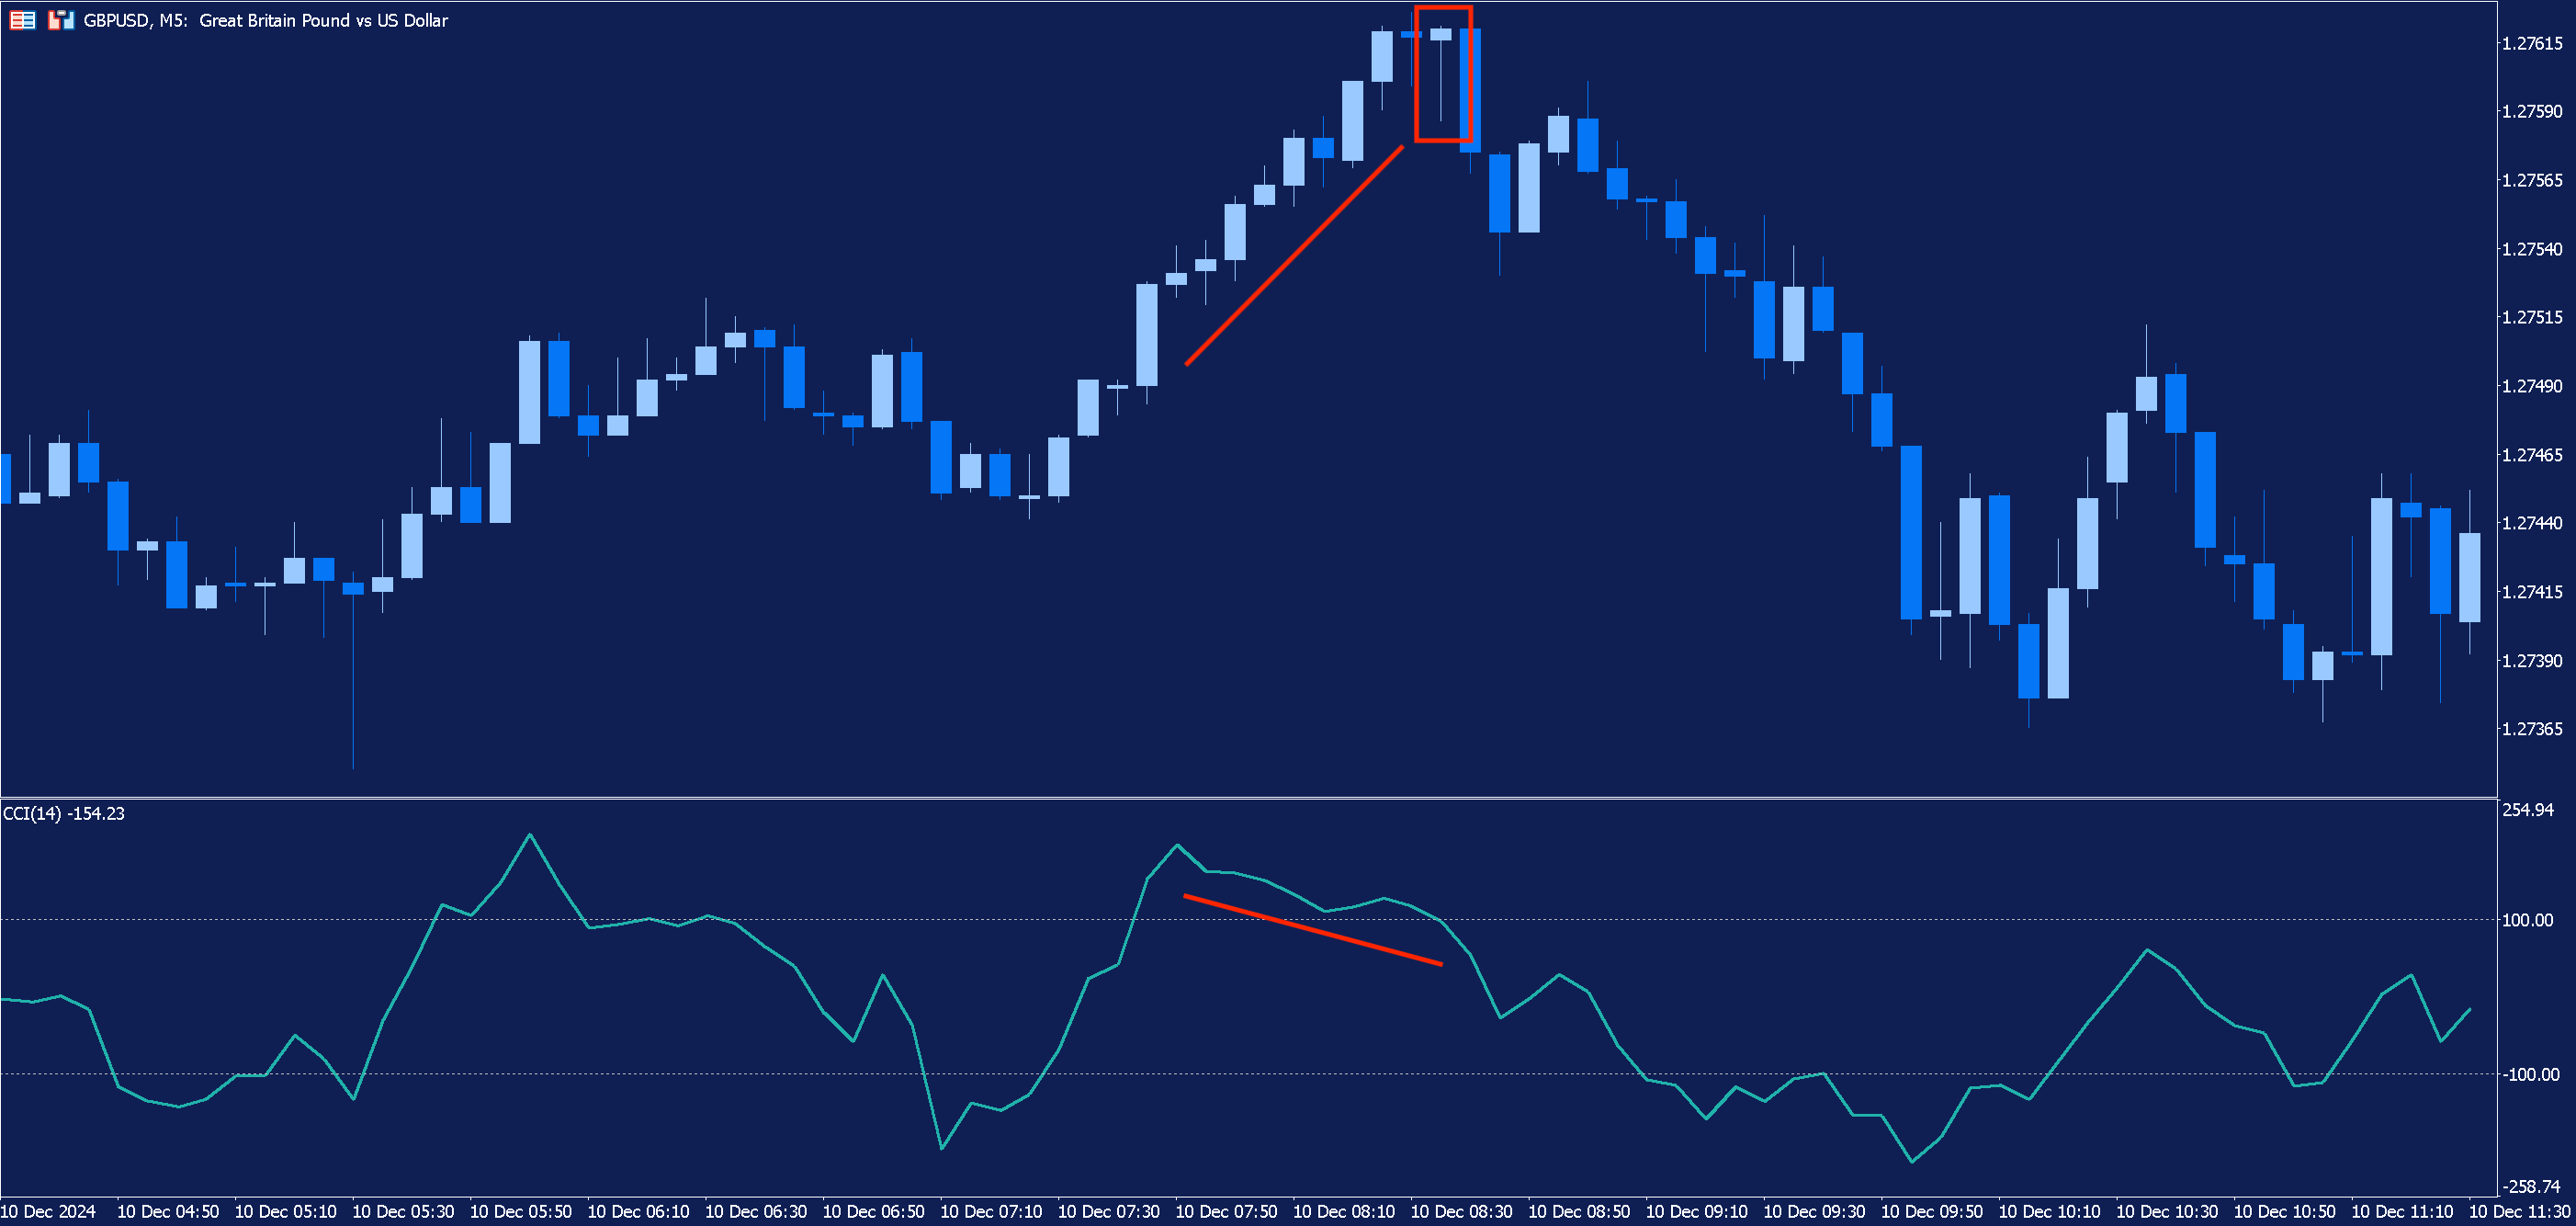
Before the hanging man appears on the chart, we can observe a clear upward trend in price. However, look at the CCI indicator.
Whilst price is still moving upwards, the CCI indicator begins to descend. This is what is known as divergence and is a signal that price may be about to change direction. Sure enough, following the divergence, the hanging man appears and price reverses to the downside.
Risk Management
Although the hanging man candlestick is interpreted by some traders as a signal of a bearish reversal, trading decisions based on its appearance alone are likely to lead to many false signals.
Traders can attempt to filter out these false signals by seeking additional confirmation by using technical indicators. However, even this additional confirmation will not result in successful trades every time.
That’s why it is always important to exercise proper risk management when trading. Don’t risk too much on any one trade and use a stop-loss to help limit your downside. As mentioned earlier, when trading the hanging man candlestick pattern, a stop-loss can be placed above the high of the hanging man.
Trade on a Risk-Free Demo Account
Ready to practise your trading skills? Open a free demo account with Admirals today:

Conclusion
The hanging man pattern is a single candlestick pattern which is considered to be a signal of a bearish reversal. However, its appearance alone is not sufficient for making trading decisions; traders should seek additional confirmation of a reversal prior to entering the market. Further confirmation can be obtained by using other technical analysis tools, such as the CCI indicator, which we examined in this article
The hanging man is just one example of the many candlestick patterns which occur on price charts, and which can give traders a clue of where price might be heading next. If you're interested in finding out about other candlestick patterns and more about trading in general, check out our other educational articles.
Trade with Admirals
With a Trade.MT5 account from Admirals, you can trade Contracts for Difference (CFDs) on a variety of assets including Forex, stocks and commodities. Find out more about trading with Admirals by clicking the banner below:

INFORMATION ABOUT ANALYTICAL MATERIALS:
The given data provides additional information regarding all analysis, estimates, prognosis, forecasts, market reviews, weekly outlooks or other similar assessments or information (hereinafter “Analysis”) published on the websites of Admirals' investment firms operating under the Admirals trademark (hereinafter “Admirals”). Before making any investment decisions please pay close attention to the following:
- This is a marketing communication. The content is published for informative purposes only and is in no way to be construed as investment advice or recommendation. It has not been prepared in accordance with legal requirements designed to promote the independence of investment research, and that it is not subject to any prohibition on dealing ahead of the dissemination of investment research.
- Any investment decision is made by each client alone whereas Admirals shall not be responsible for any loss or damage arising from any such decision, whether or not based on the content.
- With view to protecting the interests of our clients and the objectivity of the Analysis, Admirals has established relevant internal procedures for prevention and management of conflicts of interest.
- The Analysis is prepared by an analyst (hereinafter “Author”). The Author, Roberto Rivero, is a contractor for Admirals. This content is a marketing communication and does not constitute independent financial research."
- Whilst every reasonable effort is taken to ensure that all sources of the content are reliable and that all information is presented, as much as possible, in an understandable, timely, precise and complete manner, Admirals does not guarantee the accuracy or completeness of any information contained within the Analysis.
- Any kind of past or modeled performance of financial instruments indicated within the content should not be construed as an express or implied promise, guarantee or implication by Admirals for any future performance. The value of the financial instrument may both increase and decrease and the preservation of the asset value is not guaranteed.
- Leveraged products, including Contracts for Difference (CFDs) are speculative in nature and may result in losses or profit. Before you start trading, please ensure that you fully understand the risks involved.