How to Use the CCI Indicator
Don't let the name fool you, although it was originally developed with commodities in mind, the Commodity Channel Index (CCI) indicator can be used in a range of markets to help identify overbought or oversold levels in an asset.
In this article, we will examine the CCI indicator, explain what it is, demonstrate how it is calculated using the indicator formula and much more!
Table of Contents
What Is CCI Indicator?
The CCI indicator is an oscillator that measures an asset’s current price in relation to its average price over a predetermined period of time. At its simplest, this allows us to judge whether bullish or bearish forces are currently in the driving seat.
The Commodity Channel Index oscillates either side of a zero centreline. When the CCI is above zero, it indicates that an asset’s price is higher than the historic average and vice versa.
Traders can use this information to spot new trends, detect overbought and oversold levels and also identify potential reversals when there is divergence between the indicator and the price.
How to Calculate the Commodity Channel Index
The calculation method highlighted below is the original CCI indicator formula detailed by its creator Donald R Lambert in 1980.
| CCI = (Typical Price - Moving Average) / (0.015 x Mean Deviation) |
First and foremost, you need to determine how many periods the CCI indicator will look at. Although in the original methodology the number of periods analysed was 20, the default value for the CCI indicator settings in both MetaTrader 4 (MT4) and MetaTrader 5 (MT5) is 14.
Next, a typical price needs to be defined. This can be arrived at by calculating the mean average of the high, low and closing prices for the predetermined number of periods. Then, calculate a moving average of the typical price.
The third step is to calculate the mean deviation from the moving average. This can be found by subtracting the moving average from the typical price over each period. Add up the absolute values (ignore any negative signs) of the results and divide this sum by the number of periods being analysed.
Substituting the most recent typical price, the moving average and the mean deviation into the CCI indicator formula above, you can calculate the Commodity Channel Index, repeating the process as many times as is necessary.
If that seems complicated, don’t worry! Although knowing how to calculate the Commodity Channel Index can help you to better understand the indicator, fortunately, you don’t have to actually do the calculations yourself! MT4 and MT5 trading platforms take care of the heavy lifting for you.
How to Use CCI Indicator MT4 & MT5
You can find the CCI indicator in both MetaTrader 4 and MetaTrader 5 by looking in the 'Oscillators' folder in the 'Navigator' tab on the left-hand side of the screen. Double click on Commodity Channel Index to open a dialogue box showing the CCI indicator settings.
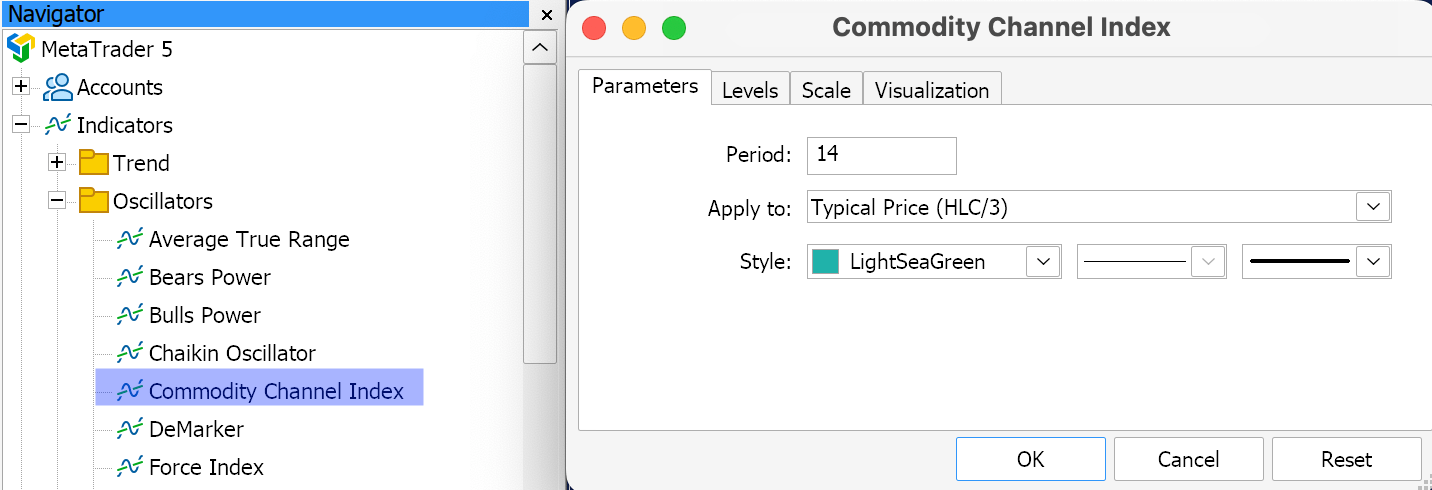
The dialogue box in the image above shows the default CCI indicator settings for the MetaTrader trading platforms of 14 periods applied to the typical price. In the image below, we have applied the CCI to an hourly chart of GBPUSD using these default settings.
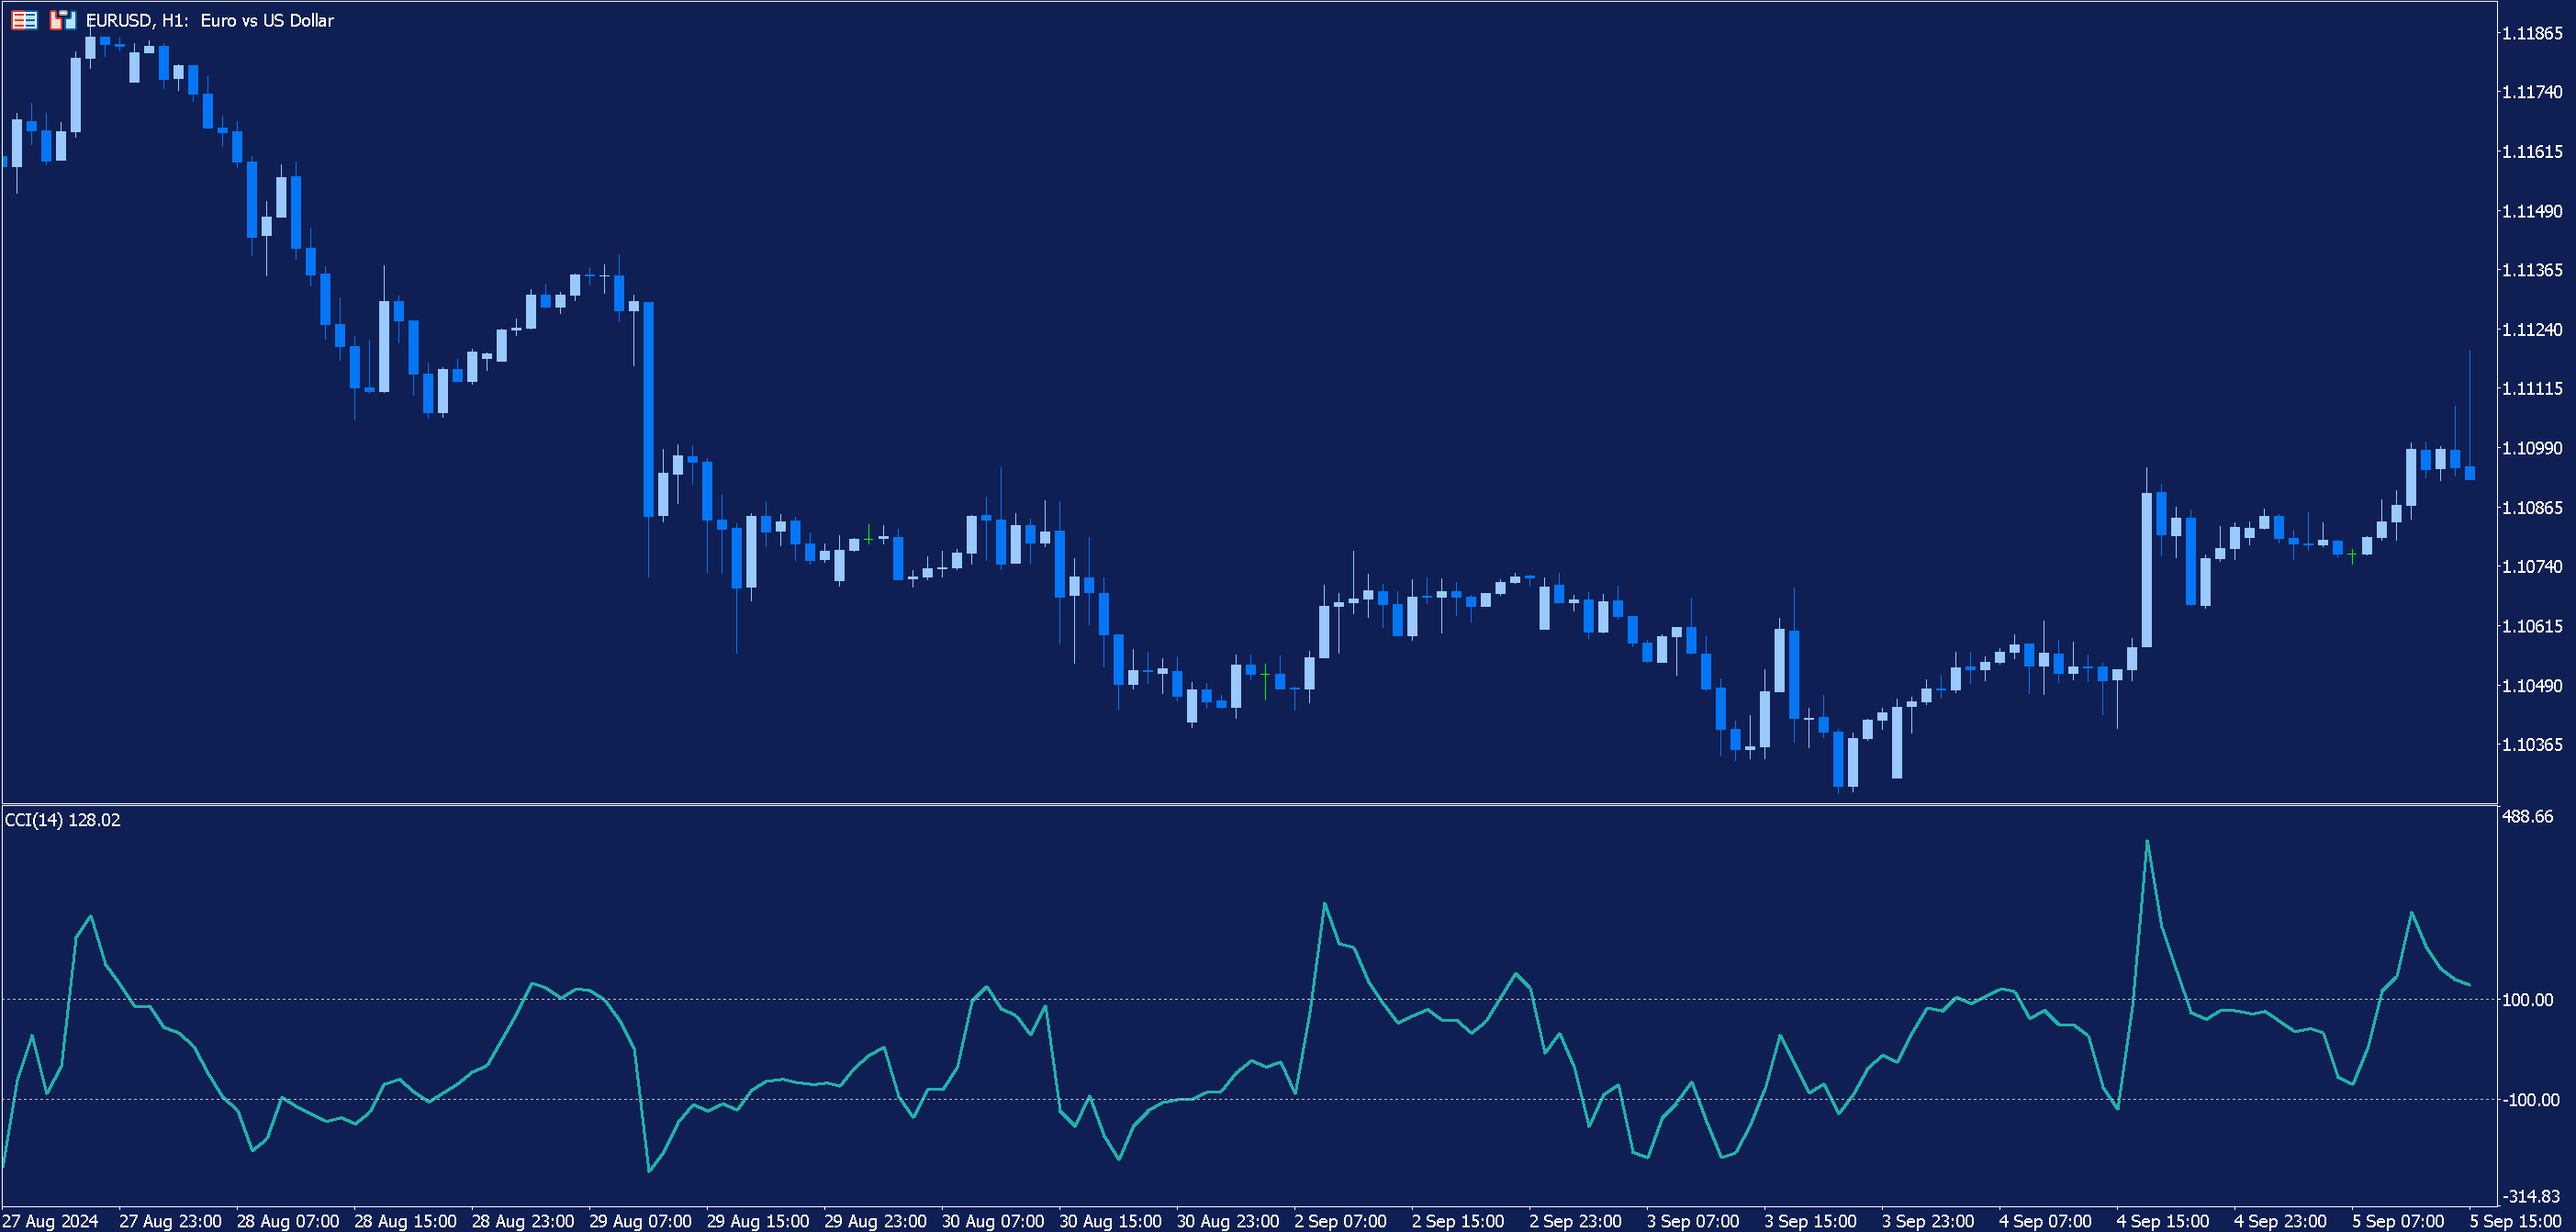
Of course, you can choose to alter the default settings when trading with the CCI indicator. One way is to change the length of the number of periods, which is a critical factor when using the indicator.
As we stated above, although CCI creator Donald Lambert's original standard length was for 20 periods, MT4 and MT5 set the default number of periods as 14. The lower the period, the more jagged the indicator will become, breaking the key +100 and -100 levels with more frequency. The opposite is also true.
Which are the CCI indicator best settings? That will depend on the trader in question and the strategy which they are implementing. With any indicator, it’s typically best to start with the default settings and experiment to see what suits your style and strategy best.
A risk-free demo trading account from Admirals allows you to trade using virtual currency in realistic market conditions, making it an ideal place to experiment with different CCI indicator settings. Click the banner below to open a demo account today:

Commodity Channel Index Strategy
If we look at how the CCI indicator is calculated, its function is to inform us how an instrument’s current price compares to its average. When the CCI is higher than zero, it indicates that price is above the historic average. On the other hand, when the indicator falls below zero, it indicates that price is lower than the historic average.
How far above or below zero the indicator reaches can highlight the strength or weakness in a current price movement.
A very simple commodity channel index strategy might be to take a long position in the market when the indicator crosses above +100, closing the position once the indicator crosses back below that threshold. When the indicator crosses below -100, this could be interpreted as a signal to short the asset, again, closing the position once the indicator crosses back above this level.
However, besides a simple system along the lines above, there are a couple of other methods in which traders can incorporate the Commodity Channel Index into their trading strategies.
Overbought/Oversold
The CCI indicator can be used by traders to identify overbought or oversold levels in an asset.
When an asset is trading at an overbought or oversold level – in other words, a level which is considered too high or too low – it is often interpreted that a potential reversal in price is imminent.
However, using the CCI oscillator in this manner can be a bit complicated. Unlike some other oscillators, the Commodity Channel Index is unbound, meaning there are no upside or downside limits.
This means that determining what constitutes overbought or oversold levels using the CCI indicator is subjective. Some may consider anything above +100 and below -100 to be overbought and oversold respectively. For others, +/- 200 may be considered a more accurate reflection.
Furthermore, considering that the indicator measures how far price is straying from its historic average, overbought and oversold conditions will also depend on the volatility of the asset in question.
Bullish/Bearish Divergence
Another method of trading with the Commodity Channel Index is using the CCI indicator to identify bullish and bearish divergences, which can indicate a potential price reversal is imminent.
Divergences occur when an asset’s price and the indicator are moving in opposite directions. A bullish divergence can be identified when an asset’s price is making lower lows, but the CCI indicator is making higher lows. Conversely, bearish divergence occurs when price is making higher highs but the CCI trading indicator is making lower highs.
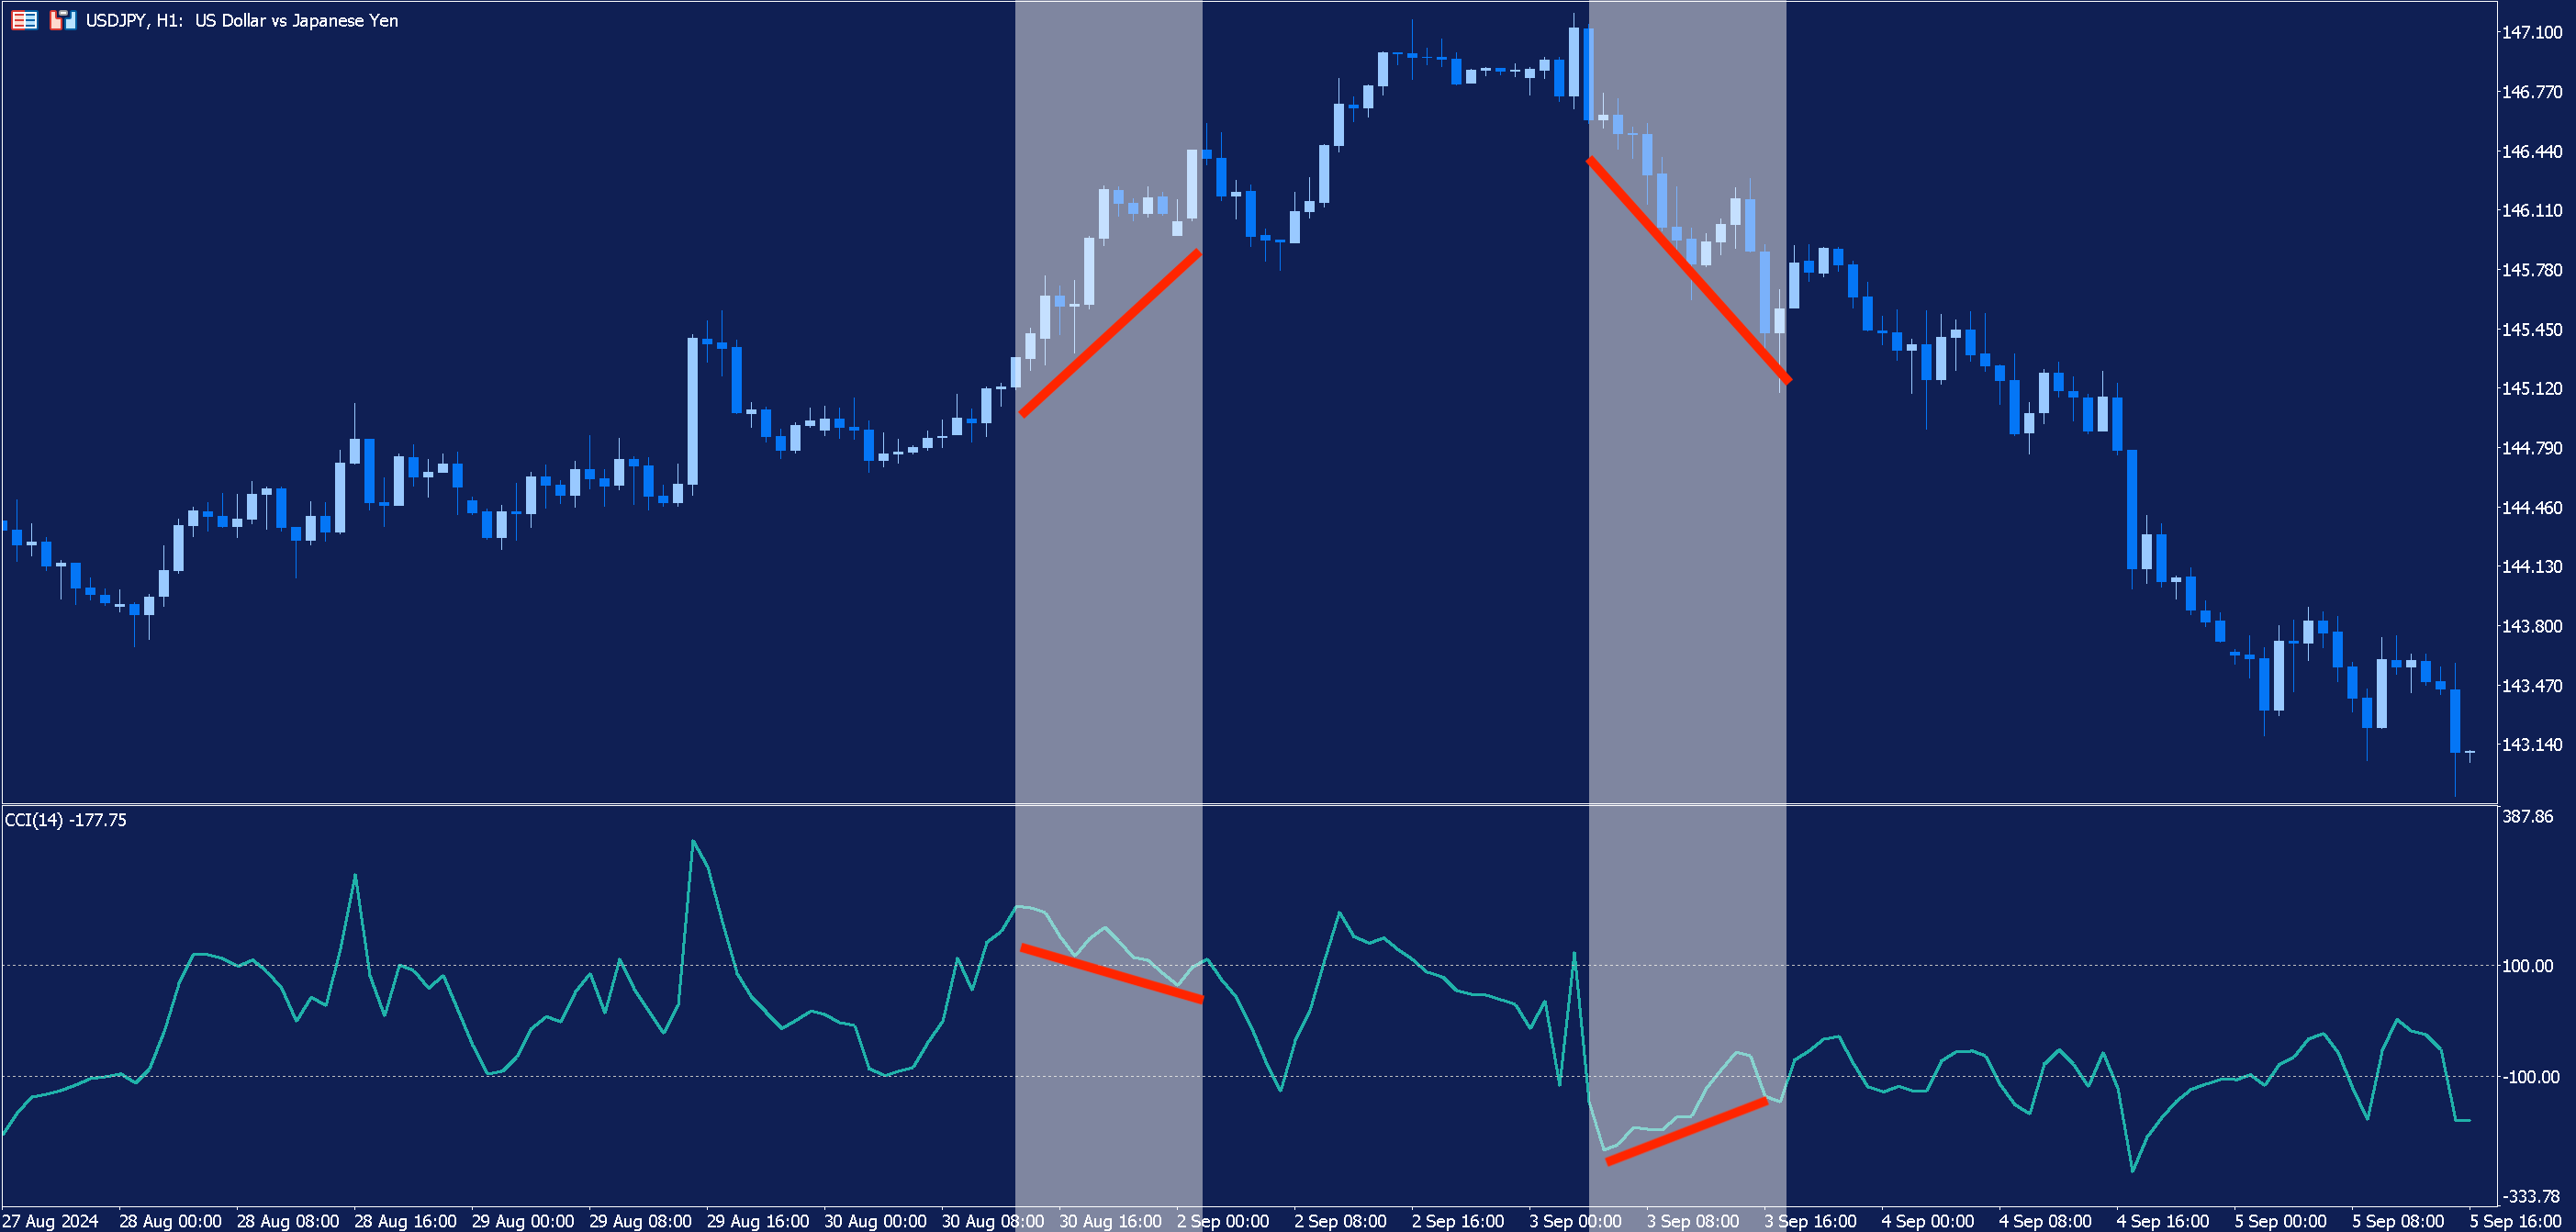
The chart above highlights two examples of divergence with the Commodity Channel Index, one bullish and one bearish.
Nevertheless, as is evidenced above, not all instances of divergence result in a price reversal. When using the CCI indicator to spot divergences, or to identify overbought and oversold levels, it can improve the quality of signals by using other technical indicators by way of confirmation.
Forex Trading with Admirals
If you feel ready to take your trading to the next level and perhaps even implement a Commodity Channel Index strategy on the live markets, the Trade.MT5 account from Admirals could be just what you are looking for.
With Admirals, you can trade Contracts for Difference (CFDs) on more than 80 currency pairs as well as on a range of other markets. Click the banner below to find out more:

FAQ
What is the best setting for CCI?
It is possible to change the CCI indicator settings to apply the indicator over different timeframes. What constitutes the CCI indicator best settings will depend largely on the trader in question and their trading strategy.
What is the difference between RSI and Commodity Channel Index?
Although both indicators are oscillators, they are calculated in different ways and measure different things. Whilst the RSI measures the speed and magnitude of price movements by comparing average gains and losses, the CCI indicator measures current price relative to the average price over a given period of time.
Find more interesting articles:
- Forex Currency Strength Meter
- Five Free Forex Indicators Every Trader Should Know
- Overview of the Best Metatrader Indicators
About Admirals
Admirals is a multi-award winning, globally regulated Forex and CFD broker, offering trading on over 8,000 financial instruments via the world's most popular trading platforms: MetaTrader 4 and MetaTrader 5. Start trading today!
This material does not contain and should not be construed as containing investment advice, investment recommendations, an offer of or solicitation for any transactions in financial instruments. Please note that such trading analysis is not a reliable indicator for any current or future performance, as circumstances may change over time. Before making any investment decisions, you should seek advice from independent financial advisors to ensure you understand the risks.