Mastering the Forex Currency Strength Meter
One aspect that sets the forex market apart from others is the use of currency pairs. Each trade takes place by buying one currency and selling another, which means that the value of one currency is always seen through the lens of the other.
Consider the EURUSD pair, for instance. If its price increases in a day, is it due to:
- The strengthening euro?
- Weakening US dollar?
- Or a combination of both?
Yes, it's hard to say because both currencies are correlated, making it hard to analyse the strength of one currency independently.
That’s where a currency strength meter, also known as the forex currency strength indicator, can be useful.
In this guide, we will explore what a currency strength meter is, how it works, and how traders may make use of it.
The information in this article is provided for educational purposes only and does not constitute financial advice. Consult a financial advisor before making investment decisions.
Table of Contents
- What is a currency strength meter?
- How to read the strength meter
- How to interpret the strength readings
- What is a correlation matrix?
- Reading the correlation matrix at a glance
- Understanding correlation through examples
- Advantages of strength and correlation tools
- Limitations of strength and correlation tools
- How to get the most from strength and correlation data
- Finishing thoughts
- Frequently asked questions
What is a currency strength meter?
A currency strength meter is an indicator that tells us which currencies are strong and which ones are weak at any given moment.
It works by analysing the exchange rates of different currency pairs and giving each currency an overall score based on how it is performing.
For example, let’s say a trader wants to understand how strong the US dollar (USD) is at the moment. The meter will look at all currency pairs that include the USD, such as USDJPY, EURUSD, GBPUSD, and so on. It then combines the movements across these pairs to determine the overall result of the dollar’s strength.
This is how the currency strength indicator looks on the chart.
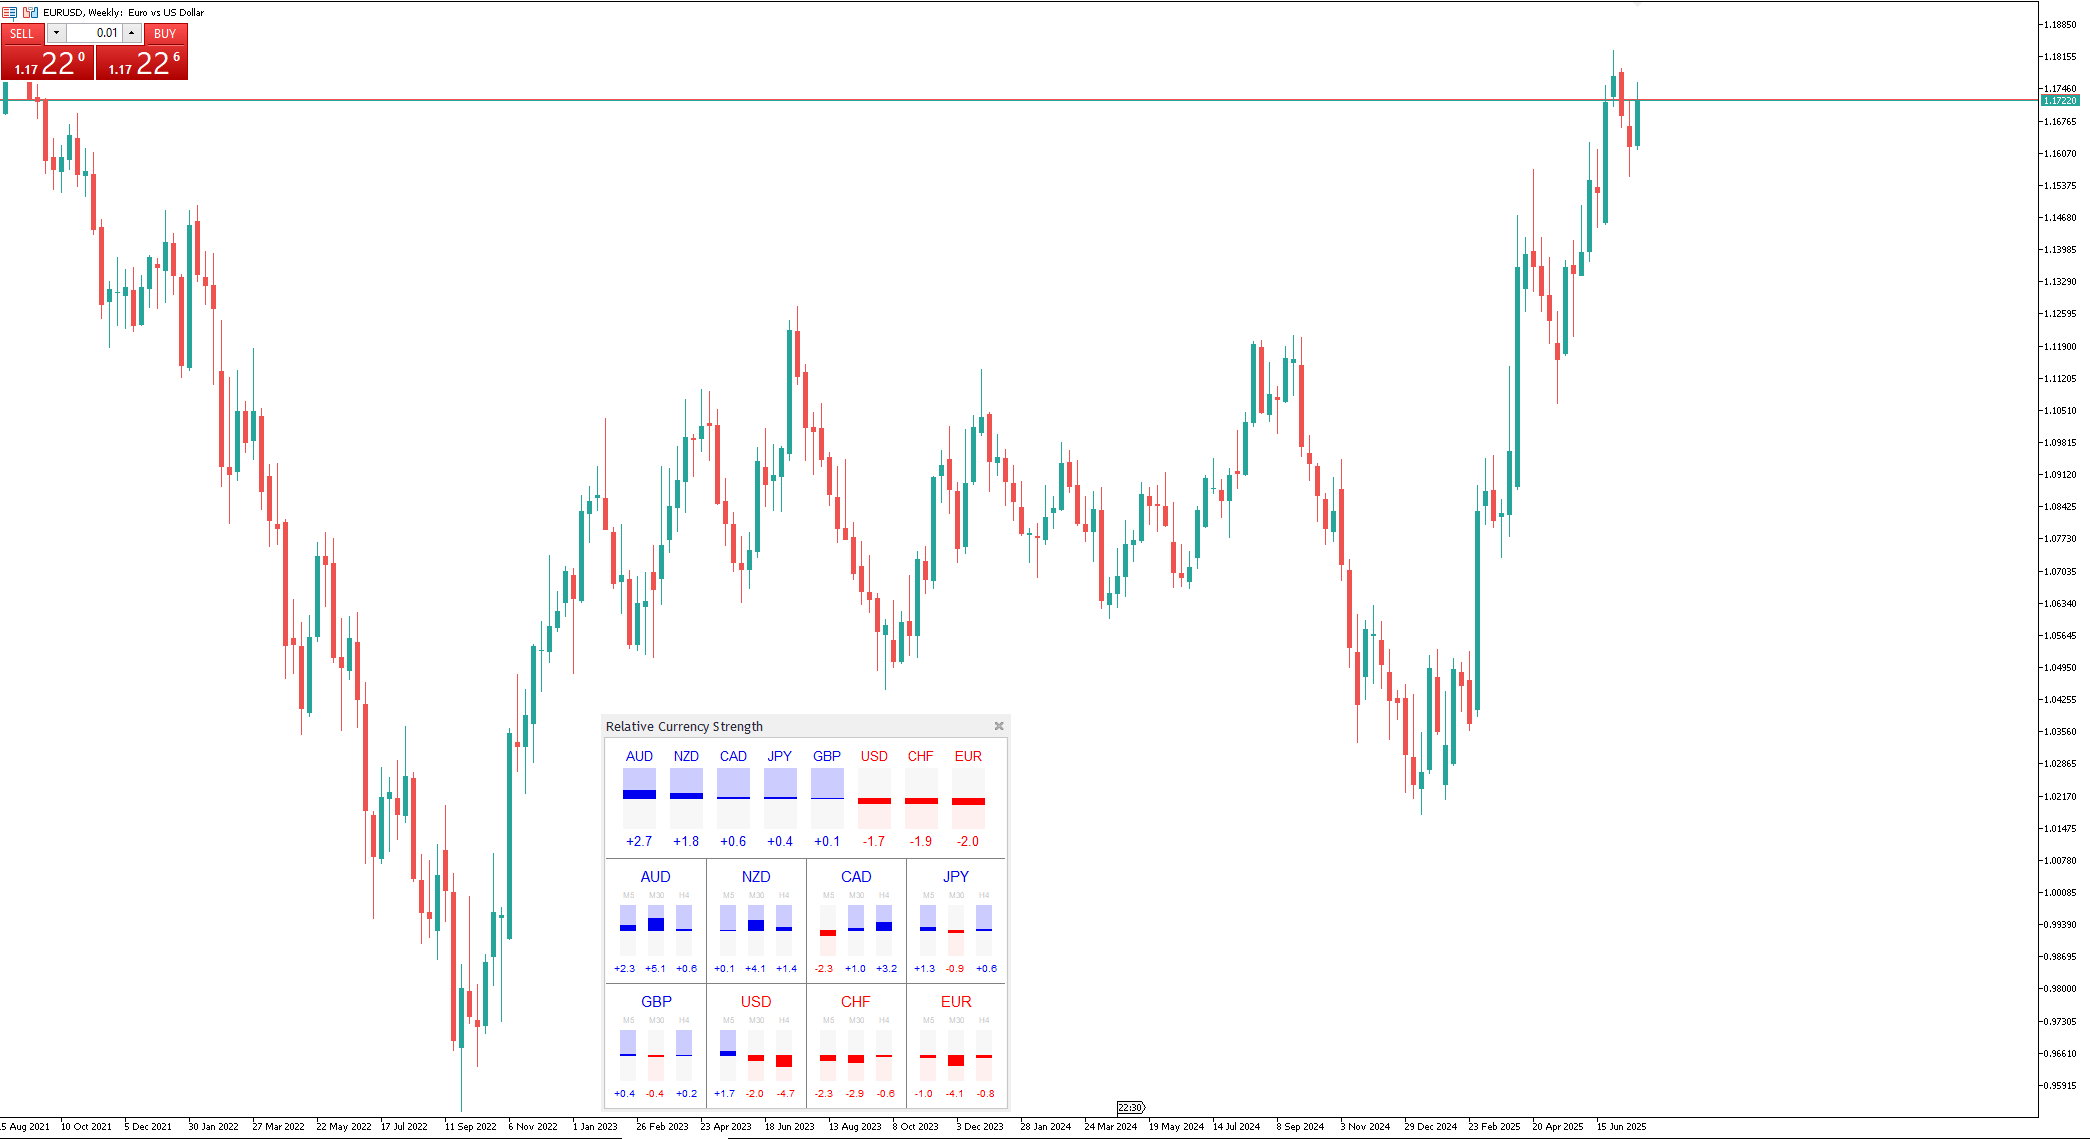
How to read the strength meter
At the bottom of the chart, you will find a grid titled Relative Currency Strength, displaying eight major currencies: AUD, NZD, CAD, JPY, GBP, USD, CHF, and EUR.
Every currency is presented in colour-coded bars and numerical values. Let’s decode what it means.
Colour indicators
- Blue: Relatively strong performance
- Red: Relatively weak performance
The length of each bar may reflect the degree of strength or weakness. The longer the bar, the more pronounced the reading may be.
Numerical values
Each currency shows a number (e.g., +2.7, –2.0) indicating its strength.
- Positive value: Relative strength
- Negative value: Relative weakness
Multiple timeframes
Each currency's relative strength is displayed in three timeframes with three coloured bars. In the chart above, this appears below the eight major currencies.
- 5-minute chart (M5): Immediate or short-term sentiment
- 30-minute chart (M30): Short-term trend
- 4-hour chart (H4): Medium-term momentum
How to interpret the strength readings
A currency strength meter could help traders in identifying comparatively strong and weak currencies. A common approach is to consider pairing a stronger currency with a weaker one. For example, if GBP appears strong and JPY weak, some traders might explore a long position on GBPJPY. That’s because the base currency (GBP) is gaining strength and the quote currency (JPY) is weakening. This typically causes the pair to move higher. However, outcomes can vary, and past strength does not guarantee future performance.
Traders sometimes monitor multiple time frames, too, like 4-hour, 30-minute and 5-minute strength. Because strength across multiple time frames can indicate a stronger or more reliable signal.
For instance, at the time of writing, in the above chart, the Australian Dollar (AUD) shows a strength of +6.1 on the 30-minute chart (M30), but only +2.3 on the 5-minute (M5). This may suggest that AUD experienced a strong surge, but the momentum is now beginning to taper off.
With that being said, a currency strength meter relies on recent price action and does not predict future performance. Many traders prefer to use it in addition to technical indicators like support and resistance levels, trend lines, or other methods to help confirm their trade ideas.
While a currency strength meter helps in identifying which currencies are leading or lagging, it does not reveal how currency pairs move in relation to other currency pairs. For that, traders often turn to another tool called the currency correlation matrix.
What is a correlation matrix?
A currency correlation matrix shows how different currency pairs move in relation to one another. It helps traders avoid taking on too much risk by placing similar or opposing trades.
The correlation value can be either positive or negative. It tells us whether currency pairs tend to move together, apart, or randomly.
To understand it better, let’s look at a correlation chart in the next section.
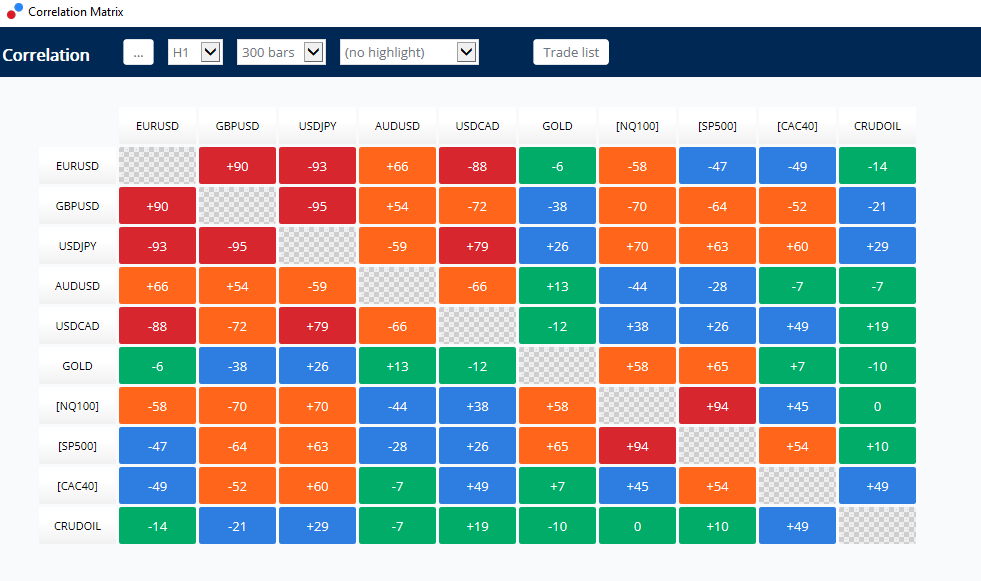
Reading the correlation matrix at a glance
A correlation matrix is not limited to currency pairs; it also includes commodities and indices that tend to move in relation to each other. Each box in the matrix contains a number between –100 and +100, representing the correlation strength between two instruments or currency pairs.
Once you understand what the correlation values and colours indicate, you can start interpreting potential relationships between currency pairs. Here is a table explaining what the values above mean.
Understanding correlation through examples
Let’s look at two examples of strong correlations, both highlighted in red boxes in the table. Please note that the following asset examples are for educational purposes only and do not constitute investment advice.
- EURUSD and USDJPY have a correlation of –93, which indicates a strong negative correlation. Practically, whenever EURUSD moves higher, USDJPY tends to go down, and vice versa.
Why is that so? Well, because it reflects the fact that the USD is the quote currency in the EURUSD but base currency in the USDJPY, so a change in the value of the US dollar may influence them in the opposite direction.
- Let’s look at the next currency pair, EURUSD and GBPUSD, which show a correlation of +90. This indicates a strong positive relationship, meaning these pairs often move in the same direction. Since both have the US dollar as the quote currency, a weakening dollar may contribute to both pairs moving higher.
- Lastly, USDJPY and AUDUSD have a correlation of -59, which is in the orange box and could indicate a moderate negative correlation. This means that the pairs occasionally move in opposite directions, but the correlation is not as strong as in the first two examples.
Advantages of strength and correlation tools
Here are a few advantages of using strength and correlation tools.
May assist traders in avoiding double exposure
Let’s say you open long positions on both EURUSD and GBPUSD. These currency pairs tend to move in the same direction due to the fact that both have USD as the quote currency. If the US dollar weakens, both EURUSD and GBPUSD may rise, resulting in potential gains on both trades. But if the dollar strengthens, both pairs may decline, leading to losses on both positions.
This is called double exposure, where similar trades add additional risk with no diversification. By looking at the correlation matrix, traders can detect such high correlations beforehand and think of modifying their position sizes or re-evaluating their trade selection.
May help prevent accidental hedging
When the correlation between currency pairs is known in advance, traders can make more thoughtful decisions and might even skip overlapping positions.
For example, if EURUSD and USDJPY are strongly negatively correlated, it means that they tend to move in the opposite direction. In such cases, opening long positions on both could result in gains from one long position being offset by losses in the other. By knowing these correlations beforehand, a trader can be aware of them.
Limitations of strength and correlation tools
While useful, these tools also have certain limitations that a trader should be aware of.
It is based on past data
While correlations do exist, it’s important to remember they can shift. Global economic conditions change with time, and so the correlation between two currency pairs can also evolve.
Complexity may reduce clarity
Too much focus on correlations or strength readings may cause hesitation or missed opportunities, especially if traders overcomplicate their decision-making process. To avoid this, many traders use these tools as part of a broader strategy.
How to get the most from strength and correlation data
Remember that correlations can shift over time, and historic performance will not be a reliable indicator of future correlations. However, this information can still support the development of a personal currency strength strategy and help reduce overexposure in a trading account.
Here are some commonly used practices:
Avoid positions that cancel each other out
If two currency pairs are moving in the opposite direction, having long positions in both may end up cancelling out any potential profit. Traders can try to minimise such overlap with a focused view.
Hedge exposure selectively
Some traders use pairs with strong negative correlations to attempt partial risk offsetting. The idea is that if one pair moves against the position, the other may move favourably. This may reduce losses, but not eliminate them, and the effectiveness depends on execution and market conditions.
Always consider the broader context
As with any technical indicator or tool, the correlation matrix and currency strength meter provide limited information. For more robust decision-making, many traders use these tools with broader analysis, while taking fundamental developments into consideration.
Finishing thoughts
Knowledge of currency strength and correlation can provide a trading edge, helping traders spot clearer setups and manage risk more effectively.
If you are considering using tools like a currency strength meter or correlation matrix, it is wise to start in a risk-free environment by opening a demo account with Admirals and installing the MetaTrader Supreme Edition plugin for free on your laptop. You can practice strategies, track correlations, and gain confidence, all without risking real capital.
Try it out on a free demo trading account. Click the banner below to get started.
Other articles that may interest you
- How to trade with Elliott Wave forex theory?
- How to use the forex market sentiment indicator?
- 3 pivot point forex trading strategies
Frequently asked questions
Can currency correlations change?
Yes, currency correlations do change over time. Economic changes, geopolitical events, and market sentiment may all influence how currency pairs move with respect to each other. That's why it's worth tracking correlations on a regular basis rather than relying on assumptions.
How can I use a currency strength meter in my trading strategy?
You may use a currency strength meter to find potential trade ideas by comparing strong currencies against weaker ones. Just remember, it is most effective when used as a supporting tool rather than on its own.
Is a currency strength meter reliable for all market conditions?
Not always. The meter reflects past price action, so it does not always reflect the immediate high-impact news events or sudden changes.
About Admirals
Admirals is a multi-award-winning, regulated Forex and CFD broker, offering trading on over 8,000 financial instruments via the world's most popular trading platforms: MetaTrader 4 and MetaTrader 5.
The given data provides additional information regarding all analysis, estimates, prognosis, forecasts, market reviews, weekly outlooks or other similar assessments or information (hereinafter “Analysis”) published on the websites of Admirals investment firms operating under the Admirals trademark (hereinafter “Admirals”) Before making any investment decisions please pay close attention to the following:
- This is a marketing communication. The content is published for informative purposes only and is in no way to be construed as investment advice or recommendation. It has not been prepared in accordance with legal requirements designed to promote the independence of investment research, and that it is not subject to any prohibition on dealing ahead of the dissemination of investment research.
- Any investment decision is made by each client alone whereas Admirals shall not be responsible for any loss or damage arising from any such decision, whether or not based on the content.
- With view to protecting the interests of our clients and the objectivity of the Analysis, Admirals has established relevant internal procedures for prevention and management of conflicts of interest.
- The Analysis is prepared by an analyst (hereinafter “Author”). The Author Jitanchandra Solanki is an employee for Admirals. This content is a marketing communication and does not constitute independent financial research.
- Whilst every reasonable effort is taken to ensure that all sources of the content are reliable and that all information is presented, as much as possible, in an understandable, timely, precise and complete manner, Admirals does not guarantee the accuracy or completeness of any information contained within the Analysis.
- Any kind of past or modelled performance of financial instruments indicated within the content should not be construed as an express or implied promise, guarantee or implication by Admirals for any future performance. The value of the financial instrument may both increase and decrease and the preservation of the asset value is not guaranteed.
- Leveraged products (including contracts for difference) are speculative in nature and may result in losses or profit. Before you start trading, please ensure that you fully understand the risks involved.