How to Use the Fear and Greed Index
Warren Buffet famously said, “Be fearful when others are greedy, and greedy when others are fearful”.
Uncontrolled emotions can work to our detriment in the markets; on the other hand, correctly evaluating the emotions of other market participants could help us make better decisions and potentially navigate turbulent times better. In this article, we will see how we could potentially use a fear and greed index and market sentiment overall as contrarian indicators to our advantage! Let’s dive in.
The information in this article is provided for educational purposes only and does not constitute financial advice. Consult a financial advisor before making investment decisions.
Table of Contents
What Is a Contrarian Indicator?
A contrarian indicator is a tool which can identify situations where the prevailing market sentiment may be excessive, and prices could soon reverse direction.
The idea behind contrarian investing or trading is simple: when the majority of investors become overly optimistic or overly pessimistic, markets could move in the opposite direction.
Why is that?
When market sentiment reaches extreme levels, it may signal that most investors have already acted on their expectations, leaving the market vulnerable to a reversal. This is a universally true supposition, no matter the traded asset.
There are other market sentiment indicators, which are popularly used as contrarian indicators, like the CBOE Volatility Index (VIX; more about it in a moment), and the CBOE Put/Call Ratio. Extremely high readings in these indicators could suggest excessive fear or speculation in the market.
Investors and traders use contrarian indicators to identify potential buying opportunities during periods of panic and selling opportunities during periods of market euphoria. As with all indicators, it is best to combine them with other technical indicators. We will look at some examples of strategies at the end of the article!
What Is the Fear and Greed Index?
One way of attempting to gauge market sentiment is by using a fear and greed indicator.
For example, the popular CNN Fear and Greed Index takes into account several indicators - such as stock momentum, market breadth, options activity, volatility, and demand for safe-haven assets - to reflect sentiment on the S&P 500 on a scale of 0 (Extreme Fear) to 100 (Extreme Greed). When the index shows low values, investors are pessimistic and vice versa.
Normally the index is presented as a gauge, but it can be tracked as a line across time as well. Fear and greed indices (since there are others, like the CMC Fear and Greed Index) are considered coincidental indicators, even though they could point to potentialfuture developments in the markets. We will see how in just a moment.
Below is the current Fear and Greed Index value of market sentiment, as of the time of writing:
-2.png)
Fear and Greed Index vs VIX
Another very popular way to try and evaluate sentiment in the markets is through the CBOE Volatility Index (VIX). The VIX tracks the expected volatility of the S&P 500 over the next 30 days, based on prices of S&P 500 options. Here is how we can interpret the VIX:
And here is how the VIX volatility futures currently look like:
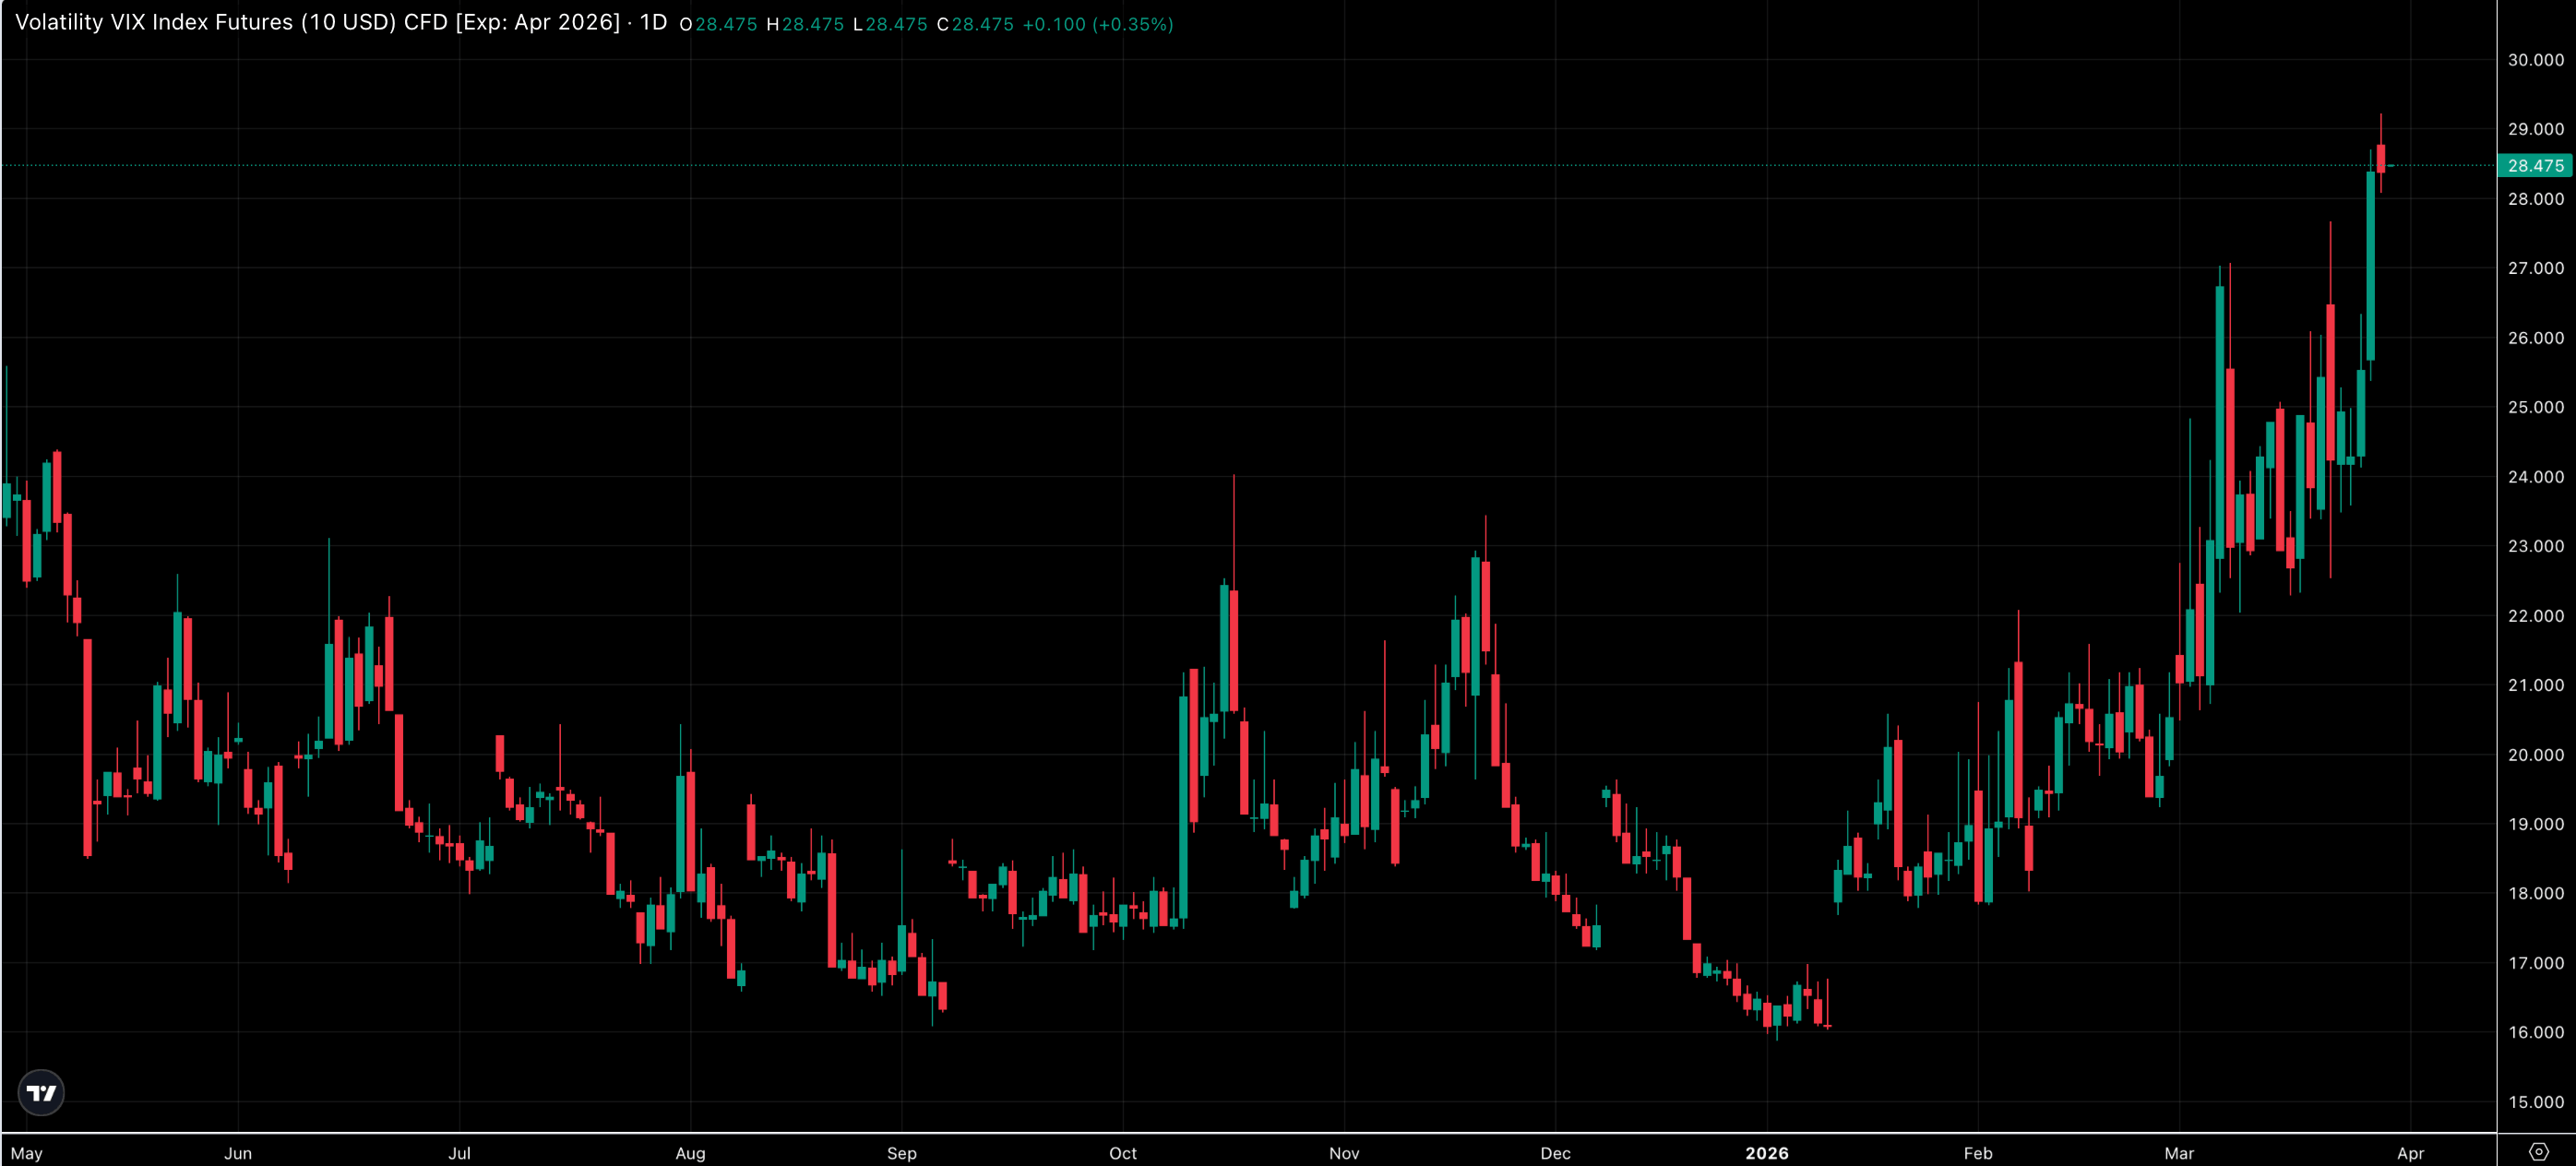
Note that the VIX index is one of the seven components used for calculating the Fear and Greed Index. Since the Fear and Greed is a more encompassing indicator, we are using it as an example for the purposes of this article. However, it’s worth reminding that it’s not the only available market sentiment indicator.
Analysing Market Sentiment with the Fear and Greed Indicator
Let’s observe the connection between the 1-year Fear & Greed Index chart and the S&P 500 index. Still, keep in mind that analysing any connection over longer periods of time could provide more meaningful results.
.png)
.png)
We can quickly see that fear extremes on the Fear and Greed market sentiment indicator are located around market bottoms, while peak extreme greed readings tend to be around market tops.
See how the Fear and Greed indicator falls until it bottoms out on 20 November 2025, the same day that the S&P 500 starts rebounding. On the other hand, it stays in “extreme greed” conditions between the beginning of July 2025 and 24 July 2025, during which period the S&P 500 reaches a local top.
This brings us to the statement of Buffett, with which we started the article. When other market participants are extremely greedy, it is possible that the markets (in this case the S&P 500) are close to a market top; when fear is extreme, the market could be close to a bottom.
Hence, “buy when others are fearful and sell when others are greedy” (of course, this is not investment advice).
How to Evaluate Market Tops and Bottoms
Now that we know the basics of the index, how can we use it alongside other technical indicators to potentially find peaks and bottoms more precisely?
An example of a strategy could be to combine:
- Relative Strength Index (RSI) with its moving average;
- 20-period moving average of the S&P 500; and
- The Fear and Greed Index as a market sentiment indicator.
From the end of March 2025, the Fear and Greed indicator moves into “extreme fear” territory. At the same time, the S&P 500 is below its 20-day moving average on the daily chart and the RSI moves into “oversold” territory.
On April 8 both the RSI, the Fear and Greed Index, and the S&P 500 reach a bottom; however, the RSI goes up from “oversold” and crosses its moving average from below. This could indicate a market bottom.
.png)
On the other hand, from the beginning of July until 24 July, our market sentiment indicator is showing “extreme greed”, and the RSI goes into “oversold” territory; however, the S&P 500 never closes and confirms below its 20-day moving average, so a market top is not reached.
Keep in mind that this strategy has not been tested. It is best to test each strategy first on a risk-free demo trading account before transitioning to the live markets.
Using Additional Technical Indicators with the Fear & Greed Index
Of course, RSI is not the only technical indicator which could be paired with a market sentiment tool to try to find a market top or bottom. Below are some others together with how we could potentially use them.
Bollinger Bands
Bollinger Bands measure price volatility and deviations from the average. When prices touch the lower band or pierces through it during periods of extreme fear, markets may be oversold and approaching a potential bottom. Conversely, prices near the upper band, or piercing it, during extreme greed can indicate that prices are stretched and at risk of reversing.
.png)
On the chart above we can see this happening on both 8 April and 20 November, for instance.
Volume Indicators
Volume technical indicators such as the On-Balance Volume (OBV) or the Money Flow Index (MFI) could help confirm whether real buying or selling pressure is supporting a move.
For instance, extreme fear accompanied by rising volume may suggest accumulation by investors, while extreme greed with declining volume could signal weakening demand.
Conclusion
Now you should be in a better position to evaluate market sentiment and potentially use it to your advantage! Applying these indicators could allow traders to combine market psychology with price behaviour, helping identify moments when extreme sentiment aligns with technical signals to potentially help find market turning points.
Other Articles You Might Be Interested In:
Frequently Asked Questions
How does the Fear and Greed Index work?
The Fear and Greed Index analyses and combines multiple indicators - including volatility, market momentum, and safe-haven demand - into a single score that reflects overall investor sentiment. Lower readings suggest fear, while higher readings suggest greed.
What is a good Fear and Greed Index reading?
There is no good level as such, but extreme readings tend to be the most important. Very low levels (extreme fear) may signal panic, while very high levels (extreme greed) can indicate excessive market optimism.
What is the difference between the Fear and Greed Index and the VIX?
Whereas the VIX specifically measures expected volatility in the market, the Fear and Greed Index combines several indicators, one of which is volatility, to give a broader view of market sentiment.
How do traders use the Fear and Greed Index?
Traders often use the indicator to spot extremes in sentiment. For example, some traders may view extreme fear readings as a potential buying opportunity. On the other hand, extreme greed may signal caution.
The given data provides additional information regarding all analysis, estimates, prognosis, forecasts, market reviews, weekly outlooks or other similar assessments or information (hereinafter “Analysis”) published on the websites of Admirals investment firms operating under the Admirals trademark (hereinafter “Admirals”) Before making any investment decisions please pay close attention to the following:
- This is a marketing communication. The content is published for informative purposes only and is in no way to be construed as investment advice or recommendation. It has not been prepared in accordance with legal requirements designed to promote the independence of investment research, and that it is not subject to any prohibition on dealing ahead of the dissemination of investment research.
- Any investment decision is made by each client alone whereas Admirals shall not be responsible for any loss or damage arising from any such decision, whether or not based on the content.
- With view to protecting the interests of our clients and the objectivity of the Analysis, Admirals has established relevant internal procedures for prevention and management of conflicts of interest.
- The Analysis is prepared by an analyst (hereinafter “Author”). The Author Daniel Vasilev is an employee for Admirals. This content is a marketing communication and does not constitute independent financial research.
- Whilst every reasonable effort is taken to ensure that all sources of the content are reliable and that all information is presented, as much as possible, in an understandable, timely, precise and complete manner, Admirals does not guarantee the accuracy or completeness of any information contained within the Analysis.
- Any kind of past or modelled performance of financial instruments indicated within the content should not be construed as an express or implied promise, guarantee or implication by Admirals for any future performance. The value of the financial instrument may both increase and decrease and the preservation of the asset value is not guaranteed.
- Leveraged products (including contracts for difference) are speculative in nature and may result in losses or profit. Before you start trading, please ensure that you fully understand the risks involved.