Discover Some of the Top Swing Trading Indicators
Swing trading has become a popular style of trading in the financial markets. In this article, you will learn some of the top swing trading indicators available in the Admirals MetaTrader 4 and MetaTrader 5 desktop and web platforms which are free to download.
Table of Contents
Why Use Swing Trading Indicators?
Swing traders aim to trade the swings or turning points in the market that can develop over time. These ‘swings’ develop from the rising and falling price of a market which is driven by cycles of buying and selling.
So how do swing traders identify these potential turning points in the price? This is where swing trading indicators become useful. These types of indicators analyse price data to give clues to traders on the trend of a market, whether it is overbought or oversold and other market conditions.
Swing trading indicators can be used to swing trade stocks, forex, commodities, indices and most asset classes.
Top 10 Swing Trading Indicators
- Moving Averages
- Stochastic Oscillator
- Admirals Pivot indicator
- Relative strength index (RSI)
- Moving average convergence divergence (MACD)
- Relative Vigor index (RVI)
- DeMarker indicator
- Donchian channels
- On balance volume (OBV)
- Williams % range indicator (%R)

Top Swing Trading Indicators Explained
Below, we go through how to use the top swing trading indicators. However, most traders will also use other tools within their overall analysis. This can include analysing price action patterns, chart patterns and support and resistance levels.
It is prudent to create trading strategies that utilised a variety of different technical tools and types of analysis techniques in order to find high-probability trading setups. This is because there is no one top tool that will work all the time, so traders will use multiple tools to stack probability in their favour.
Let’s have a look at the top three swing trading indicators in more detail. Of course, the ‘top’ of anything will differ for each trader as everyone has a different style of trading the financial markets. But the list below can act as a great starting point to identify the tools available to incorporate into your swing trading.
1. Moving Averages
Moving averages help to identify the average price of a market over a user-defined period. For example, a 50-period moving average will aim to show the average price over the last 50 bars on the timeframe you are on.
While a moving average is a lagging swing trading indicator, they help to visualise the average price of the market which can be seen as the trend of the market.
There are different types of moving averages. The simple moving average (SMA) averages the closing price of the bars over a user-defined period of time. The exponential moving average (EMA) places greater weighting towards recent price action within its calculation.
Learn more in the How to Trade with the Moving Average Indicator article.

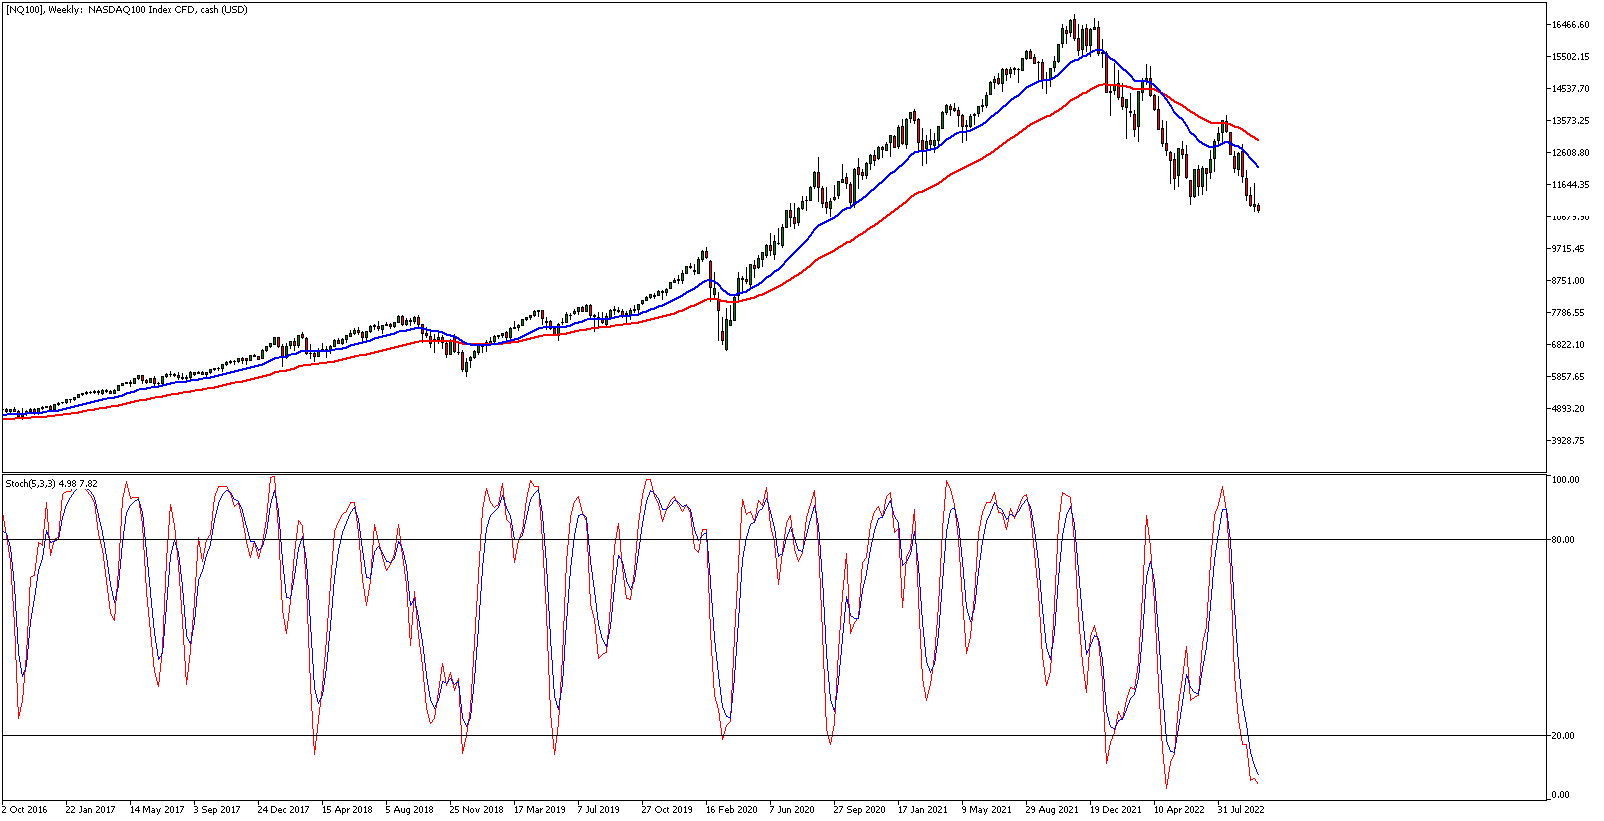
The chart above is a weekly chart of the US100 stock index CFD, taken from the MetaTrader 5 trading platform provided by Admirals.
- The blue line is the 20-period EMA
- The red line is the 50-period EMA
Higher-period moving averages are known as slower moving averages as they will react more slowly to changes in price as it is based on a larger group of bars. The lower-period moving averages are known as faster moving averages as they will react more quickly to changes in recent price action.
When the fast moving average is above the slow moving average it is considered to be an uptrend. In the chart above, this means that when the 20 EMA is above the 50 EMA, or the blue line is above the red line, it indicates an overall uptrend.
When the fast moving average is below the slow moving average it is considered to be a downtrend. In the chart above, this means that when the 20 EMA is below the 50 EMA, or the blue line is below the red line, it indicates an overall downtrend.

Swing traders will use moving averages to identify the overall trend and also to help identify potential turning points. From the chart above, the blue boxes represent points in time where some price swings have developed around the moving averages.
There have been many occasions where the price has swung or turned around the moving average lines. However, there have also been occasions where the price has broken through the moving average lines. Swing traders can therefore use moving averages. to help identify potential bounces or breaks in the market.

2. Stochastic Oscillator
The stochastic oscillator is another top swing trading indicator to analyse the momentum of a market and whether it is changing which could lead to a turn, or swing, in price. The indicator is an oscillator comprised of two lines that move between 0 and 100 by compressing the closing price of a market into a high low range over a user-defined number of periods.
You can learn more about how the stochastic oscillator is calculated from the Stochastic Oscillator Trading Strategy Guide.
Below is the same chart as used above (weekly price chart of the US100 stock index CFD), showing the 5,3,3 stochastic oscillator.
There are a variety of ways in which swing traders can use the stochastic oscillator which includes using it to identify overbought and oversold conditions, as well as reversal and continuation divergences.
Overbought / Oversold
It is considered that when the stochastic oscillator lines are:
- Above 80, the market is in overbought territory.
- Below 20, the market is oversold territory.
However, the market context is arguable more important here. In a downtrend, most indicators will be in oversold territory as price will have been move lower. Conversely, in a strong uptrend, it’s likely indicators will be overbought territory as there are more buyers in the market.
Therefore, when using swing trading strategies, traders will use the stochastic oscillator to help find:
- Overbought conditions in an overall up trending market.
- Oversold conditions in an overall down trending market.

The green vertical lines on the stochastic oscillator window in the chart above show the times when the indicator is below 80 and considered to be oversold but also in line with an overall uptrend as the fast EMA above the slow EMA.
The red vertical lines on the stochastic oscillator window in the chart above show the times when the indicator is above 20 and considered to be overbought but also in line with an overall downtrend as the fast EMA is below the slow EMA.
For swing traders, the combination of overbought/oversold indicators and trend indicators can be very powerful.
3. Admirals Pivot Indicator
The MetaTrader Supreme Edition is a free-to-download plugin that provides a range of advanced, additional indicators and trading tools to the standard MetaTrader 4 and MetaTrader platforms.
It includes tools such as a correlation matrix, sentiment indicator and algorithmic-based trading ideas which finds technical analysis patterns. It also includes a range of extra indicators such as Renko charts, Keltner bands and the pivot point indicator.
Pivot points are horizontal lines on a chart that represent the averages for the highs, lows and closing prices for the month, week, day or even 4-hour charts and below. The indicator is commonly used to provide support and resistance levels where price action could potentially turn.
You can download the Admiral Pivot indicator by upgrading your MetaTrader platform to the Admirals Supreme Edition completely free! This specialised indicator allows you to:
- Create pivot points for monthly, weekly, daily, 4-hour, 1-hour, 30-minute, 15-minute, 5-minute and 1-minute charts.
- Access different types of pivot points including the classic version, as well as Fibonacci pivots, Camarilla pivots and Woodie pivots.
You can learn more about using pivot points in the 3 Pivot Point Forex Strategies article.
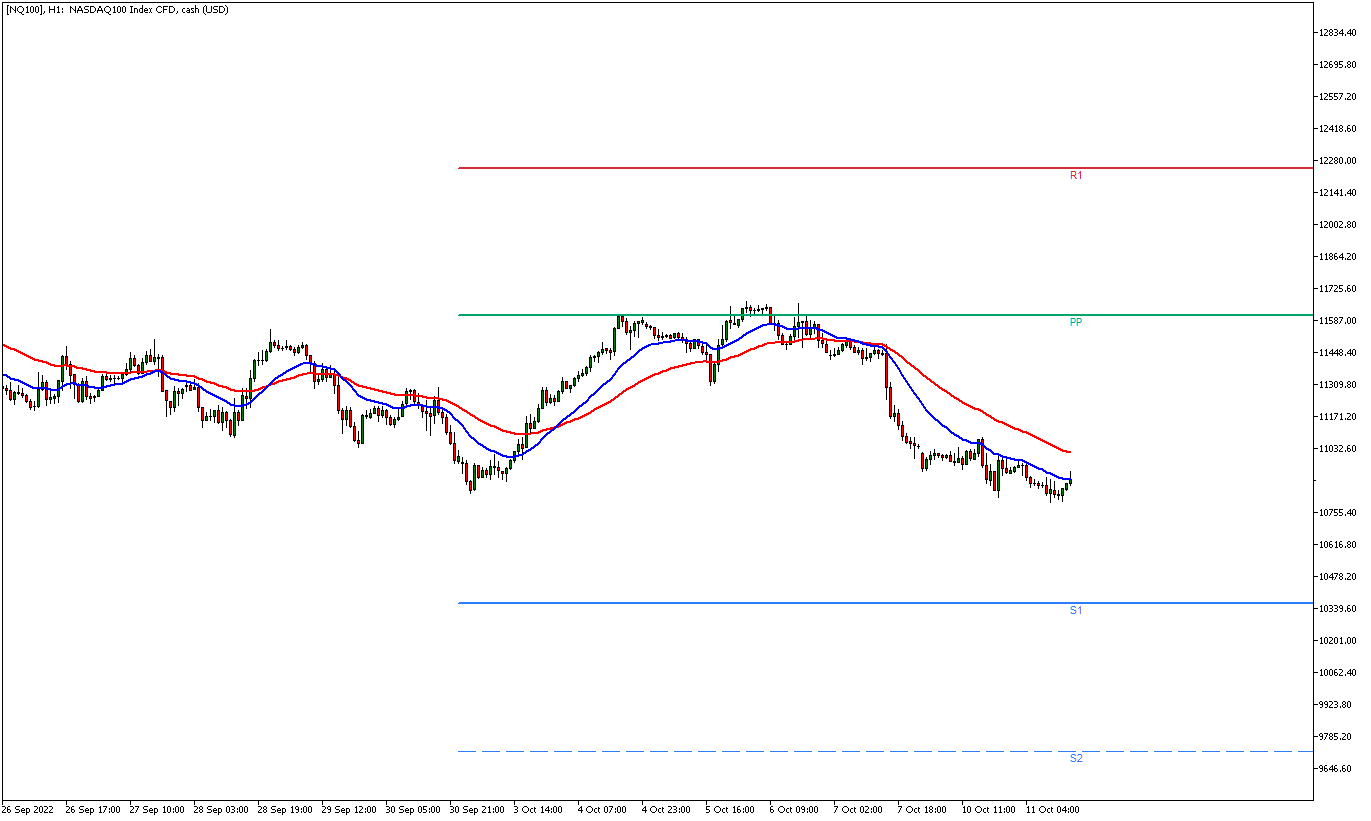
The chart above shows the 1-hour price chart for the US100 stock index CFD with the Admirals classic monthly pivot point on the chart. As you can see the PP (pivot point) line in green has acted as a level of resistance as the price has rejected the line several times.
Pivot points can act like support and resistance levels in which the price can either bounce off or breakthrough. They are a useful type of swing trading indicator when combined with other indicators such as the ones discussed above.

How to Start Using Swing Trading Indicators
Below is a four-step guide on how to get started using swing trading indicators.
- Open a live trading account to gain access to the Dashboard which is packed full of tools to support your trading.
- Verify your identity and address for regulatory compliance.
- Fund your trading account. Admirals provide a range of free deposit methods including bank transfers, cards and e-wallets.
- Download MetaTrader and start swing trading on thousands of markets covering forex, stocks, indices, commodities and cryptocurrencies (depending on your region).
Alternatively, you can open a free demo trading account to start trading in a virtual environment until you are ready to go live.

FAQs
Is MACD good for swing trading?
The MACD indicator can be good for swing trading. There are a variety of ways the MACD could be useful. For example, identifying reversal divergence between the MACD and price action can help to identify potential turning points or swings in the market.
Is RSI good for swing trading?
The RSI, or Relative Strength Index, is used in swing trading by identifying overbought and oversold conditions. These are then typically filtered out using trend indicators to identify overbought conditions in an overall uptrend and oversold conditions in an overall downtrend.
How do you successfully swing trade?
Swing trading requires a good broker with low fees and multiple markets (forex, stocks, indices, etc), a state-of-the-art trading platform with swing trading indicators, a trading strategy in how to use the indicators, consistency, discipline and proper risk management.
About Admirals
Admirals is a multi-award winning, globally regulated Forex and CFD broker, offering trading on over 8,000 financial instruments via the world's most popular trading platforms: MetaTrader 4 and MetaTrader 5. Start trading today!
INFORMATION ABOUT ANALYTICAL MATERIALS:
- The given data provides additional information regarding all analysis, estimates, prognosis, forecasts, market reviews, weekly outlooks or other similar assessments or information (hereinafter “Analysis”) published on the websites of Admirals’ investment firms operating under the Admirals trademark (hereinafter “Admirals”) Before making any investment decisions please pay close attention to the following:
- This is a marketing communication. The content is published for informative purposes only and is in no way to be construed as investment advice or recommendation. It has not been prepared in accordance with legal requirements designed to promote the independence of investment research, and that it is not subject to any prohibition on dealing ahead of the dissemination of investment research.
- Any investment decision is made by each client alone whereas Admirals shall not be responsible for any loss or damage arising from any such decision, whether or not based on the content.
- With a view to protecting the interests of our clients and the objectivity of the Analysis, Admirals has established relevant internal procedures for the prevention and management of conflicts of interest.
- The Analysis is prepared by an independent analyst, Jitanchandra Solanki (analyst), (hereinafter “Author”) based on their personal estimations.
- Whilst every reasonable effort is taken to ensure that all sources of the content are reliable and that all information is presented, as much as possible, in an understandable, timely, precise and complete manner, Admirals does not guarantee the accuracy or completeness of any information contained within the Analysis.
- Any kind of past or modelled performance of financial instruments indicated within the content should not be construed as an express or implied promise, guarantee or implication by Admirals for any future performance. The value of the financial instrument may both increase and decrease and the preservation of the asset value is not guaranteed.
- Leveraged products (including contracts for difference) are speculative in nature and may result in losses or profit. Before you start trading, please ensure that you fully understand the risks involved.