3 Pivot Point Forex Trading Strategies
This article will provide you with a detailed explanation of the pivot point trading strategy. It will answer questions, such as: What are pivot points? What is a pivot point in share trading? What is a pivot point in Forex? How can you use support and resistance levels within a pivot point Indicator? What types of pivot points are there? How do you use pivot points? And how can pivot points be used in MetaTrader?
Table of Contents
Pivot Point: An Introduction
What is a pivot point in Forex? Pivot points assist traders with determining price movements in financial markets.
| Put simply, a pivot point is a price level that is used by professional traders to assess whether prices are bullish or bearish. |
Pivot points represent the averages for the highs, the lows, and the closing prices that occur within a trading session or a trading day. Pivot Points are a type of indicator used for technical analysis, which provides the basis for determining market trends.
Pivot Point: Support & Resistance Levels
Underpinning nearly all forms of technical analysis are the core concepts of support and resistance. These can be thought of as levels that are expected to be key battlegrounds in the battle between bears and bulls. As the market approaches them, some traders expect the price to rebound.
Others might anticipate the chance of a breakout. Consequently, they are important prices because they signpost the chance of significant movement. Therefore, identifying where these levels lie is a very useful skill to develop.
Given the importance of support and resistance points, there follows a natural question: How do we calculate where to find these crucial price levels? There are a large number of methods that attempt to satisfy this query.
One popular technique used is looking at pivot points. Pivot point trading takes standard price information, such as highs, lows and closes, and uses this information to project possible support and resistance levels.
Types of Pivot Points
Here's what you need to know about different types of pivot points in Forex and stocks before you start using the pivot point Forex indicator: Many different types of pivot analysis exist. We will now explore how to calculate the pivot point in Forex behind different kinds of pivot points, namely; Standard Pivot Points, Fibonacci Pivot Points and DeMark Pivot Points.
Standard Pivot Points
How do you calculate pivot points in Forex with standard pivot points? The starting calculation for this pivot point formula is the arithmetic mean of the high ( H), the low (L) and the close (C) from the previous period. We call this our base pivot point, P.
- P = (H + L + C)/3
We next derive two support and resistance levels from P. Let's call the difference between the high and low D, i.e. D = H - L
- First support: S₁ = 2P - H
- Second support: S₂ = P - D
- First resistance: R₁ = 2P - L
- Second resistance: R₂ = P + D
Fibonacci Pivot Points
How do you calculate pivot points in Forex with the Fibonacci indicator? We proceed from the same starting point as used for standard pivot points, which requires calculating P, the base pivot point. Support and resistance levels are plotted a certain distance away from this point P. Let's once again call D - the difference between the high and low.
Support levels are calculated by subtracting multiples of D from P. Resistance levels are calculated by adding multiples of D to P. The multiples are taken from the Fibonacci sequence of numbers.
The exact calculations are as follows:
- S₁ = P - 0.382D
- S₂ = P - 0.618D
- S₃ = P - D
- R₁ = P + 0.382D
- R₂ = P +0.618D
- R₃ = P + D
Traders who know how to read pivot points in Forex can use these points to establish a Fibonacci pivot point trading strategy.
DeMark Pivot Points
How do you calculate pivot points in Forex For DeMark pivot points? We use a different base pivot point definition. In fact, there are three different ways to calculate the base pivot point with this method. Which calculation you should use depends on how the close and the open compare. For these pivots, we define a variable x, the value of which depends on whether the open is higher or lower than the close.
- If the close is lower than the open: x = H + 2L + C
- If the close is higher than the open: x = 2H + L + C
- When the open is equal to the close: x = H + L + 2C
This final value will be the one more commonly used if you are looking at a Forex pivot point trading strategy. This is because with FX being a 24-hour market, the open is nearly always equal to the close. If you're looking at a daily chart during the week, the close and open are really just conventions. This is in contrast to the stock market, where the open and close are very distinct things, separated by time and usually by price.
Once we have our value for x, we use it to calculate the base pivot point P:
- P = x/4
The support and resistance levels are also calculated from x (DeMark pivot points do not use more than one support and resistance level).
- R₁ = x/2 - H
- S₂ = x/2 - L
How to Use Pivot Points
So we've defined how to calculate different types of pivot points and accompanying support and resistance levels. But the next questions are, "How to read pivot points in Forex?" and "How to use pivot points in Forex?". We'll answer these questions to help us in our day-to-day trading.
Firstly, we can use our base pivot point as a way to gauge the general direction. If the prevailing market price is above the base pivot point, it suggests bullishness. If the market is below the base pivot, it suggests a bearish tenor.
Secondly, we can use our support and resistance levels to inform our trading. Typical pivot point trading rules would require us to take a long position when the indicator suggests a bullish market, or to go short in bearish conditions. You would aim to close long positions when the market reaches resistance levels, or close short positions when the market drops to support levels.
Alternatively, you could use the support and resistance levels as indicators of when to open positions. You would go short when the market reaches resistance, or go long when it drops down to support.
Naturally, you're not going to want to perform the calculations involved manually. For convenience's sake, you'll likely be wanting your trading software to do the calculations for you. So with that in mind, let's talk about how to use a pivot point indicator in MetaTrader 4 (MT4) to help you establish a pro trading strategy with pivot points.
Pivot Points: An MT4 Indicator
MetaTrader 4 is a widely-used FX platform, and one of the reasons for its success is its expandability. Users familiar with its MQL4 language can quite readily create new indicators or trading algorithms. For those who aren't at that level of coding, there is a vast library of indicators available to download, the majority of which have been created by the wide user base. The drawback, of course, is that these can be of varying quality.
Ideally, you'll want to use indicators that have been put together by professionals. Now, MT4 does come with a limited selection of indicators that meet this quality. Unfortunately, a pivot point indicator is not of these tools that come bundled as standard. This means that you are going to have to download a pivot point indicator in MetaTrader 4 if you want to use this method of analysis.
If you're interested in using tools that come from a trusted source, the best MT4 pivot point indicator for you will likely be the one available in the MetaTrader 4 Supreme Edition (MT5SE) plugin. MT4SE is a free plugin for MetaTrader that was carefully crafted by professional coders.
One advantage it has is the fact that traders receive a bundle of new tools all at once from the same reliable source. When you download MetaTrader MT5SE, you get a whole package of extra tools and indicators, rather than having to download each piece, one-by-one.
For example, the High-Low indicator, Donchian channels, and the Keltner channels are just some of the tools included. So you get an extensive selection of cutting-edge tools alongside the Forex (FX) pivot point indicator free download. Once you have downloaded and installed MT4SE, you will see your additional tools in the 'Navigator'.
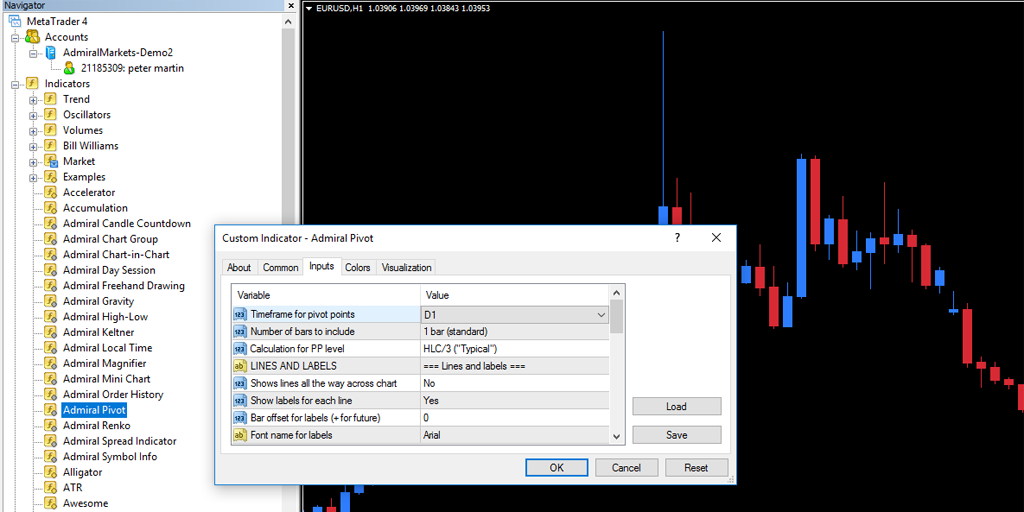
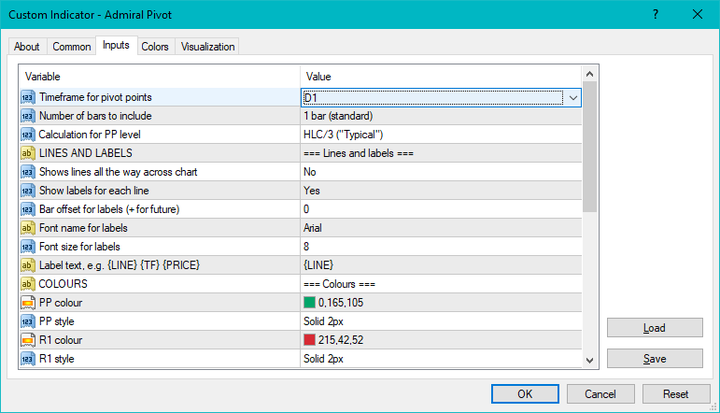
Double-clicking on 'Admiral Pivot' launches a window from which you can alter many input values, as well as aspects of how MT4 displays the indicator. If you are happy with the default values, select 'OK'. As you can see from the screenshot above, the default value for the timeframe for the pivot points is set as 'D1'. In other words, the highs, the lows, and the close values are all taken from the previous day, which is the convention for pivot points.
You can configure this to a different value if you prefer, but please note that pivot points are generally intended for short-term analysis: a common usage is as a pivot point day trading strategy or for even shorter time-frames.
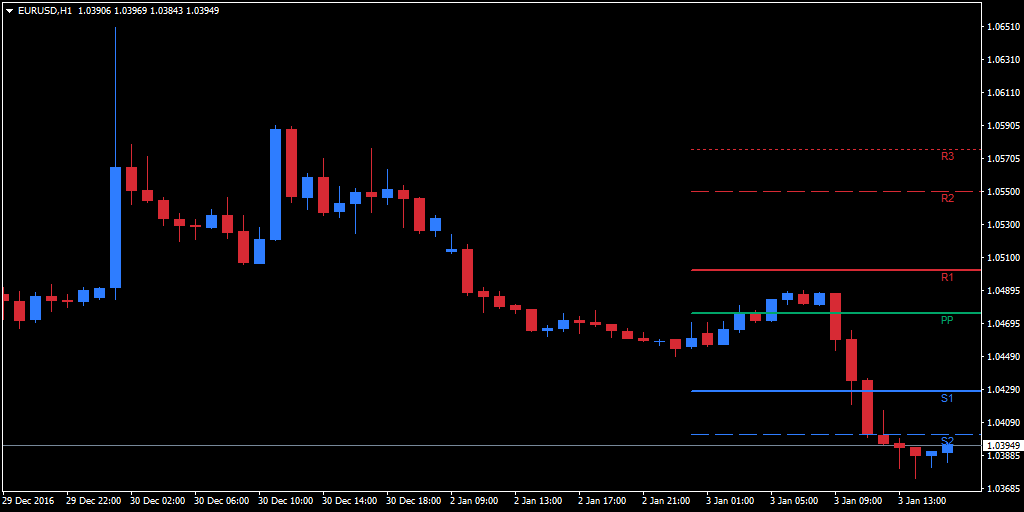
The chart above displays pivot lines plotted on an hourly EUR/USD chart. The resistance lines are marked in red, and the support lines are marked in blue, but these attributes are completely customisable in MT4SE. The base pivot point is labelled PP. This is calculated in the standard way described above—as the average of highs, lows and closes—but you can also configure this to a variety of methods.
Other options for configuring pivot point trading strategies with coding and formula language is through AmiBroker AFL.
Pivot Point Trading Strategies
There are several ways to use pivot points. I will now detail some specific pivot point trading strategies.
#1 Admiral Pivot Indicator Download
If you are using Admirals' trading software for technical analysis and you want to know how to add pivot points to MT4, one way is with the Admiral Pivot indicator download. The support and resistance levels here are presented uniquely and exclusively via this pivot indicator, which is available through the MetaTrader Supreme Edition (MTSE) plugin. The Admiral Pivot indicator download is a professionally coded support and resistance indicator in MT5 and MT4 for trading financial markets.
It is used for:
- S&R scalping
- S&R breakouts
- S&R Zones
- S&R basic indicators
The uniqueness of the Admiral Pivot point indicator comes from a modifier that you can locate within the indicator properties.
The custom Forex resistance and support indicator (shown above) allows you to select any of the nine different time -frames that you can watch on the current time frame. For example, you can trade on a 5-minute chart with H1 pivot points attached to the chart. Additionally, you can customise the indicator to your liking using additional options in the indicator properties.
Admiral Pivot Indicator Settings
The pivot points show different resistance and support lines in the chart, while the PP-line is the most important support and resistance line.
R1, R2 and R3 represent increments of the resistance with decreasing significance. On the other hand, S1, S2 and S3 represent increments of the support.
Here are the settings of the Admiral Pivot indicator:
- Timeframe for pivot points – sets the time-frame that is the basis for calculation of the pivot points.
- Number of bars to include – sets the number of candles used to calculate the pivot points.
- Calculation for PP level – sets the method for price calculation of the pivot points.
- Show lines all the way across chart – allows lines to be displayed along the entire chart.
- Show labels for all lines – enables labels for pivot lines.
- Bar offset for labels (+ for future) – moves line labels to the right or left.
- Font name for labels – sets the font type for the line labels.
- Font size for labels – sets the font size for the line labels.
- Colours and styles – sets the colour and style of all individual lines.
- Alerts – sets up alerts for the price-crossing lines.
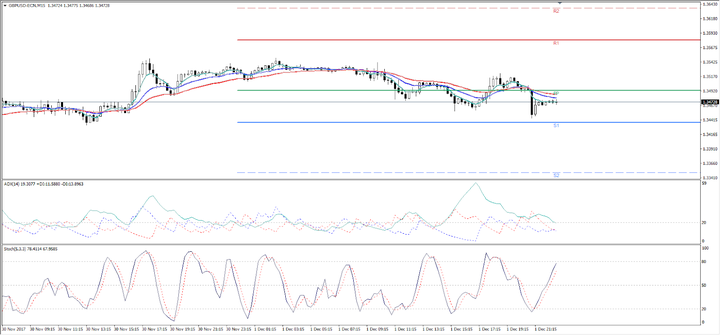
Pivot Point Trading Strategy with Admiral Pivot
This strategy is not a standard pivot point trading strategy, but a key component of it is the Admiral Pivot indicator in MetaTrader 4. Here is an example of a Forex strategy based on support and resistance levels defined in part by the Admiral Pivot MT4 indicator:
Timeframe: M15
Currency Pairs:
- EUR/USD
- GBP/USD
- USD/JPY
- AUD/USD
- NZD/USD
- USD/CHF
- EUR/JPY
Indicators:
- Admiral Pivot (D1)
- ADX (Average Directional Index) - (14) with 20 level added
- 5 EMA (Exponential Moving Average) - (close) – Green
- 15 EMA (close) – Blue
- 30 EMA (close) – Red
- Stochastic (5,3,3) with 50 level added

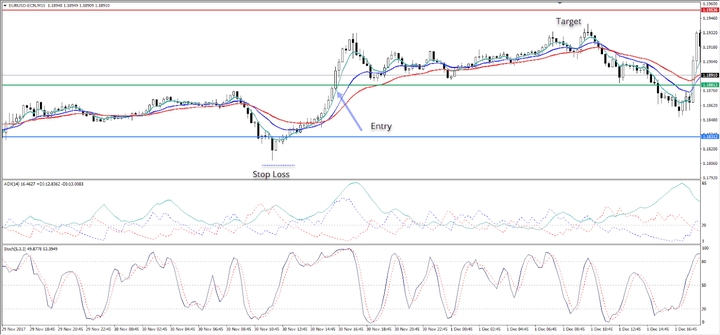
Long Trade:
- The price needs to cross above the Admiral Pivot Point support (PP, S1, S2, or S3)
- ADX (14) is higher than 20
- 5 EMA is above 15 EMA, while both are above 30 EMA (Green > Blue > Red);
- The stochastic is higher than 50
- Re-entry can be made when the stochastic crosses up to the 50 level from below, if the price is in an uptrend
- The target is the next Pivot Point or 3-5 pips away from it
- The stop-loss is 5 pips below the last swing low
Short Trade:
- The price needs to cross below the Admiral Pivot Point resistance (PP, R1, R2 or R3)
- ADX (14) is higher than 20
- 5 EMA is below 15 EMA, while both are below 30 EMA (Red > Blue > Green)
- The stochastic is lower than 50
- Re-entry can be made when the stochastic crosses down to the 50 level from above if the price is in a downtrend
- The target is the next Pivot Point or 3-5 pips away from it
- Stop-loss is 5 pips above the last swing high
#2: Camarilla
The Camarilla pivot point trading strategy uses a simple extension of what is known as the classical pivot point, which suggests key support and resistance levels for traders. The Camarilla pivot point trading strategy uses four resistance and four support levels. It also uses closer levels than the other pivot variations. The proximity of its levels makes this strategy popular among short-term traders.
Camarilla Formula
The calculation of the Camarilla pivot points, with resistance and support levels, is here:
Resistance 4 (R4) = Closing + ((High - Low) x 1.5000)
Resistance 3 (R3) = Closing + ((High - Low) x 1.2500)
Resistance 2 (R2) = Closing + ((High - Low) x 1.1666)
Resistance 1 (R1) = Closing + ((High - Low x 1.0833)
Pivot point (PP) = (High + Low +Closing) / 3
Support 1 (S1) = Closing – ((High - Low) x 1.0833)
Support 2 (S2) = Closing – ((High - Low) x 1.1666)
Support 3 (S3) = Closing – ((High - Low) x 1.2500)
Support 4 (S4) = Closing – ((High- Low) x 1.5000)
Camarilla Pivot Point Trading Strategies
There are more than one Camarilla pivot point strategies. Here are two of the favoured strategies among traders using this handy indicator:
Camarilla Range Strategy
A range is what traders call a sideways market, in which the price trades in between lines of resistance and support. Camarilla points are sometimes popular among range traders. This is because each day, this indicator presents a new range to trade in.
Traders that are interested in short term reversals can focus on the price changing between the R3 and S3 pivots. Traders consider this region the daily range, which could be used for a good pivot point strategy for day trading. It creates an area that traders can use to decide when to enter the market.
Range reversal traders are looking for the price to move either toward a point of resistance or support. In the case that the resistance keeps the price from moving higher, a range trader may consider starting a short position near the R3 pivot, anticipating the price will move towards the support.
However, if the price remains around the S3 support, a range trader may consider initiating a buy position near that S3 pivot support with the anticipation that the price may move up towards the R3 resistance.
However, it's important to note here that the price can do neither of these and can remain within a range all day. This strategy is best suited for periods of low volatility, such as during the Asian session.
During more volatile times, traders will abandon this strategy for something suited for volatile price movements, or a trend strategy.
Camarilla Trend Strategy
A trend is a steady price move that continues either higher or lower for a specific period of time. The Camarilla pivot point trading strategy can be very useful in trending markets, and can suggest to traders key levels for entry, stop and limit. If the market is in an upward trend, traders usually look for an opportunity to buy at the S3, with a stop set at the S4. If the market is in a downtrend, traders might sell at the R3 and set a stop at the R4.
Different traders use different methods to determine where they will set their take profit levels. These methods include:
- Fibonacci extensions/retracements: a Fibonacci pivot point trading strategy may entail waiting for the Fibonacci retracement line to converge with a Pivot support line (S1, S2, S3) to enter a long position in an upwards trend.
- Price action: If the price action approaches a pivot point on your chart, you can consider this situation to be a normal trading level. If the price begins hesitating once it reaches this level and then bounces in the opposite direction, this may be a sign to trade in the direction of this bounce.
However, if the price action moves past the pivot, you may suspect this action to continue in
this direction in a breakout. When the price clears such levels, traders call this a pivot point
breakout.
- Other technical indicators
The strategy used varies from trader to trader.
Advantages and Disadvantages of Camarilla Pivot Points
Advantages
- Good for short-term traders
- Strengthens a trader's risk management
- Suitable for all financial markets
Disadvantages
- Not always helpful for longer-term traders
- Can be challenging for new traders to use
- Applying the strategy to unfavourable market conditions can result in additional losses
#3: Swing Trading
Swing trading is a strategy in trading where traders try to use strong directional shifts (swings) to their advantage in their trades. Typically, swing traders enter trades that last from 1 to 7 days.
In many cases, such moves can be strong, so a trader could have a good chance at a successful trade.
Using a pivot point trading strategy in swing trading is similar to the strategies I have just discussed above. However, swing traders usually use specific timeframes. While day traders typically use daily pivots, swing traders typically use pivot points for more than one day, such as weekly or, sometimes, monthly, if the trader plans to keep a trade open for weeks. With different timeframes, traders can establish a weekly pivot point trading strategy or a monthly pivot point trading strategy.
#4: Intraday
Intraday refers to changes in the price that occur throughout the day, so intraday price movements are important to short-term and day traders. Which pivot points are best for intraday? As such, a pivot point trading strategy focusing on intraday movements would utilize pivots on a shorter timeframe.
Conclusion
We hope that this has been a useful introduction to pivot point trading. How well the method suits your trading style is solely for you to determine. It's always a good idea to find out what works or not via a demo trading account. Demo accounts allow traders to test their strategies within a risk-free trading environment, by trading with virtual funds, so their capital is not at risk. Demo trading allows you to build up confidence in a strategy before you start to invest real money in a live account.
Bear in mind that the pivot point indicator is not a complete trading system in itself. The pivot point trading rules described above are effectively price setups — a loose guide to price points that may be beneficial to trade. A successful pivot point trading strategy will need to incorporate other skills like money management, exit strategies, judicious choice of market, etc.
Furthermore, when you download the pivot point indicator for MetaTrader 4 Supreme Edition, it comes with a whole range of additional tools and indicators, as mentioned earlier. You can use these tools to back up or confirm your findings with the pivot point indicator. If two or three indicators are all telling the same story, it makes a more compelling case for placing a trade.
In this article, we have looked at a few different types of Forex pivot point trading strategies. A general truism of trading is that there are no extra points for complexity. You may well find that the best pivot point indicator is the simplest one. Use what works best for you.
Are you interested in practicing your trading under real and live market conditions? If so, why not register for a free demo account and hone your skills before trading on the live markets! Click the banner below to get started:
Frequently Asked Questions
What are pivot points in forex trading?
Pivot points are key technical indicators used by forex traders to identify potential support and resistance levels. They are calculated based on the previous day's price data and can help traders make decisions about entry and exit points.
How are pivot points calculated?
Pivot points are typically calculated using the high, low, and close prices from the previous trading day. The most common formula for pivot points is to add the high, low, and close prices, and then divide by 3. This provides the pivot point. Additional support and resistance levels are calculated using variations of this formula.
How can traders use pivot points in forex trading?
Traders use pivot points to identify potential price levels where the market may reverse or consolidate. When the current price is approaching a pivot point, it can be used as a reference for making trading decisions. For example, if the price is near a support pivot point, traders might consider buying, while if it's near a resistance pivot point, they might consider selling. However, pivot points should be used in conjunction with other analysis and not as a sole trading strategy.
INFORMATION ABOUT ANALYTICAL MATERIALS:
The given data provides additional information regarding all analysis, estimates, prognosis, forecasts, market reviews, weekly outlooks or other similar assessments or information (hereinafter “Analysis”) published on the websites of Admirals investment firms operating under the Admirals trademark (hereinafter “Admirals”) Before making any investment decisions please pay close attention to the following:
- This is a marketing communication. The content is published for informative purposes only and is in no way to be construed as investment advice or recommendation. It has not been prepared in accordance with legal requirements designed to promote the independence of investment research, and that it is not subject to any prohibition on dealing ahead of the dissemination of investment research.
- Any investment decision is made by each client alone whereas Admirals shall not be responsible for any loss or damage arising from any such decision, whether or not based on the content.
- With view to protecting the interests of our clients and the objectivity of the Analysis, Admirals has established relevant internal procedures for prevention and management of conflicts of interest.
- The Analysis is prepared by an independent analyst (hereinafter “Author”) based on their personal estimations.
- Whilst every reasonable effort is taken to ensure that all sources of the content are reliable and that all information is presented, as much as possible, in an understandable, timely, precise and complete manner, Admirals does not guarantee the accuracy or completeness of any information contained within the Analysis.
- Any kind of past or modelled performance of financial instruments indicated within the content should not be construed as an express or implied promise, guarantee or implication by Admirals for any future performance. The value of the financial instrument may both increase and decrease and the preservation of the asset value is not guaranteed.
- Leveraged products (including contracts for difference) are speculative in nature and may result in losses or profit. Before you start trading, please ensure that you fully understand the risks involved.