How to Use the EMA Indicator
The EMA indicator is used to identify trend direction, spot potential reversals, and fine-tune entry or exit points by giving more weight to recent price data, thus being more responsive to recent market fluctuations.
In this article, we'll explain what the EMA indicator is, look at a few EMA settings for different timeframes and outline how to apply the EMA strategy in various market scenarios.
The information in this article is provided for educational purposes only and does not constitute financial advice. Consult a financial advisor before making investment decisions.
.png)
Table of Contents
- What is the Exponential Moving Average?
- Using the Exponential Moving Average Formula
- The Exponential Moving Average Calculation
- How to Use the EMA Indicator in MT4 and MT5
- EMA Indicator Settings and Period Selection
- Building An Exponential Moving Average Strategy
- Common EMA Trading Mistakes
- Advanced EMA Techniques and Combinations
- Final Thoughts
- Frequently Asked Questions
What is the Exponential Moving Average?
The Exponential Moving Average (EMA) is a type of moving average used to identify market trends by smoothing out price data. Like all moving averages, it looks back over a set number of periods to produce a trend-revealing line.
However, unlike the Simple Moving Average (SMA) which gives equal importance to every data point, the EMA applies a weighting system that favours the most recent prices.
This weightage decreases exponentially as we go back in time, thereby making the EMA more responsive to present market conditions compared to the SMA. Therefore, EMA is preferred by traders when they have a need for speedier responses to very recent price movements, such as in short-term trading.
So, what’s the difference between EMA and SMA?
Another important thing to note is that the EMA is calculated by combining a portion of the current price with a portion of the previous EMA value. Although the full formula can be complex, the core idea is straightforward: newer prices matter more. More on how this weighting works, why it matters will be explained in the next segment.
Using the Exponential Moving Average Formula
Let’s see how EMA is calculated at time ‘t’ using a formula:
- α is the smoothing constant (also called the EMA multiplier) and always falls between 0 and 1
- EMAt-1 is the EMA value for the previous period
The smoothing constant (α) is determined by the number of periods n:
This multiplier ensures that recent prices carry more weight than older prices. Because each new EMA value depends on the previous one, the calculation builds on itself over time.
In practice, the EMA calculation involves setting an initial value and then using the smoothing constant on the new data point. Let’s break this down with a step-by-step example for better understanding.
The Exponential Moving Average Calculation
In the calculation of the exponential moving average, we need a ‘Day 1’ value to start with. For this first value, we use an SMA by finding the mean of the previous ‘n’ values.
Therefore, our starting point in the calculation of the exponential moving average is actually a simple moving average.
To illustrate how this works in practice, let’s calculate an 8-day EMA using sample price data. The smoothing constant (α or the EMA multiplier) is determined by the standard formula: 2 / (n+1), or 2/9.
As you can imagine, performing the exponential moving average formula with a large data set would be incredibly time-consuming. Thankfully, you won’t have to calculate the EMA by hand. Nowadays, trading platforms can plot the EMA line on a chart almost instantly for any duration you choose.
How to Use the EMA Indicator in MT4 and MT5
Applying the EMA indicator in MT4 or MT5 is pretty straightforward, and the process is the same in both platforms.
To add an EMA, open the Navigator window, find Indicators, go to Trend, and select Moving Average. In the settings window, set the MA method to Exponential. The key EMA indicator settings you will adjust are Period and Shift.
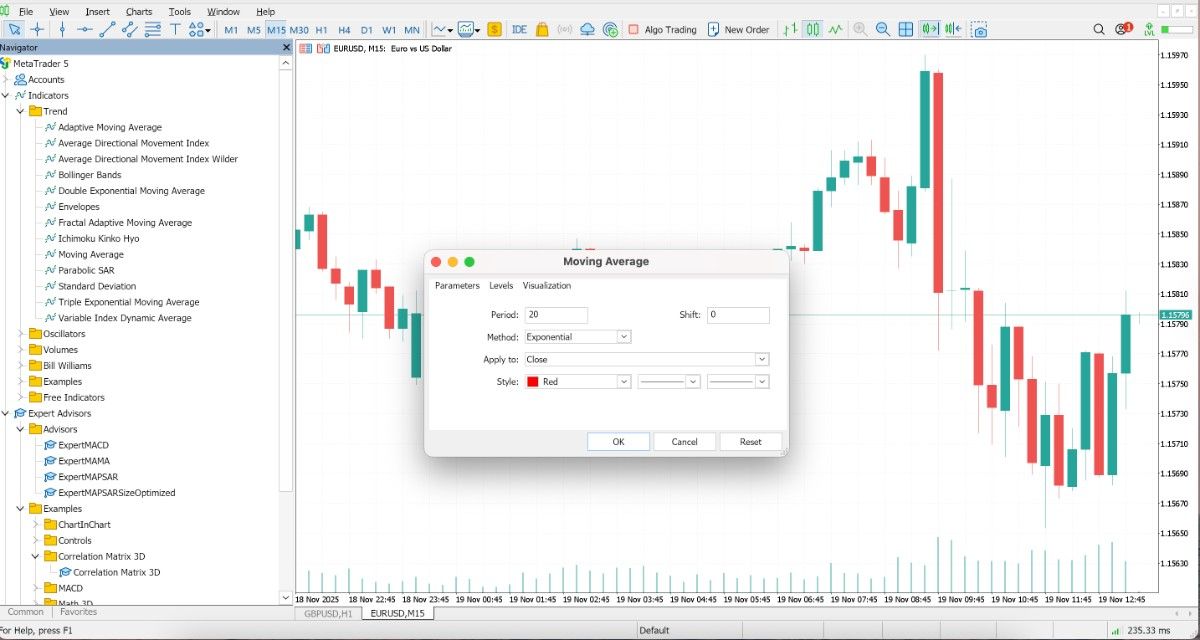
Depicted: Admirals MetaTrader 5, EURUSD 15-minute chart showing the settings of the EMA indicator. Date captured: 19th November 2025. This image is for informational and educational purposes only. Past performance does not guarantee future results.
- Period refers to the ‘look-back’ period over which the EMA indicator will be calculated. The greater the period, the smoother the line; and vice versa, the smaller the period, the more sensitive the indicator will be to price changes.
- Common selections that traders use include EMA 5, 10, 20 for short-term signals, 10 to 25 for fast trend curves, and 100 to 200 for long-term trend analysis. A 50-period EMA is often used as a mid-range setting.
- Shift setting works by offsetting the EMA indicator along the time axis by the number which you specify. The default value for this setting is 0.
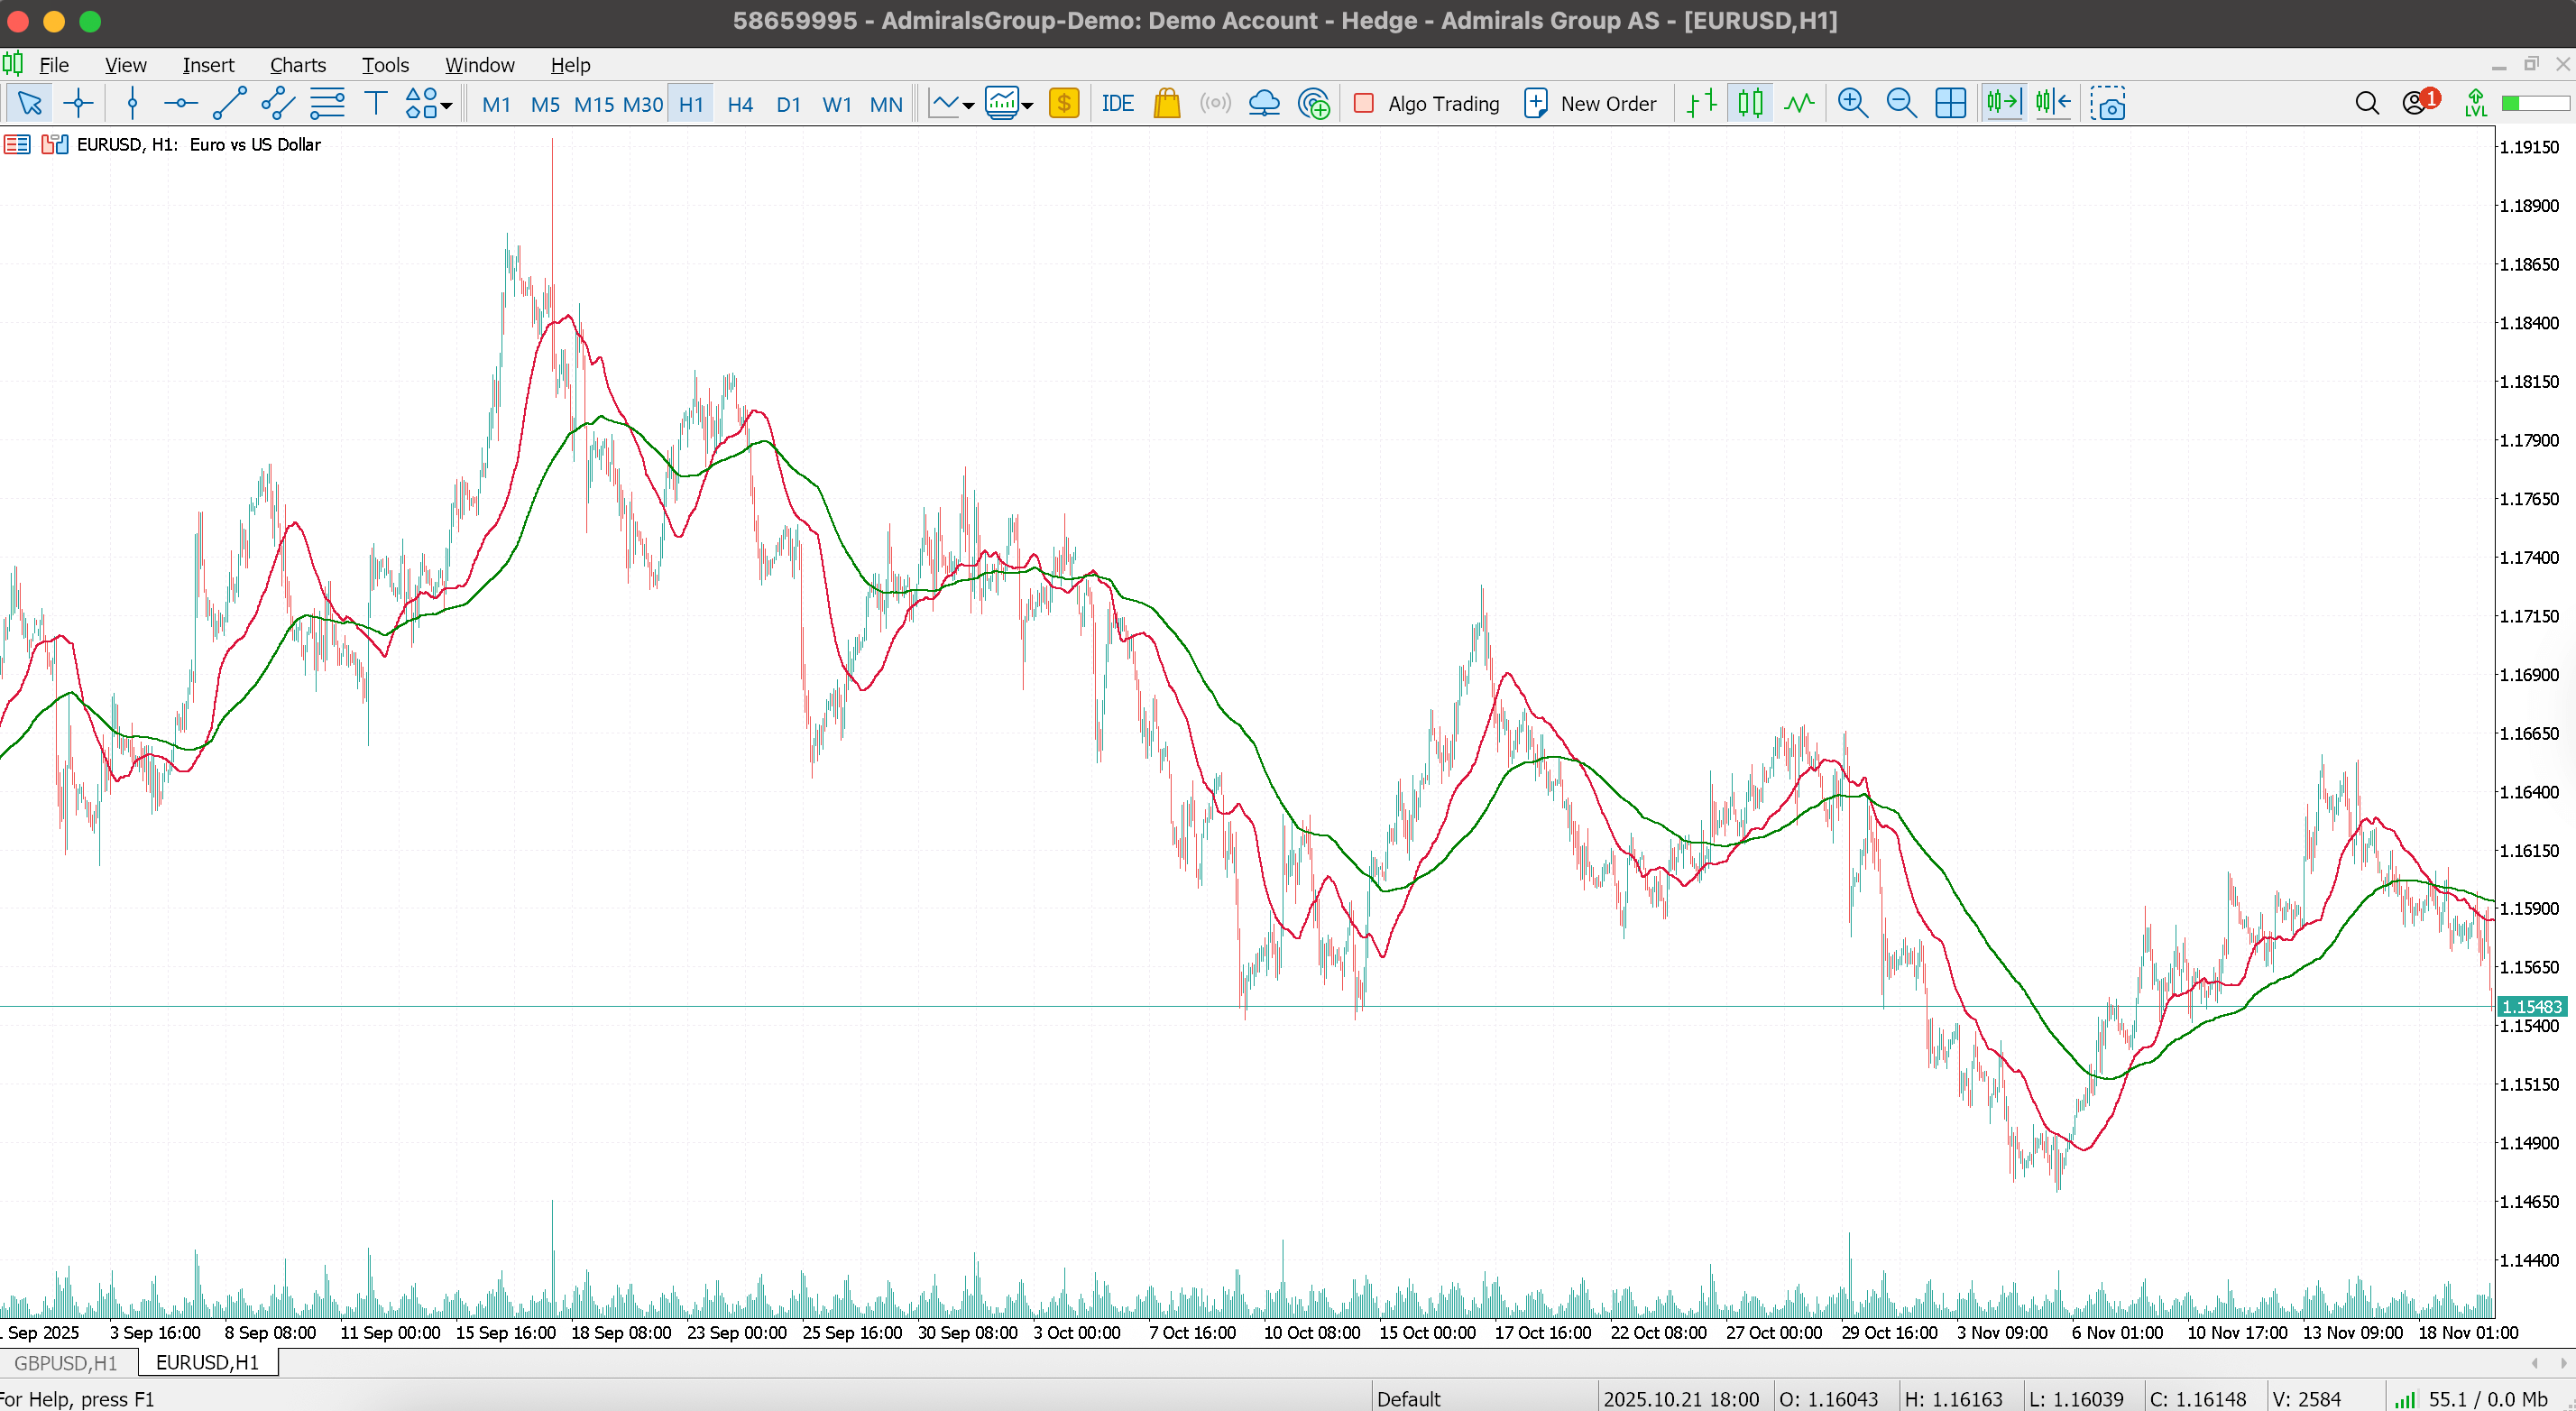
Below is an example of a 50-period EMA plotted on a one-hour EURUSD chart. The EMA line is much smoother than the underlying price movements; it filters out the noise and still manages to track the overall direction.
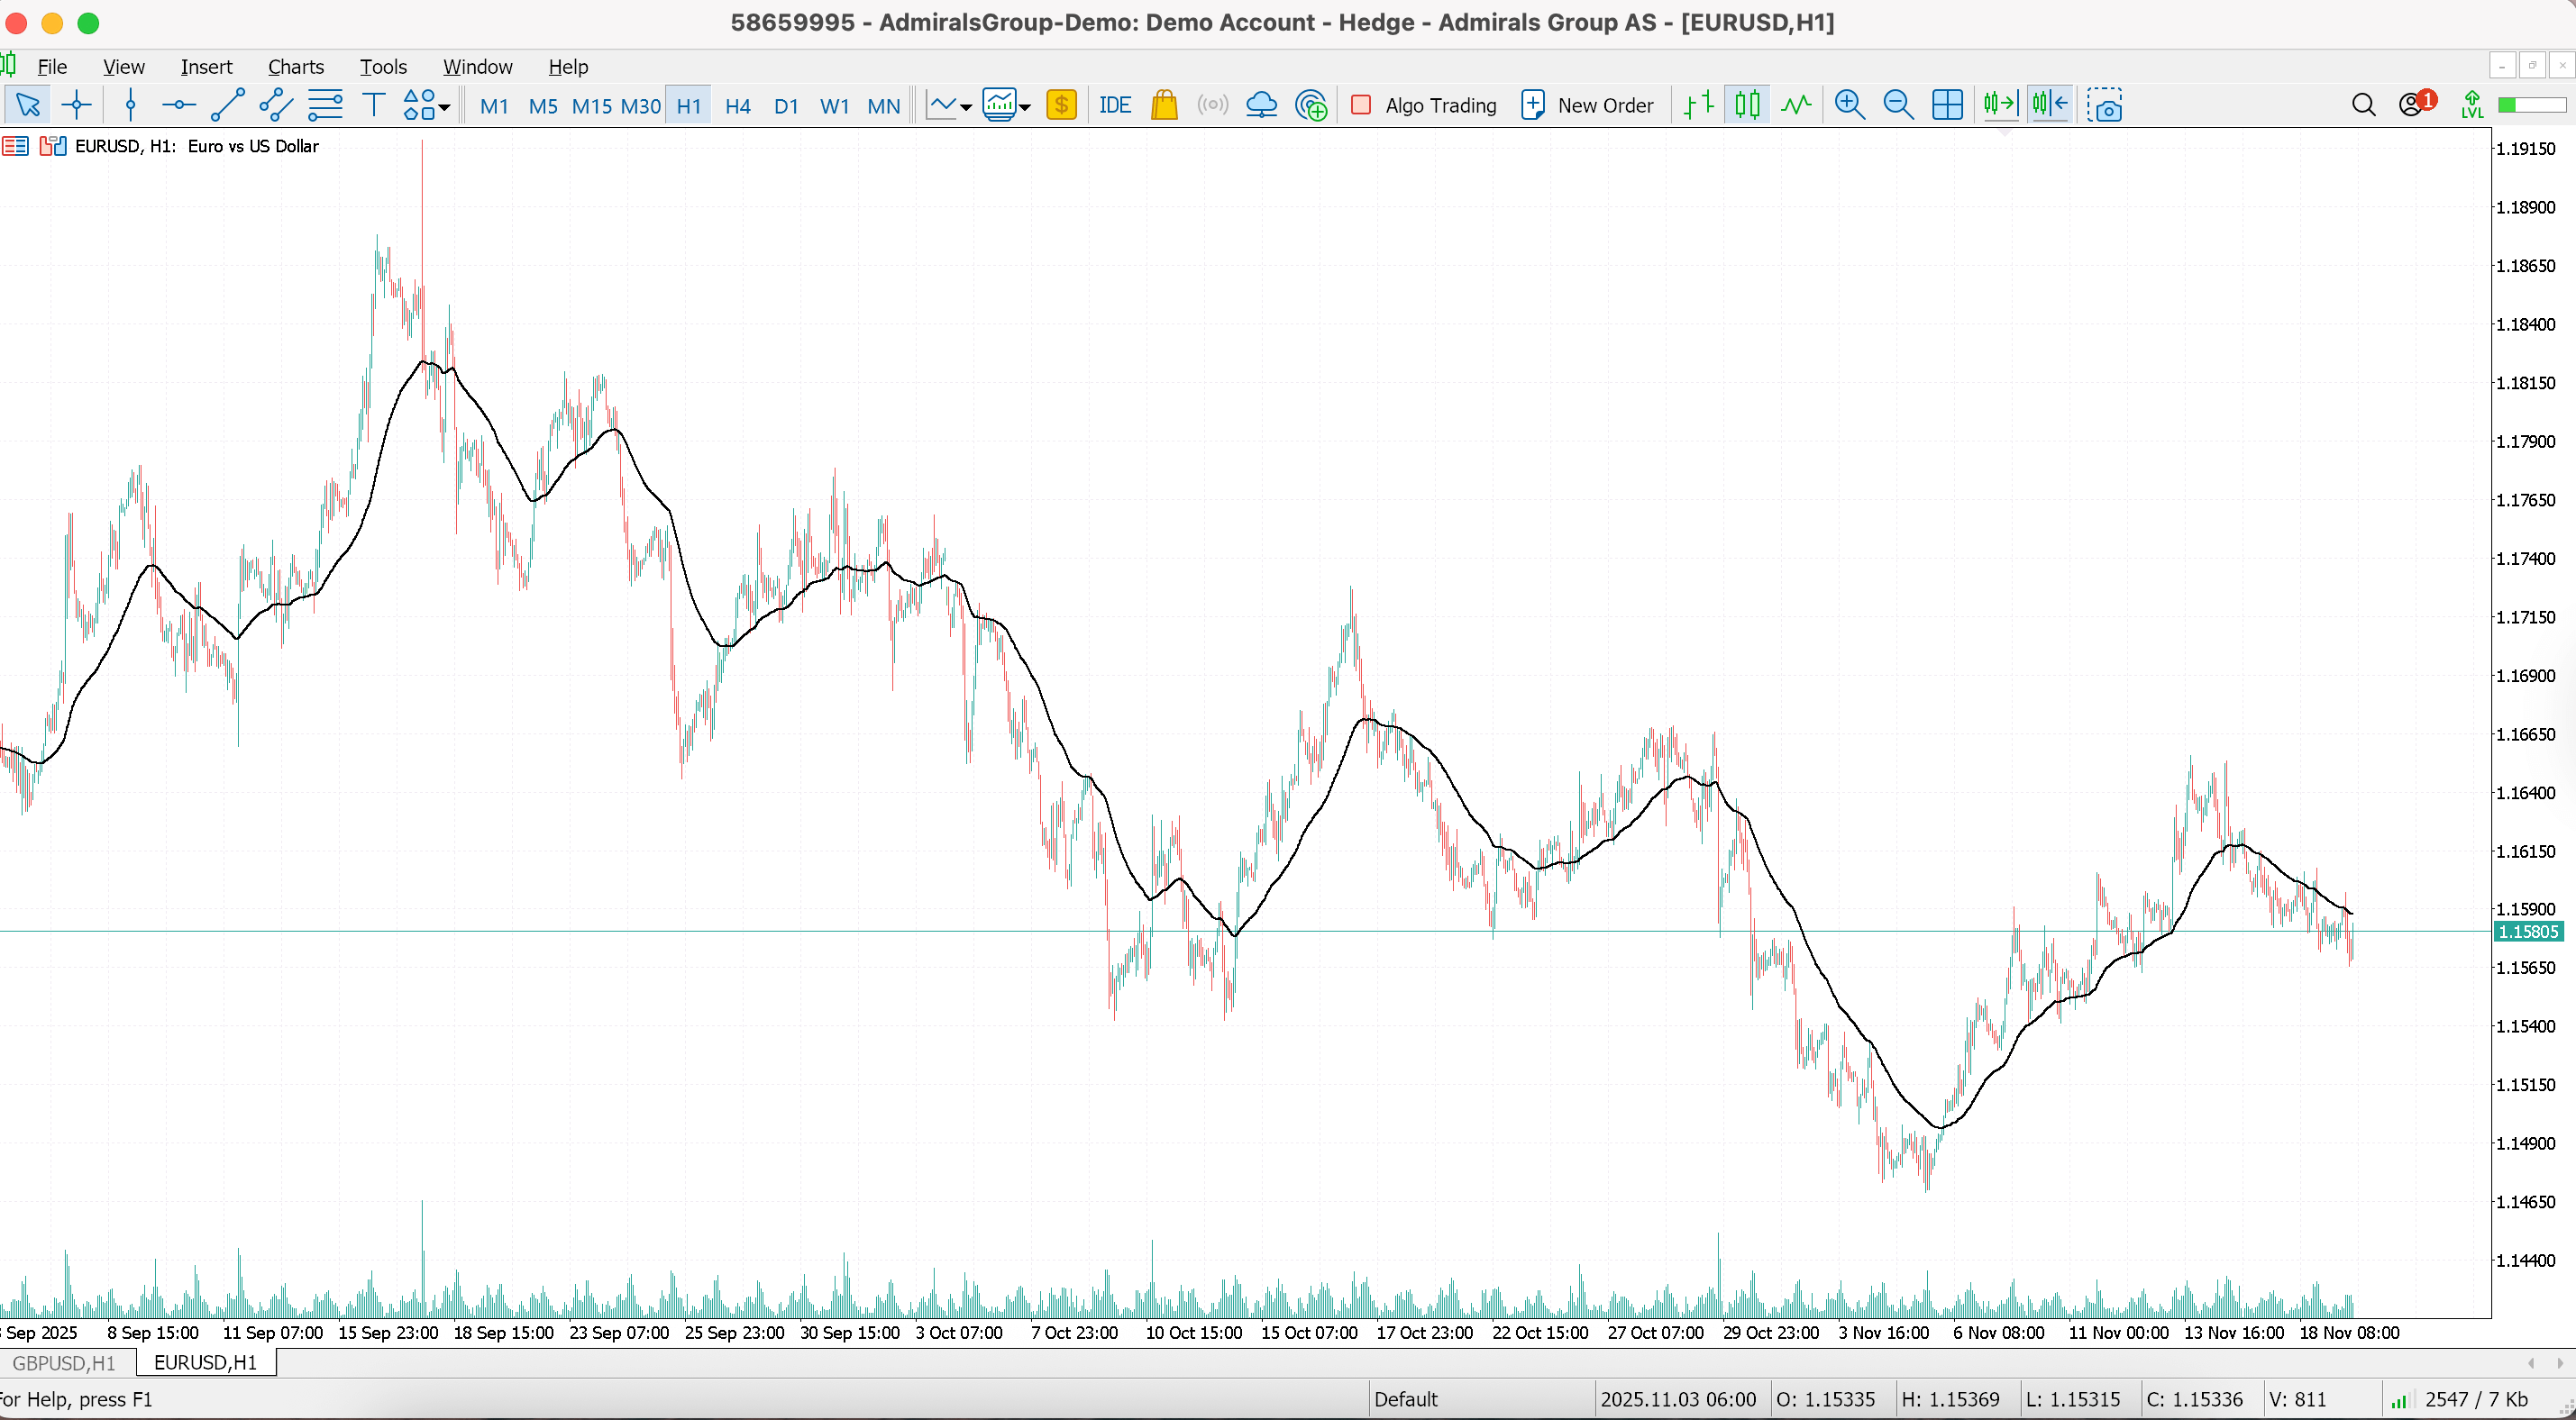
Depicted: Admirals MetaTrader 5, EURUSD 1-hour chart from 3 September 2025 to 19 November 2025. Date captured: 19th November 2025. This image is for informational and educational purposes only. Past performance does not guarantee future results.
EMA Indicator Settings and Period Selection
Choosing the right EMA indicator settings is an important part of adapting the tool to your trading style. But traders should remember that no EMA setting can guarantee profitable results and all trading involves risk.
While the process of adding the EMA to the chart in MT4 or MT5 is the same, the EMA period selection you choose will determine how responsive or smooth the line becomes. This choice should be made carefully since indicators can produce false signals in volatile or unexpected market conditions.
Shorter periods are more responsive to price changes, but traders should also be aware that higher responsiveness also carries a higher risk of whipsaws and potential losses. Conversely, longer periods filter out noise and show broader trends, but they may lag considerably and should not be used as the sole basis for a trading decision.
All of this makes it important for traders to match their EMA settings to the type of strategy they use and the market conditions they are trading, and to ensure they fully understand the risks involved before making any trading decisions.
The table below shows commonly used EMA periods by traders for different trading styles:
Before relying on any EMA setup, traders should test several period combinations on their chosen instrument and timeframe, ideally using a demo environment. This would help in identifying which settings align with your trading approach.
Building An Exponential Moving Average Strategy
A double exponential moving average strategy is commonly used by traders, where there is one short-term EMA and one long-term EMA. This EMA crossover method may create a potential trading signal when the shorter EMA crosses the longer one in either direction. However, traders should remember that the EMA crossover methods may give false or unreliable signals, and no indicator will ensure profitable outcomes.
For example, a trader might choose to use a 25-day EMA as the short-term line and a 100-day EMA as the long-term line. With this EMA crossover strategy, the trader may look to buy when the shorter-term EMA (25-day) rises above the longer-term EMA (100-day), which is called the golden crossover and may look to sell when the 25-day EMA falls below it, called the death crossover.
The chart below has a red line representing the 25-day EMA, while green is for a 100-day EMA.
Depicted: Admirals MetaTrader 5, EURUSD 1-hour chart from 1 September 2025 to 19 November 2025. Date captured: 19th November 2025. This image is for informational and educational purposes only. Past performance does not guarantee future results.
Common EMA Trading Mistakes
While the EMA can help traders interpret market trends, it does not predict the outcomes and cannot take away the risks inherent in trading. Problems often arise when traders place too much confidence in an EMA trading system or assume that a single indicator can reliably guide decisions in all market conditions. Unfortunately, this may lead to improper risk management or unrealistic expectations of returns.
Some common EMA-related mistakes traders often make:
- Treating EMA entry signals as guarantees rather than as observations that may or may not align with future price movement.
- Using EMA periods unsuited to the timeframe or volatility of the market, which can reduce effectiveness and increase the risk of misleading signals.
- Relying on crossovers without seeking EMA confirmation from broader market context.
- Adjusting EMA settings repeatedly in an attempt to “force” the indicator to match recent outcomes which may lead to overfitting.
- Allowing emotions such as frustration or urgency to influence decisions more than analysis which can increase risk and should be avoided in all forms of trading.
Advanced EMA Techniques and Combinations
More experienced traders often use the EMA as part of broader analytical frameworks rather than in isolation. A common approach is multi-timeframe analysis, whereby EMAs from higher and lower timeframes are compared to understand broader direction while monitoring shorter-term fluctuations. Some traders also use Triple EMA setups to visualise momentum shifts more clearly.
Sometimes EMA is paired with other tools, such as using EMA with Fibonacci retracement levels to observe how price reacts around key zones. EMA backtesting may also be helpful to evaluate how specific settings have performed historically. But historical results do not indicate or guarantee future performance.
Final Thoughts
The EMA indicator helps smooth price data and highlight prevailing trends in MT4 and MT5. While it can support an EMA strategy by offering potential signals, such as through crossover techniques, it still remains a lagging indicator that reacts only after price has moved.
Its faster response compared with the SMA comes from assigning more weight to recent prices, though the curve will always depend on the period selected. A practical step for someone who is just starting out could be to test various EMA configurations in a free demo account and see which align with your trading style.
Article you might find interesting:
- The Top Forex Trading Indicators
- Five Forex Indicators That Every Trader Should Know
- Top Forex Fundamental Indicators Explained
Frequently Asked Questions
What is EMA in forex trading?
EMA stands for Exponential Moving Average. It is one of the most important technical indicators in trading and is very commonly used for trend analysis. Unlike the SMA, the EMA gives a relatively high weight to the most recent price data, thereby making it more responsive to changes in the market.
How can traders benefit from using the EMA indicator?
The weighting mechanism enables the EMA to adapt quickly to evolving market conditions, making it a preferred choice for traders seeking timely insights into price movements and potential trend changes. A word of warning: faster response does not necessarily mean an accurate response, and EMAs can also give False or unreliable signals on occasion, especially in very volatile or unpredictable markets.
How can I download the EMA indicator for MT4?
The EMA indicator is inbuilt within MT4 and MT5, and traders may add it from the Indicators section.
What time period should I use for the EMA indicator?
EMA period selection may vary, since traders might choose different duration settings depending on volatility, strategy type, and personal risk tolerance.
How can I backtest my EMA trading strategy?
You can backtest an EMA strategy in MT4 or MT5 using the Strategy Tester, noting performance never guarantees future results.
What common indicators work well with EMA?
Indicators that might complement the EMA include RSI, MACD, and Fibonacci tools, though combining methods never assures reliable signals or outcomes.
About Admirals
Admirals is a multi-award-winning, regulated Forex and CFD broker, offering trading on over 8,000 financial instruments via the world's most popular trading platforms: MetaTrader 4 and MetaTrader 5.
The given data provides additional information regarding all analysis, estimates, prognosis, forecasts, market reviews, weekly outlooks or other similar assessments or information (hereinafter “Analysis”) published on the websites of Admirals investment firms operating under the Admirals trademark (hereinafter “Admirals”) Before making any investment decisions please pay close attention to the following:
- This is a marketing communication. The content is published for informative purposes only and is in no way to be construed as investment advice or recommendation. It has not been prepared in accordance with legal requirements designed to promote the independence of investment research, and that it is not subject to any prohibition on dealing ahead of the dissemination of investment research.
- Any investment decision is made by each client alone whereas Admirals shall not be responsible for any loss or damage arising from any such decision, whether or not based on the content.
- With view to protecting the interests of our clients and the objectivity of the Analysis, Admirals has established relevant internal procedures for prevention and management of conflicts of interest.
- The Analysis is prepared by an analyst (hereinafter “Author”). The Author Amrita Kundu is a contractor for Admirals. This content is a marketing communication and does not constitute independent financial research.
- Whilst every reasonable effort is taken to ensure that all sources of the content are reliable and that all information is presented, as much as possible, in an understandable, timely, precise and complete manner, Admirals does not guarantee the accuracy or completeness of any information contained within the Analysis.
- Any kind of past or modelled performance of financial instruments indicated within the content should not be construed as an express or implied promise, guarantee or implication by Admirals for any future performance. The value of the financial instrument may both increase and decrease and the preservation of the asset value is not guaranteed.
- Leveraged products (including contracts for difference) are speculative in nature and may result in losses or profit. Before you start trading, please ensure that you fully understand the risks involved.