The Top Forex Technical Indicators
Those new to Forex trading can often feel overwhelmed by technical analysis when they first discover it. There are hundreds of different indicators to put on your charts when trading the financial markets and choosing the right ones to suit your trading style and strategy is crucial.
In this article, we will introduce you to some of the top Forex technical indicators available from the four main groups of indicators - trend, momentum, volatility and volume - and demonstrate how they work. Afterwards, we will provide an example of a day trading strategy using three technical indicators.
Table of Contents
Forex Indicators: An Introduction
Technical indicators are mathematical tools that analyze one of the five following figures: open price, high, low, closing price and volume. As a result of the calculation, technical indicators are plotted graphically as chart patterns. Sometimes they overlay the price chart and, sometimes, they are drawn in a separate window. There are literally thousands of Forex technical indicators out there and, furthermore, anybody with coding skills can write their own, but keep in mind that there is only so much information that will actually be of use to you.
Another thing to keep in mind is that the majority of technical indicators were developed long before the internet and were actually designed for the stock or commodities markets and for high timeframes - as 24 hours was about as often as trading charts were updated.
What Analysis Paralysis Is
Novice traders often believe more is better, but more indicators on a chart does not necessarily mean more information or better trading decisions. Many technical indicators do not provide added information; they are alternatives or duplicates.
There is no advantage gained by having so much data on your chart that the information becomes convoluted and impossible to interpret. Your efforts will become counter-productive because hesitancy can develop when deciding to execute a market order.
Technical indicators are only tools and, in the wrong hands, they can produce inaccurate results.
Your mission is to interpret the technical indicators you have placed on your charts to generate a signal for you to decide whether to enter the market, adjust your stop-losses, take partial profit or close a trade.
Are you looking to use these tools and indicators in your future trading? Are you already using a compatible trading platform to do so? If not, click the banner below and start trading on the world's most premiere multi asset platform!

Forex Indicators: The Four Types
Technical indicators fall into four main categories: trend, momentum, volatility and volume.
Some indicators get classed into two groups and are open to interpretation about what group they should belong to. For instance, some analysts suggest the MACD (Moving Average Convergence Divergence) is both a trend and momentum indicator and that the RSI (Relative Strength Index) is momentum and volatility.
In the following sections, we will look at the four categories of indicators in more detail and provide examples of each.
Trend Indicators
Trading with the trend is a method that many experienced traders will tell you provides an optimal chance to succeed. The idea that you will profit by trading with the trend rather than against it is a logical one.
That’s not to say counter-trend strategies don’t work. They do, in specific circumstances. However, identifying the trend and trading with its direction (not against it) makes sense in probability outcomes.
Trading wisdom suggests that markets trend 30% of the time but range 70%. If that statement is a fact, you can only trend trade 30% of the time markets are open. So, if you are a trend trader, you need to take advantage of a trend phenomenon while it’s in play.
Average Directional Movement Index (ADX)
The ADX Indicator is a lagging Forex technical indicator designed to show the strength of a trend and is derived from two directional indicators: +DI and -DI.
The DI's (Directional Movements) are a calculation of how a current day's highs, lows and closing prices are related to the previous day's highs, lows and closing prices. The sum of these figures is then divided by the Average True Range (ATR), which we will cover later in this article.
In essence, the +DI tells us how strong the bull is today, compared to yesterday, while the -DI informs us as to how strong the bear is today, compared to yesterday. The ADX takes the values of +DI and -DI, and tells us who is stronger today, compared to yesterday - the bull or the bear.
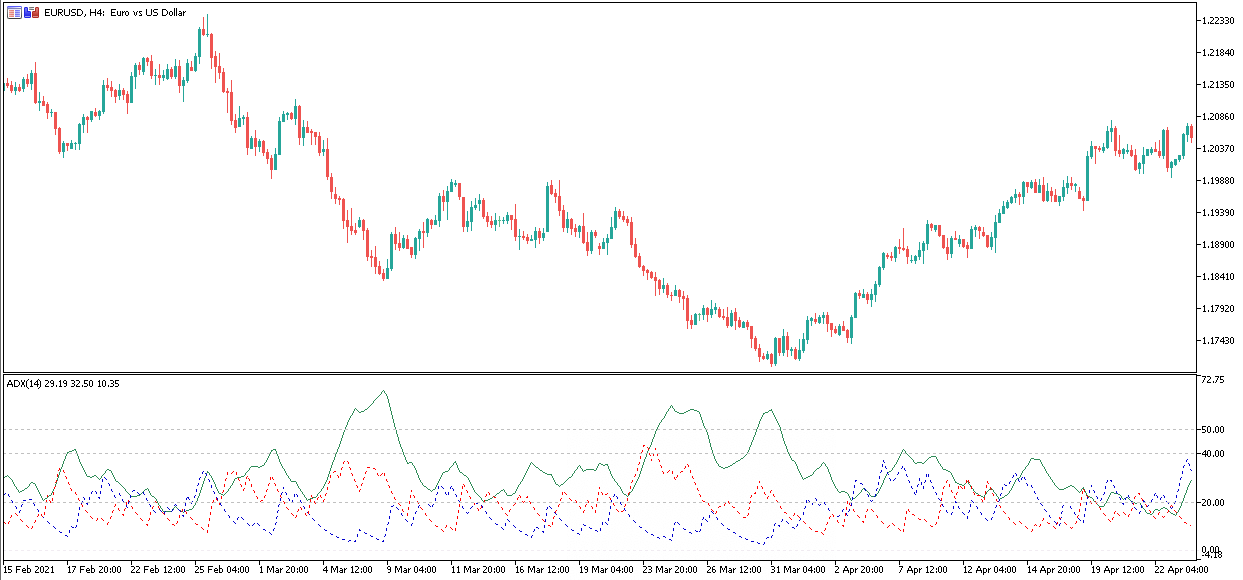
The indicator is composed of three lines; the ADX itself (solid green line), the +DI (dotted blue line) and the -DI (dotted red line), all moving along a scale of 0 to 100. If the ADX is below 20, the trend (whether bullish or bearish) is weak. The threshold of 40 indicates a trend, and everything above 50 is a strong trend. If the +DI is above the -DI, the bull is overpowering the bear. The inclination of the lines also has value, demonstrating how fast the rate of change is.
Moving Average Convergence/Divergence (MACD)
The MACD indicator is designed to reveal changes in the strength, direction, momentum and duration of a trend. The indicator displays the relationship between two exponential moving averages (EMA), a 12-period EMA and 26-period EMA, by subtracting the latter from the former.
The indicator usually consists of:
- The MACD line - which is the result of the above calculation
- A 9-period EMA of the MACD line - which is known as the signal line and used to generate buy and sell signals
- A histogram - which plots the distance between the MACD line and the signal line
In the MetaTrader trading platforms, however, the MACD which comes as standard displays the MACD as a histogram instead of a line and uses a 9-period simple moving average (SMA) as the signal line - as shown in the chart below.
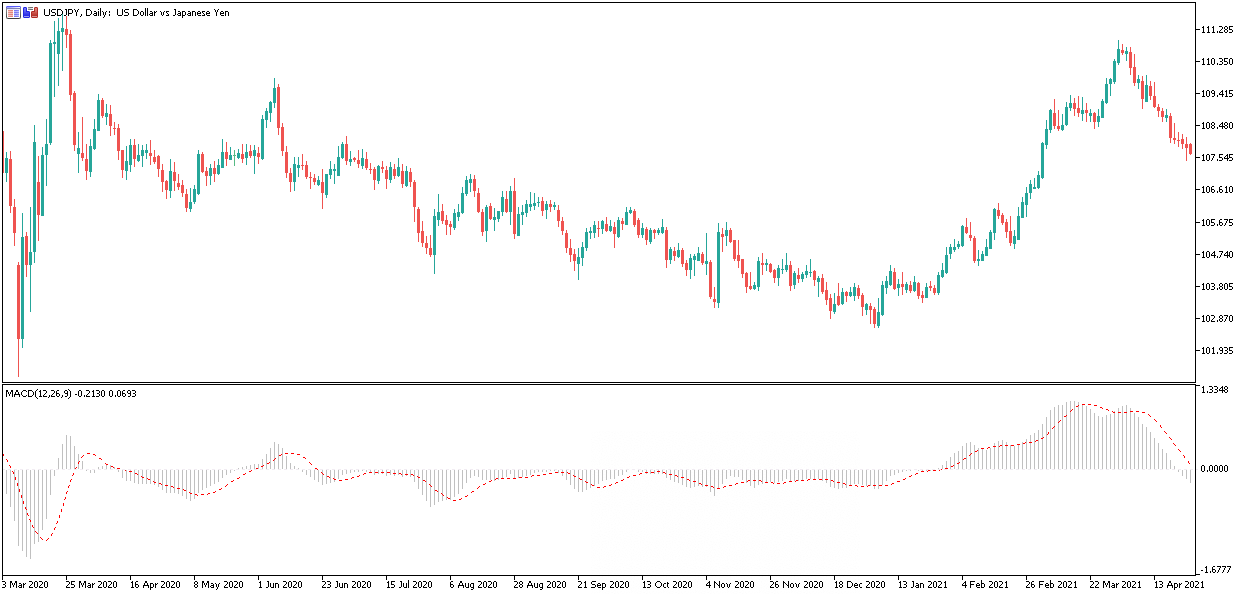
Irrespective of the differences, the MACD indicator is often used to identify divergences. A divergence occurs when the security’s price makes a higher high, or a lower low, that is not supported by the histogram also making a higher high or a lower low. A divergence hints at the change in the price direction.
Momentum Indicators
Momentum indicators, also referred to as oscillators, can help you pinpoint overbought and oversold conditions.
They illustrate the velocity and magnitude of a security’s price movements. Together with trend indicators, they can help to identify the beginning and end of a trend.
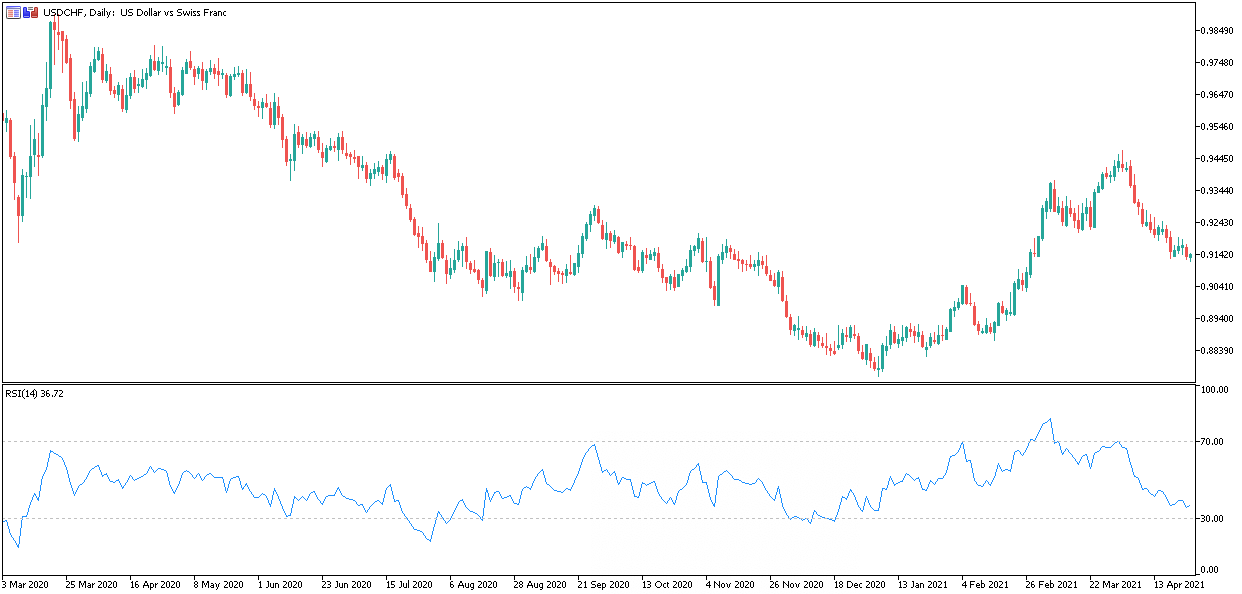
Relative Strength Index (RSI)
The Relative Strength Index (RSI) indicator is a very popular momentum indicator, which signals how much relative strength is left in the market move when the motion (momentum) may have become exhausted.
The RSI compares the closing prices of the current and previous candles for the up and down trends and then turns the outcome into an EMA (or in some cases an SMA) and then calculates how the uptrend EMA relates to the downtrend EMA, when oscillated on a scale of 1 to 100. The larger the difference between today and yesterday - the stronger the momentum.
Therefore, if every close is higher than the previous one, the RSI will be oscillating upward. On the other hand, if every close is lower than the previous, the RSI will be oscillating downwards. Once the RSI reaches 70, the security is typically considered overbought and may be approaching a trend reversal. Conversely, a value of 30 indicates the security is oversold.
The RSI is no stranger to the concept of divergence. If the security’s price makes a higher high, while the RSI only makes a lower high, a bearish signal is generated and vice versa.
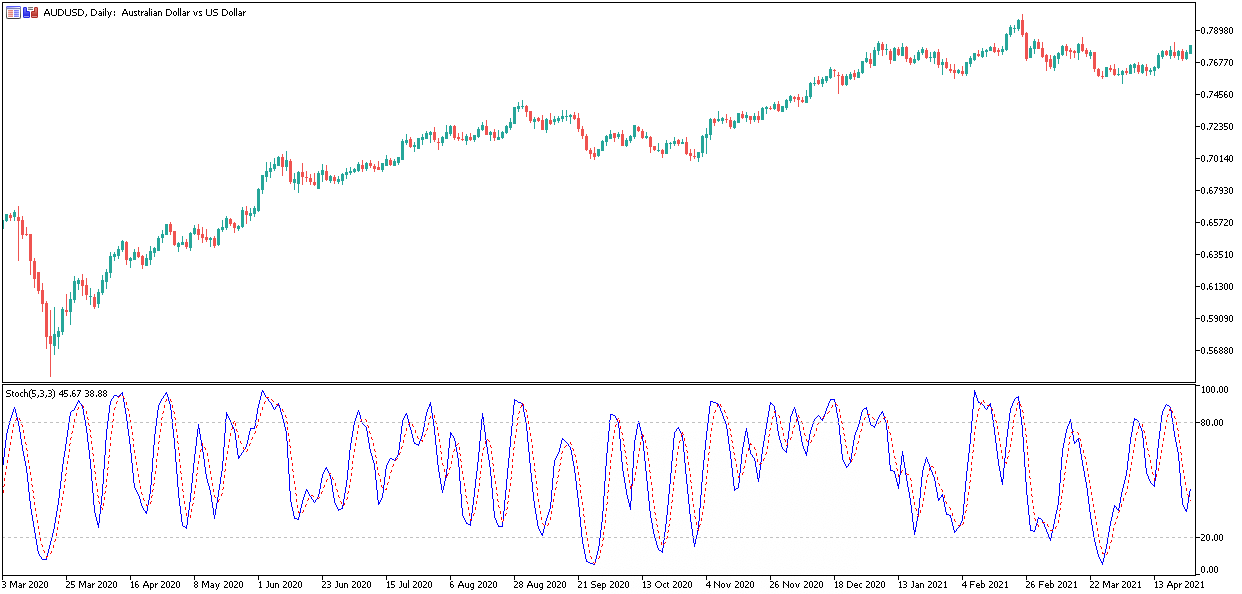
Stochastic Oscillator
The Stochastic Oscillator helps to identify overbought and oversold signals by measuring momentum. In the case of the Stochastic, it is done by comparing a particular closing price to a range of prices over a period of time.
In an uptrend, the price should be closing near the highs of the trading range, and during a downtrend, it should be near the lows. Like the RSI, the Stochastic is plotted between a 0 to 100 corridor. Typically speaking, readings above 80 are considered to be overbought, whilst readings below 20 are considered oversold.
Volatility
Volatility indicators identify ranges while revealing the volume behind the movement. They tell traders about the current direction of the market and can be used to predict future price movements. A sudden change in market sentiment can often generate an entry signal.
Just like all the previously described Forex technical indicators, volatility-based indicators monitor changes in the market price and compare them to historical values.
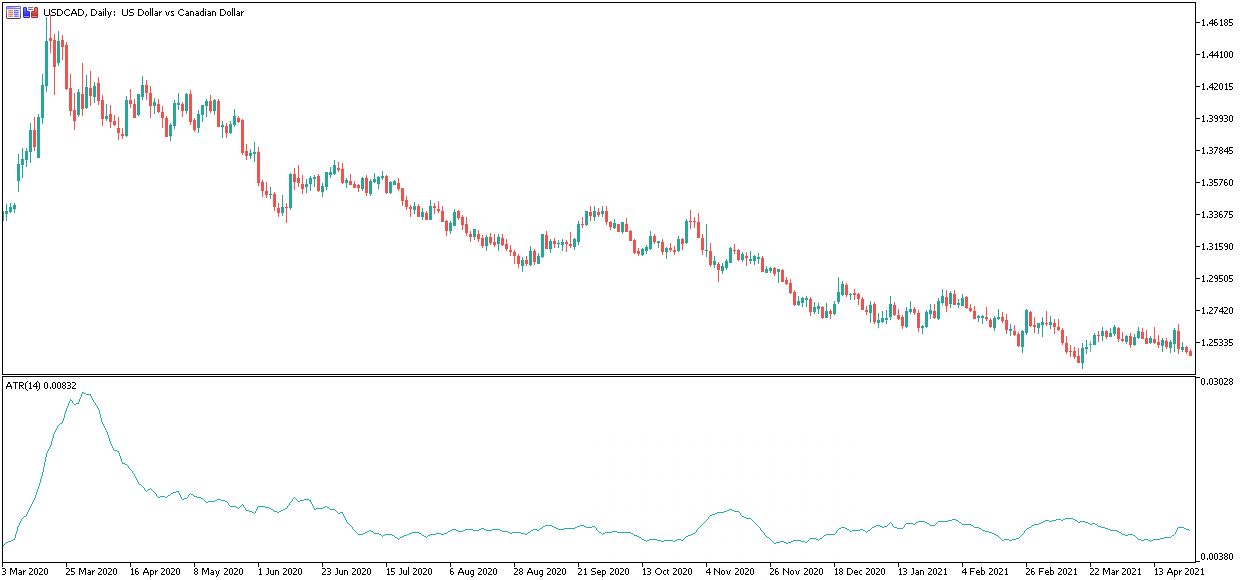
Average True Range (ATR)
The Average True Range Indicator measures the volatility of the market by considering the current high and low and the previous closing price. The ‘true range’ is then defined as the greatest of the following:
- Current high minus the current low
- The absolute value of the current high less than the previous close
- The absolute value of the current low less than the previous close
The ATR is then displayed as a moving average, by default 14-period, of the true ranges. The higher the ATR goes, the higher the volatility in the market and vice versa.
The ATR has limited use for generating trading signals, however, it is a useful tool for evaluating how much a market may move. This in turn provides the information to make key trading decisions, such as position size and where to place your trading stops and limits.
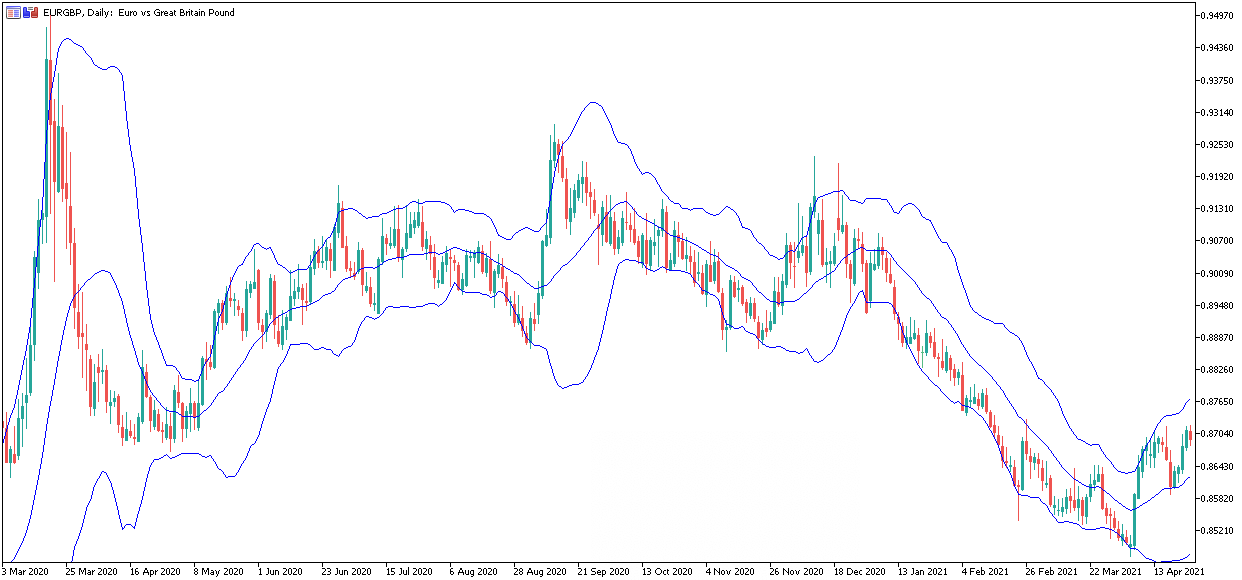
Bollinger Bands
Bollinger Bands are another volatility indicator, which consists of three bands - an SMA (with default value of 20) enveloped by two additional trendlines, calculated thus:
- Lower band = SMA minus two standard deviations
- Upper band = SMA plus two standard deviations
The result is a dynamic corridor for the security’s price to bounce around in. All the values can be adjusted according to the preferences of the trader.
When the prices are near the upper deviation line, the market is considered overbought and when at the lower deviation line, the market is considered oversold. Furthermore, in a more volatile market, the Bollinger Bands will widen and in a less volatile market, they will contract.
Volume Indicators
Volume indicators show the volume of trades behind a price movement. If more traders enter the market, they must have their collective reasons. Are they reacting to an economic calendar release or a breaking news event?
Measuring the total market volume of the Forex spot market is impossible at the rate and depth required by traders, unlike, say in stocks, commodities, or even Forex futures. This is because Forex spot is traded over-the-counter (OTC), which means that there is no single clearing location to recalculate volumes.
The volume that is available at your platform is derived from your broker's own data stream. Those numbers do not even remotely begin to report the total worldwide volume. Nonetheless, there are traders that involve volume indicators in their Forex trading, and some of them might even be successful at it.
Are you interested in practicing your trading skills without putting any of your real funds at risk? Why not register for a demo account and practice your trading under real and live market conditions with virtual funds? Register by clicking the banner below:

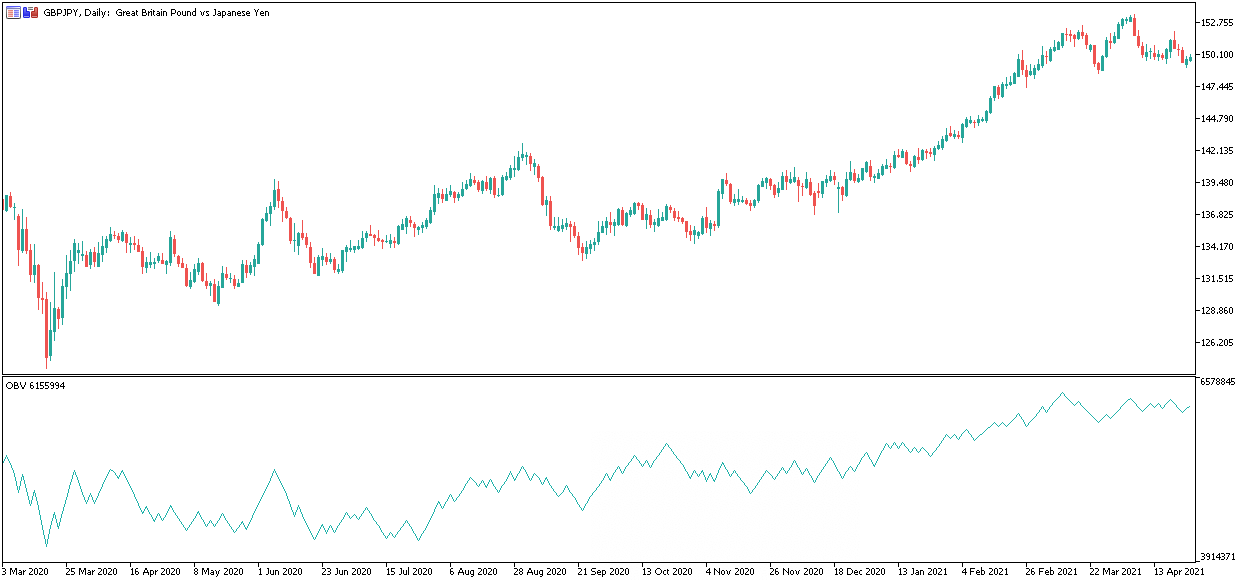
On-Balance Volume (OBV)
The OBV Indicator is used to measure increases or decreases in the volume of a traded instrument, relative to its price. This follows the idea that volume precedes price and that it can, therefore, be used to confirm price moves.
Total daily volume is assigned a positive number if it increases, in comparison to the previous day. Similarly, a negative value is assigned if total volume has decreased since the previous day. When prices go strongly in one direction, so too should the OBV. A divergence between the price and the OBV would indicate a weakness in the market move.
Top Forex Indicator: How to Choose?
Choosing which is the top technical indicator is a subjective exercise. The technical indicators you choose will depend on many factors, including your style, method and overall strategy. Therefore, the top Forex indicator is the one (or combination) that works for you.
If you are a swing trader looking to identify the start and finish of a swing or trend, then trend and momentum indicators could prove to be invaluable. In contrast, a scalper operating off a one-minute timeframe will have little use for either.
Day traders are the ones who are most reliant on technical indicators. They are looking for opportunities that present during the hours when they can be at their platforms. Many day-traders will use combinations to generate signals, which may occur when economic calendar data and events are published or broadcast.
How to Use Technical Indicators for Day Trading
Combinations of indicators are ideal for many day trading strategies. For this illustration of a day trading opportunity, we are using Bollinger Bands, the RSI and the MACD on an H1 timeframe.
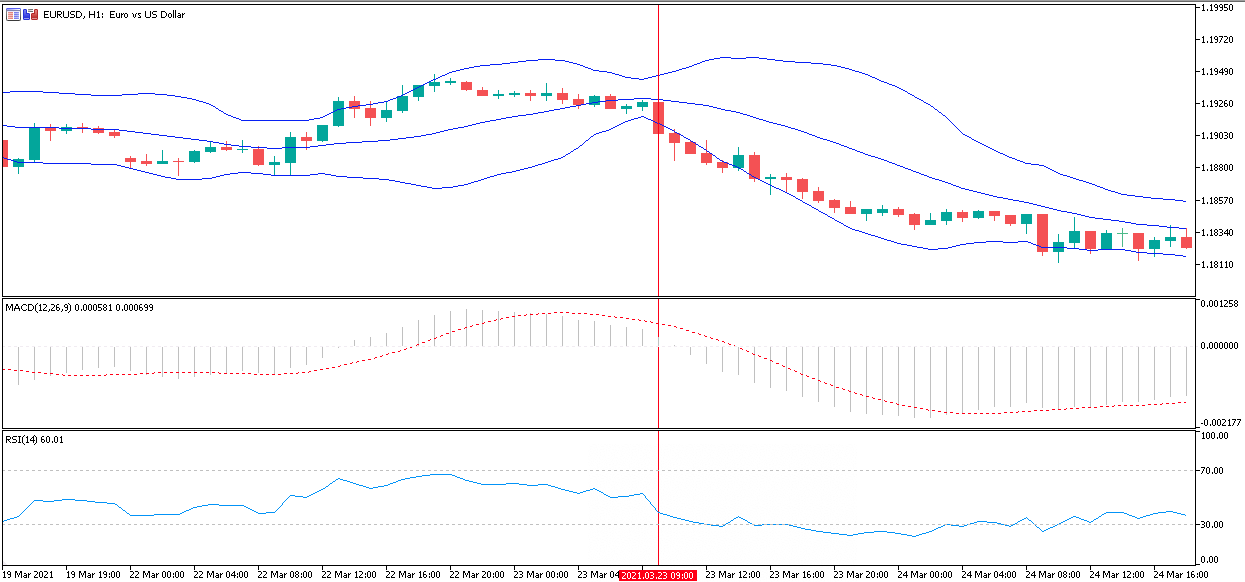
Several day trading opportunities occurred during the sessions in question. But perhaps the most prominent which corresponded with the required criteria appeared on the morning of 23 March.
EUR/USD fell sharply, the MACD signal line fell below zero, and the histogram became negative, indicating a selling opportunity and a downtrend. The RSI fell below 50 but failed to breach the 30 levels indicating oversold sentiment. The Bollinger Bands expanded, marking the arrival of trading volume and increased confidence in the sustained volatility.
Our trader could have entered the trade and comfortably remained in their position until the afternoon or even held the transaction over into the following day’s sessions.
Shorting the market on the H1 timeframe, after the 8 am candle closed (as indicated by the vertical red line in the chart above), would have seen our trader enter at a price of approximately 1.1920. At 4pm on March 24, the price was at 1.1827, representing a potential gain of 93 pips.
Frequently Asked Questions
What are Forex indicators?
Forex indicators are tools used by traders to analyze and interpret market data in the foreign exchange (Forex) market. They provide insights into price movements, trends, and potential trading opportunities by processing historical and real-time market information.
How do Forex indicators work?
Forex indicators work by applying mathematical formulas or algorithms to price, volume, or other market data. They generate visual representations, such as charts or graphs, to help traders make informed decisions. Traders use these indicators to identify trends, confirm market conditions, and predict potential future price movements.
What are some common types of Forex indicators?
There are various types of Forex indicators, including trend-following indicators (e.g., Moving Averages), oscillators (e.g., Relative Strength Index), and volatility indicators (e.g., Bollinger Bands). Traders choose indicators based on their trading strategies and goals. It's important to note that no single indicator guarantees success, and traders often use a combination of indicators for a more comprehensive analysis.
INFORMATION ABOUT ANALYTICAL MATERIALS:
The given data provides additional information regarding all analysis, estimates, prognosis, forecasts, market reviews, weekly outlooks or other similar assessments or information (hereinafter “Analysis”) published on the websites of Admiral Markets investment firms operating under the Admiral Markets and Admirals trademarks (hereinafter “Admirals”). Before making any investment decisions please pay close attention to the following:
1. This is a marketing communication. The content is published for informative purposes only and is in no way to be construed as investment advice or recommendation. It has not been prepared in accordance with legal requirements designed to promote the independence of investment research, and that it is not subject to any prohibition on dealing ahead of the dissemination of investment research.
2. Any investment decision is made by each client alone whereas Admirals shall not be responsible for any loss or damage arising from any such decision, whether or not based on the content.
3. With view to protecting the interests of our clients and the objectivity of the Analysis, Admirals has established relevant internal procedures for prevention and management of conflicts of interest.
4. The Analysis is prepared by an independent analyst (hereinafter “Author”) based on the personal estimations of Alexandros Theophanopoulos (SEO and Content Specialist).
5. Whilst every reasonable effort is taken to ensure that all sources of the content are reliable and that all information is presented, as much as possible, in an understandable, timely, precise and complete manner, Admirals does not guarantee the accuracy or completeness of any information contained within the Analysis.
6. Any kind of past or modeled performance of financial instruments indicated within the content should not be construed as an express or implied promise, guarantee or implication by Admirals for any future performance. The value of the financial instrument may both increase and decrease and the preservation of the asset value is not guaranteed.
7. Leveraged products (including contracts for difference) are speculative in nature and may result in losses or profit. Before you start trading, please ensure that you fully understand the risks involved.