ADX Indicator: What It Is and How to Read It

The Average Directional Index (ADX) is a technical indicator that measures the strength of a trend. It runs on a scale of 0 to 100, with readings above 25 widely used to identify a trending market and readings below 20 suggesting the market lacks a clear trend. However, the ADX only measures how strong a trend is, it does not tell you which direction it’s moving in.
In this article, we look at what the ADX indicator measures, how it is calculated, how to set it up in MetaTrader 4 and how traders might use it as part of a wider strategy.
The information in this article is provided for educational purposes only and does not constitute financial advice. Consult a financial advisor before making investment decisions.
Table of Contents
Key Takeaways
- The ADX measures trend strength on a scale of 0 to 100. A rising ADX signals a strengthening trend regardless of whether price is moving up or down.
- Readings above 25 are typically associated with a strong trend, whilst readings below 20 suggest the market lacks a clear trend.
- The ADX is displayed alongside two additional lines: the Positive Directional Indicator (+DI) and the Negative Directional Indicator (-DI). These lines indicate whether a trend is bullish or bearish.
- The ADX is a lagging indicator, confirming whether or not a trend exists rather than predicting one.
What Is the ADX Indicator?
The Average Directional Index (ADX) is a technical indicator which was developed and introduced by J. Welles Wilder Jr. in his 1978 book New Concepts in Technical Trading Systems. Although originally designed for the commodity markets, it can be used across a range of other instruments, including forex and stocks.
The ADX measures the strength of a trend but not its direction. That means that a strong downtrend and a strong uptrend will both produce a high ADX reading.
How the ADX Indicator Works
The indicator consists of three distinct lines:
- The ADX Line: measures the overall strength of the trend
- The Positive Directional Indicator (+DI): tracks upward price movement
- The Negative Directional Indicator (-DI): tracks downward price movement
The ADX line is derived from the relationship between the +DI and -DI. It represents the gap between the two, expressed as a percentage of their combined total, smoothed over a set period.
The +DI and -DI lines provide the directional context which the ADX line does not. When the +DI sits above the -DI, upward price movement is dominant; when the -DI sits above the +DI, the opposite is true. The ADX line then indicates the strength of the dominant price move.
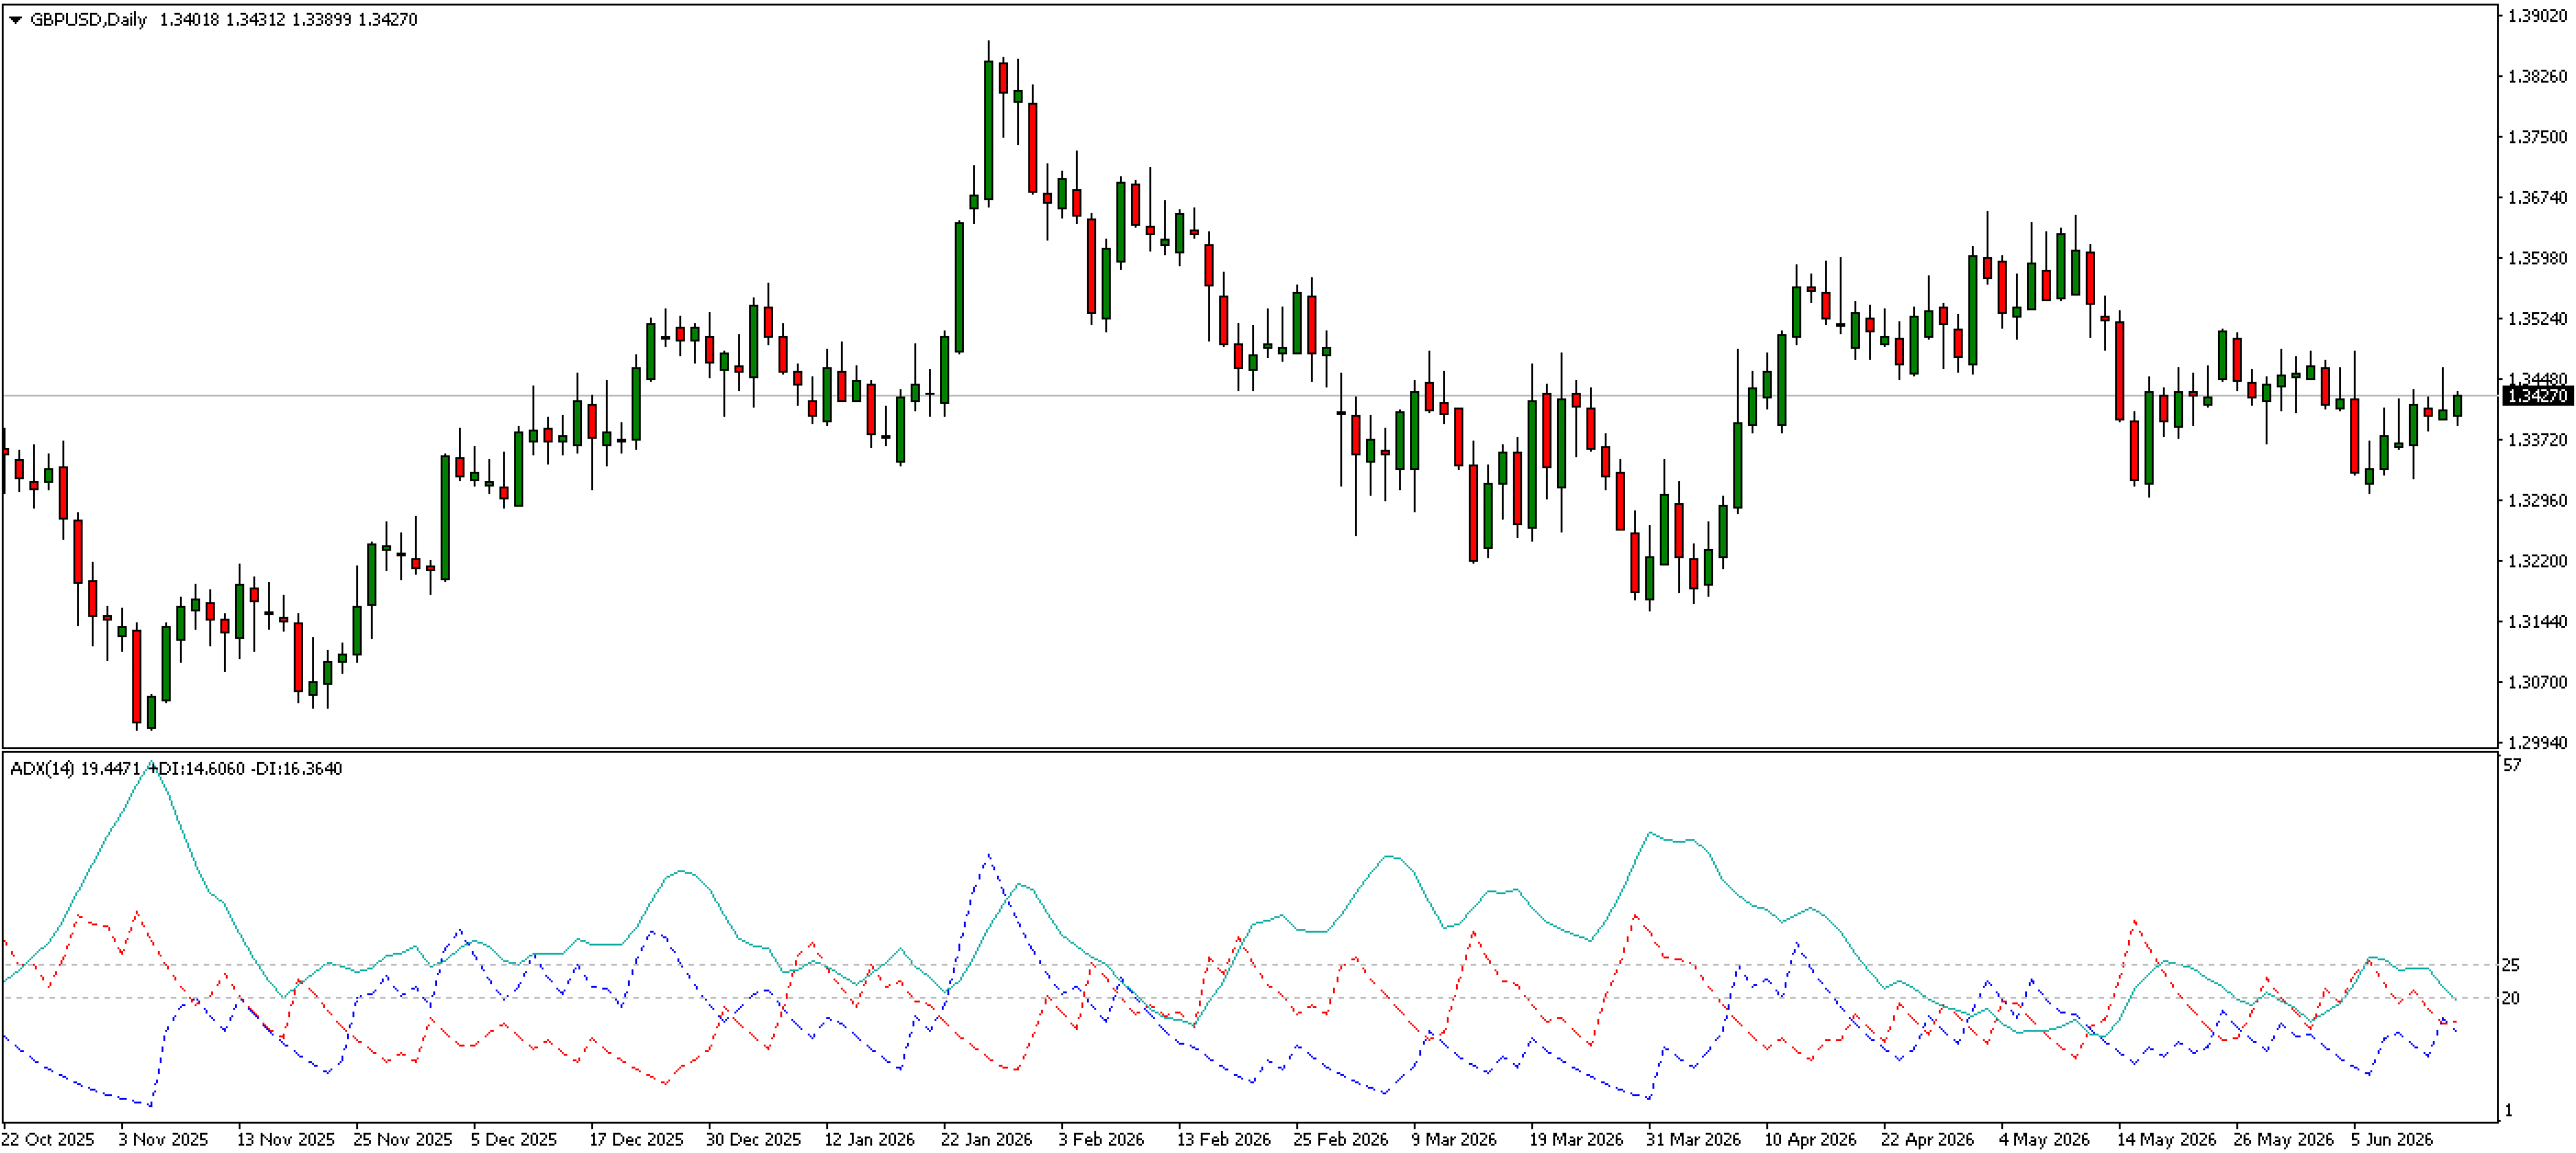
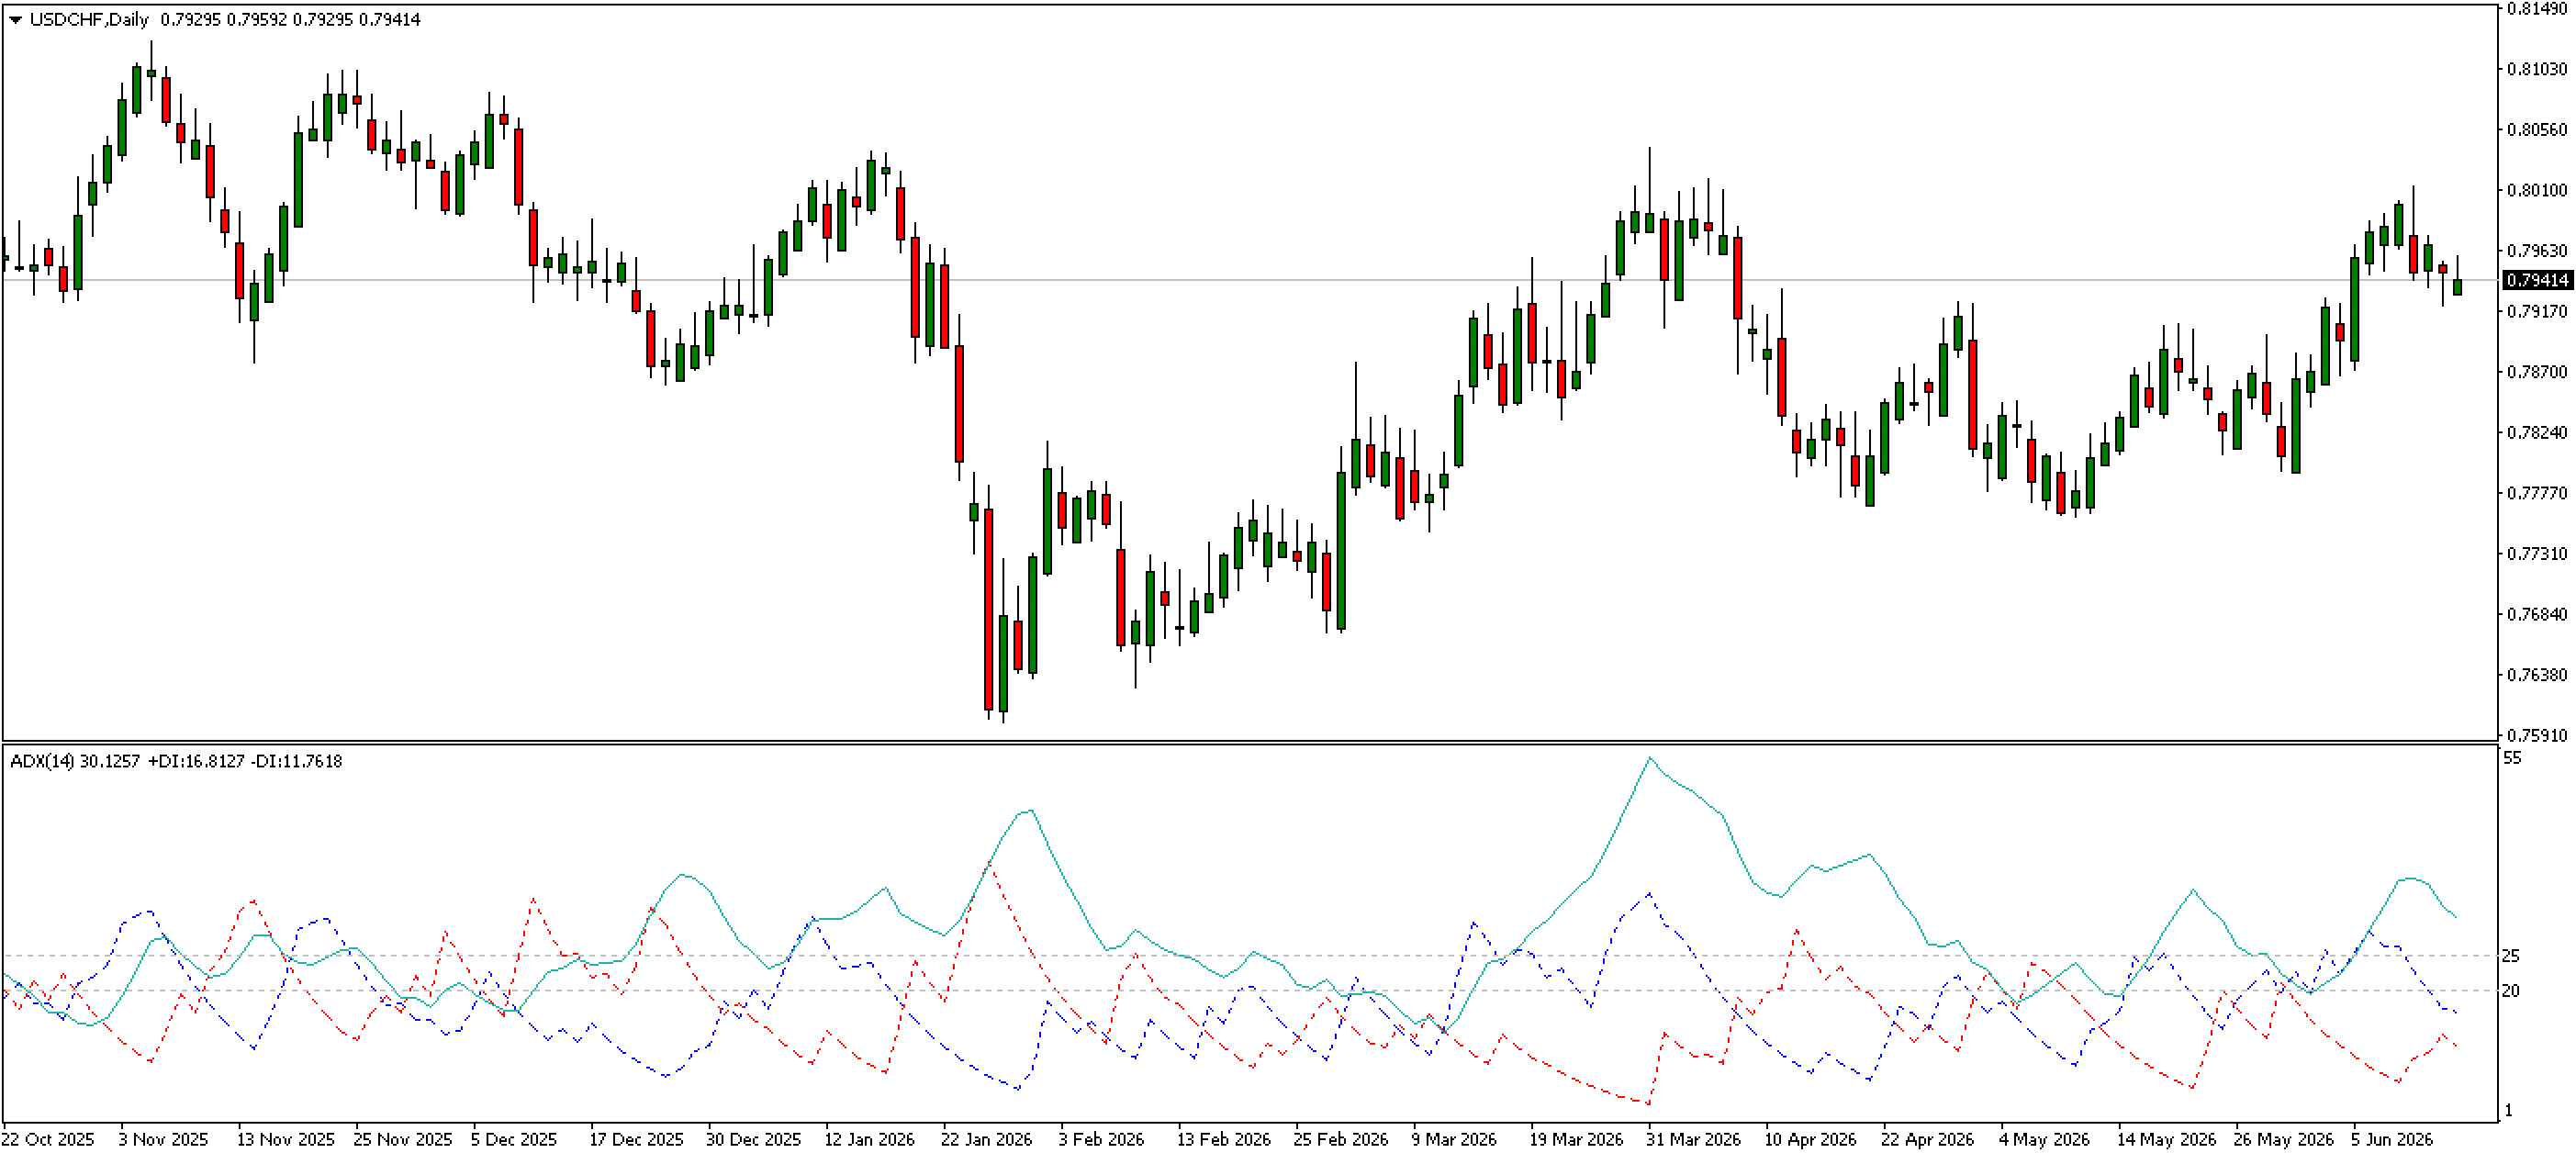
Below is a daily chart of GBPUSD with the ADX indicator added. In the chart, the solid green line represents the ADX line, whilst the dotted blue and red lines represent the +DI and the –DI, respectively.
How to Read the ADX Indicator
The ADX runs on a scale of 0 to 100. The higher the reading, the stronger the trend. The threshold most commonly used to identify a trending market is 25, although some traders may use 20 as an earlier signal.
ADX Values and Trend Strength
Readings between 20 and 25 sit in a grey area. The indicator may be picking up the early stages of a developing trend, but it has not yet crossed the threshold most traders consider meaningful.
A common misconception is that a falling ADX signals a trend reversal. A declining ADX means trend strength is fading, not that the trend is necessarily about to flip.
As long as the ADX remains above 25, the trend is still considered to be in effect, even if the line is heading lower. Only when the ADX drops below 20 and stays there does it suggest the market may have entered a ranging phase.
The ADX value alone gives no indication of direction. For that, traders can look at the relationship between the +DI and -DI lines:
- When +DI is above -DI the trend is bullish
- When -DI is above +DI the trend is bearish
- The wider the gap between the two lines, the stronger the move
A rising ADX alongside +DI above -DI points to a strengthening uptrend. The same rising ADX with -DI above +DI points to a strengthening downtrend.
Wilder's original trading system proposed using crossovers between the +DI and -DI as entry signals, with:
- The +DI crossing above the –DI treated as a potential long signal
- The -DI crossing above the +DI treated as a potential short signal
- The ADX being used to confirm whether the prevailing trend supports the trade
However, in modern practice, most traders use the ADX as a filter for signals generated by other indicators rather than relying on DI crossovers as standalone triggers.
ADX and Trend Momentum
Beyond identifying whether a trend exists, the ADX can help gauge how momentum is evolving. Rather than focusing on a single reading, watching the pattern of successive ADX peaks gives a clearer picture of where a trend stands.
A series of higher ADX peaks suggests momentum is building. A series of lower peaks suggests it is fading, even if the indicator remains above 25, and might be a signal to manage risk more actively.
ADX Divergence
The ADX can also be used to spot momentum divergence. In an uptrend, this occurs when price makes a higher high whilst the ADX makes a lower high. In a downtrend, it occurs when price makes a lower low whilst the ADX again makes a lower high.
In both cases the trend is still extending in its prevailing direction, but the strength behind the move is waning, suggesting the trend may be running out of steam.
How the ADX Indicator Is Calculated
The ADX is calculated by comparing upward and downward price movement between periods.
When price is consistently moving in one direction, the +DI and -DI lines pull apart; one rises whilst the other stays flat or falls. The wider that gap, the stronger the trend signal and, consequently, the higher the ADX reading.
When price oscillates without clear direction, the two lines stay close together and the ADX remains low.
The three components each play a distinct role:
- The +DI measures the strength of upward moves between periods
- The -DI measures the strength of downward moves in the same way
- The ADX expresses the gap between the two as a percentage of their combined total, smoothed over time into a reading on a scale of 0-100.
These values are smoothed using Wilder's own averaging method. It gives more weight to historical data than a standard exponential moving average, producing slower reacting, more measured output, which lags behind actual price movements.
However, in practice, traders don't need to calculate the ADX manually, as most trading platforms, including MetaTrader 4 and 5, will generate the ADX indicator automatically.
How to Use the ADX Indicator in MetaTrader 4
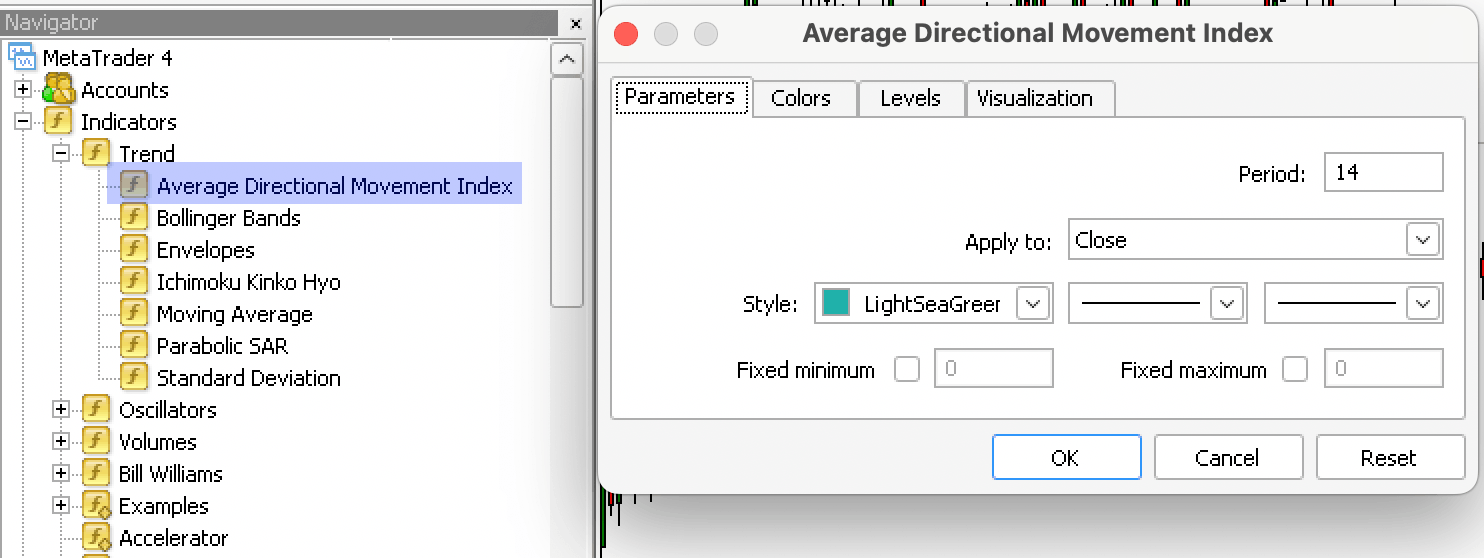
The ADX indicator comes built into MetaTrader 4 as standard, with no download required. It appears in the platform's indicator library, in the Trend folder, under the name Average Directional Movement Index.
The MT4 version uses a slightly different smoothing method than Wilder's original design, resulting in a more accurate but somewhat less smooth line.
To add it to a chart:
- Locate the indicator in the Navigator panel on the left-hand side of the platform
- Drag and drop it onto the chart, or double-click to open the settings dialogue box
- Set the period (the default is 14) and adjust line colours if preferred
- Click OK; the indicator will appear in a separate panel below the price chart
Levels can be added manually within the indicator properties. Adding horizontal lines at 20 and 25 makes it easier to identify when the ADX is crossing key thresholds.
How to Use the ADX Indicator in MetaTrader 5
MetaTrader 5 offers two different ADX options in the Trend folder of its indicator library, which can be confusing:
- Average Directional Movement Index: The standard MetaTrader option, equivalent to the MT4 indicator
- Average Directional Movement Index Wilder: Wilder's original formulation, using his own smoothing method
The Average Directional Movement Index produces a more accurate, but less smooth, indicator compared to the Wilder version. The Wilder version, which reacts more slowly to price changes, will be suited to those who want to replicate his original methodology precisely.
The process for adding either version to a chart follows the same steps as in MT4.
ADX Indicator Settings
The default period of 14 was Wilder's original recommendation and remains the most widely used setting.
However, the default settings may not be suitable for everyone. Traders may choose to adjust the period depending, amongst other things, on their trading style and strategy.
Adjusting the period changes how responsive the indicator is:
- A shorter period makes the ADX more sensitive to recent price changes. It reacts faster but may generate more noise.
- A longer period produces a smoother, slower-moving line that filters out more short-term fluctuations.
ADX Indicator Trading Strategies
The ADX is primarily used as a filter and a confirmation tool rather than a standalone signal generator.
Two common ways in which traders apply it are:
- As a trend filter to determine whether trend-following strategies or a range trading approach are appropriate
- To confirm breakouts by checking whether a move has sufficient momentum behind it
Using the ADX as a Trend Filter
One of the most common applications of the ADX is filtering signals generated by other indicators. A signal produced during a strong trend (ADX above 25) may carry more weight with traders than the same signal produced in a directionless market.
For example, a moving average crossover occurring when the ADX is above 25 and rising may be considered more significant than the same crossover taking place when the ADX is falling below 20.
In this case, when the ADX drops below 20 and stays there, trend-following approaches may be less effective. Consequently, traders may step back from trend-following strategies and look instead at approaches suited to range-bound markets, such as trading reversals at support and resistance levels.
Using the ADX to Confirm Breakouts
When price initially breaks out of a consolidation range, the ADX may be low, reflecting the directionless conditions that preceded the move.
If the ADX then crosses above 25, it could indicate that the breakout is gaining momentum and that a new trend is developing. If the ADX remains below 25 despite a price break, that may indicate the move lacks sufficient conviction. Consequently, some traders wait for ADX confirmation before acting on a breakout signal.
Limitations of the ADX Indicator
- Lagging Indicator: The ADX confirms trends after they have developed rather than predicting them. By the time it crosses 25, a significant amount of the move may already have occurred.
- Unreliable in Ranging Markets: Within any range, price still makes individual directional moves and the ADX can spike with each one, even on higher timeframes. A clean "ADX below 20 during consolidation" pattern may not be reliable in practice.
- No Directional Signal: The ADX measures trend strength only. A reading of 40 could reflect a strong uptrend or a strong downtrend.
As a consequence of the limitations above, the ADX is most effectively used as part of a wider approach, in combination with other technical indicators.
Other Articles You Might Be Interested In:
Frequently Asked Questions
What Does the ADX Indicator Measure?
The ADX measures the strength of a price trend on a scale of 0 to 100. It does not indicate direction; a rising ADX signals a strengthening trend regardless of whether price is moving up or down. Readings above 25 are widely associated with a strong trend, whilst readings below 20 suggest little or no trend.
How Do You Use the ADX Indicator?
Traders typically use the ADX to confirm whether a market is trending or ranging, often alongside another indicator that generates signals. A reading above 25 may be used to support trend-following approaches, whilst a reading below 20 suggests conditions may favour range-bound strategies instead.
What Is a Good ADX Reading?
There is no “good” reading per se, it depends on what a trader is looking for. A trader looking to use trend-following strategies may look for a reading above 25 to support their approach. On the other hand, when the ADX is below 20, it may be more appropriate for range-bound strategies.
Is the ADX a Lagging Indicator?
Yes. The ADX is calculated using smoothed averages of historic price data. This means it reflects what has already happened rather than predicting what is about to occur. By the time it confirms a trend, a significant chunk of the move may already have passed.
What Is the Difference Between ADX and ADXW in MetaTrader 5?
MetaTrader 5 offers two versions of the indicator. The standard ADX uses a modified smoothing method that produces slightly more responsive readings. The ADXW uses Wilder's original smoothing formula, which produces smoother, slower-moving lines. For many traders the standard version may be the more practical choice; the ADXW is suited to those wanting to replicate Wilder's original methodology precisely.
INFORMATION ABOUT ANALYTICAL MATERIALS:
The given data provides additional information regarding all analysis, estimates, prognosis, forecasts, market reviews, weekly outlooks or other similar assessments or information (hereinafter “Analysis”) published on the websites of Admirals investment firms operating under the Admirals trademark (hereinafter “Admirals”) Before making any investment decisions please pay close attention to the following:
- This is a marketing communication. The content is published for informative purposes only and is in no way to be construed as investment advice or recommendation. It has not been prepared in accordance with legal requirements designed to promote the independence of investment research, and that it is not subject to any prohibition on dealing ahead of the dissemination of investment research.
- Any investment decision is made by each client alone whereas Admirals shall not be responsible for any loss or damage arising from any such decision, whether or not based on the content.
- With view to protecting the interests of our clients and the objectivity of the Analysis, Admirals has established relevant internal procedures for prevention and management of conflicts of interest.
- The Analysis is prepared by an analyst (hereinafter “Author”), with the assistance of AI tools. The Author Roberto Rivero is a contractor for Admirals. This content is a marketing communication and does not constitute independent financial research.
- Whilst every reasonable effort is taken to ensure that all sources of the content are reliable and that all information is presented, as much as possible, in an understandable, timely, precise and complete manner, Admirals does not guarantee the accuracy or completeness of any information contained within the Analysis.
- Any kind of past or modelled performance of financial instruments indicated within the content should not be construed as an express or implied promise, guarantee or implication by Admirals for any future performance. The value of the financial instrument may both increase and decrease and the preservation of the asset value is not guaranteed.
- Leveraged products (including contracts for difference) are speculative in nature and may result in losses or profit. Before you start trading, please ensure that you fully understand the risks involved.