ATR Indicator Explained: What It Is and How to Use It in Trading

In this article, we will cover what is ATR in trading and how it is calculated, how to interpret its values meaningfully, and five practical ways traders may use it, from stop placement and trailing stops to position sizing, strategy filtering and multi-timeframe analysis. We also cover indicator settings and how to add them to a MetaTrader chart.
The information in this article is provided for educational purposes only and does not constitute financial advice. Consult a financial advisor before making investment decisions.
.png)
Table of Contents
ATR Meaning: ATR Indicator explained
The ATR indicator, short for Average True Range, is a technical analysis tool used to measure market volatility.
- A higher ATR indicates larger price swings and increased volatility
- A lower ATR suggests quieter market conditions
Average True Range Calculation
ATR is calculated in two stages.
1. The indicator determines the True Range (TR) for each period by taking the largest of:
- Current high minus current low
- Previous close to current high
- Previous close to current low
This allows the True Range to capture both intraday movement and price gaps between sessions.
2. Once the true range has been calculated for each period, those values are smoothed into the Average True Range using Wilder’s formula:
Where n represents the selected time period, commonly 14 periods by default.
Because the formula heavily weights previous ATR values, the indicator responds gradually to sudden changes in volatility. A single large price move may push ATR higher, but sustained volatility is usually required before the indicator fully reflects a new market environment. For this reason, ATR is considered a lagging volatility indicator.
Most modern trading platforms, including MetaTrader 4 and MetaTrader 5, calculate ATR automatically, so traders rarely need to compute it manually.
How to Read the ATR Indicator
ATR appears as a single line below the main price chart. When market volatility increases and price ranges expand, the ATR line rises. When price action becomes quieter and ranges compress, the line falls.
This is how it looks on a chart:
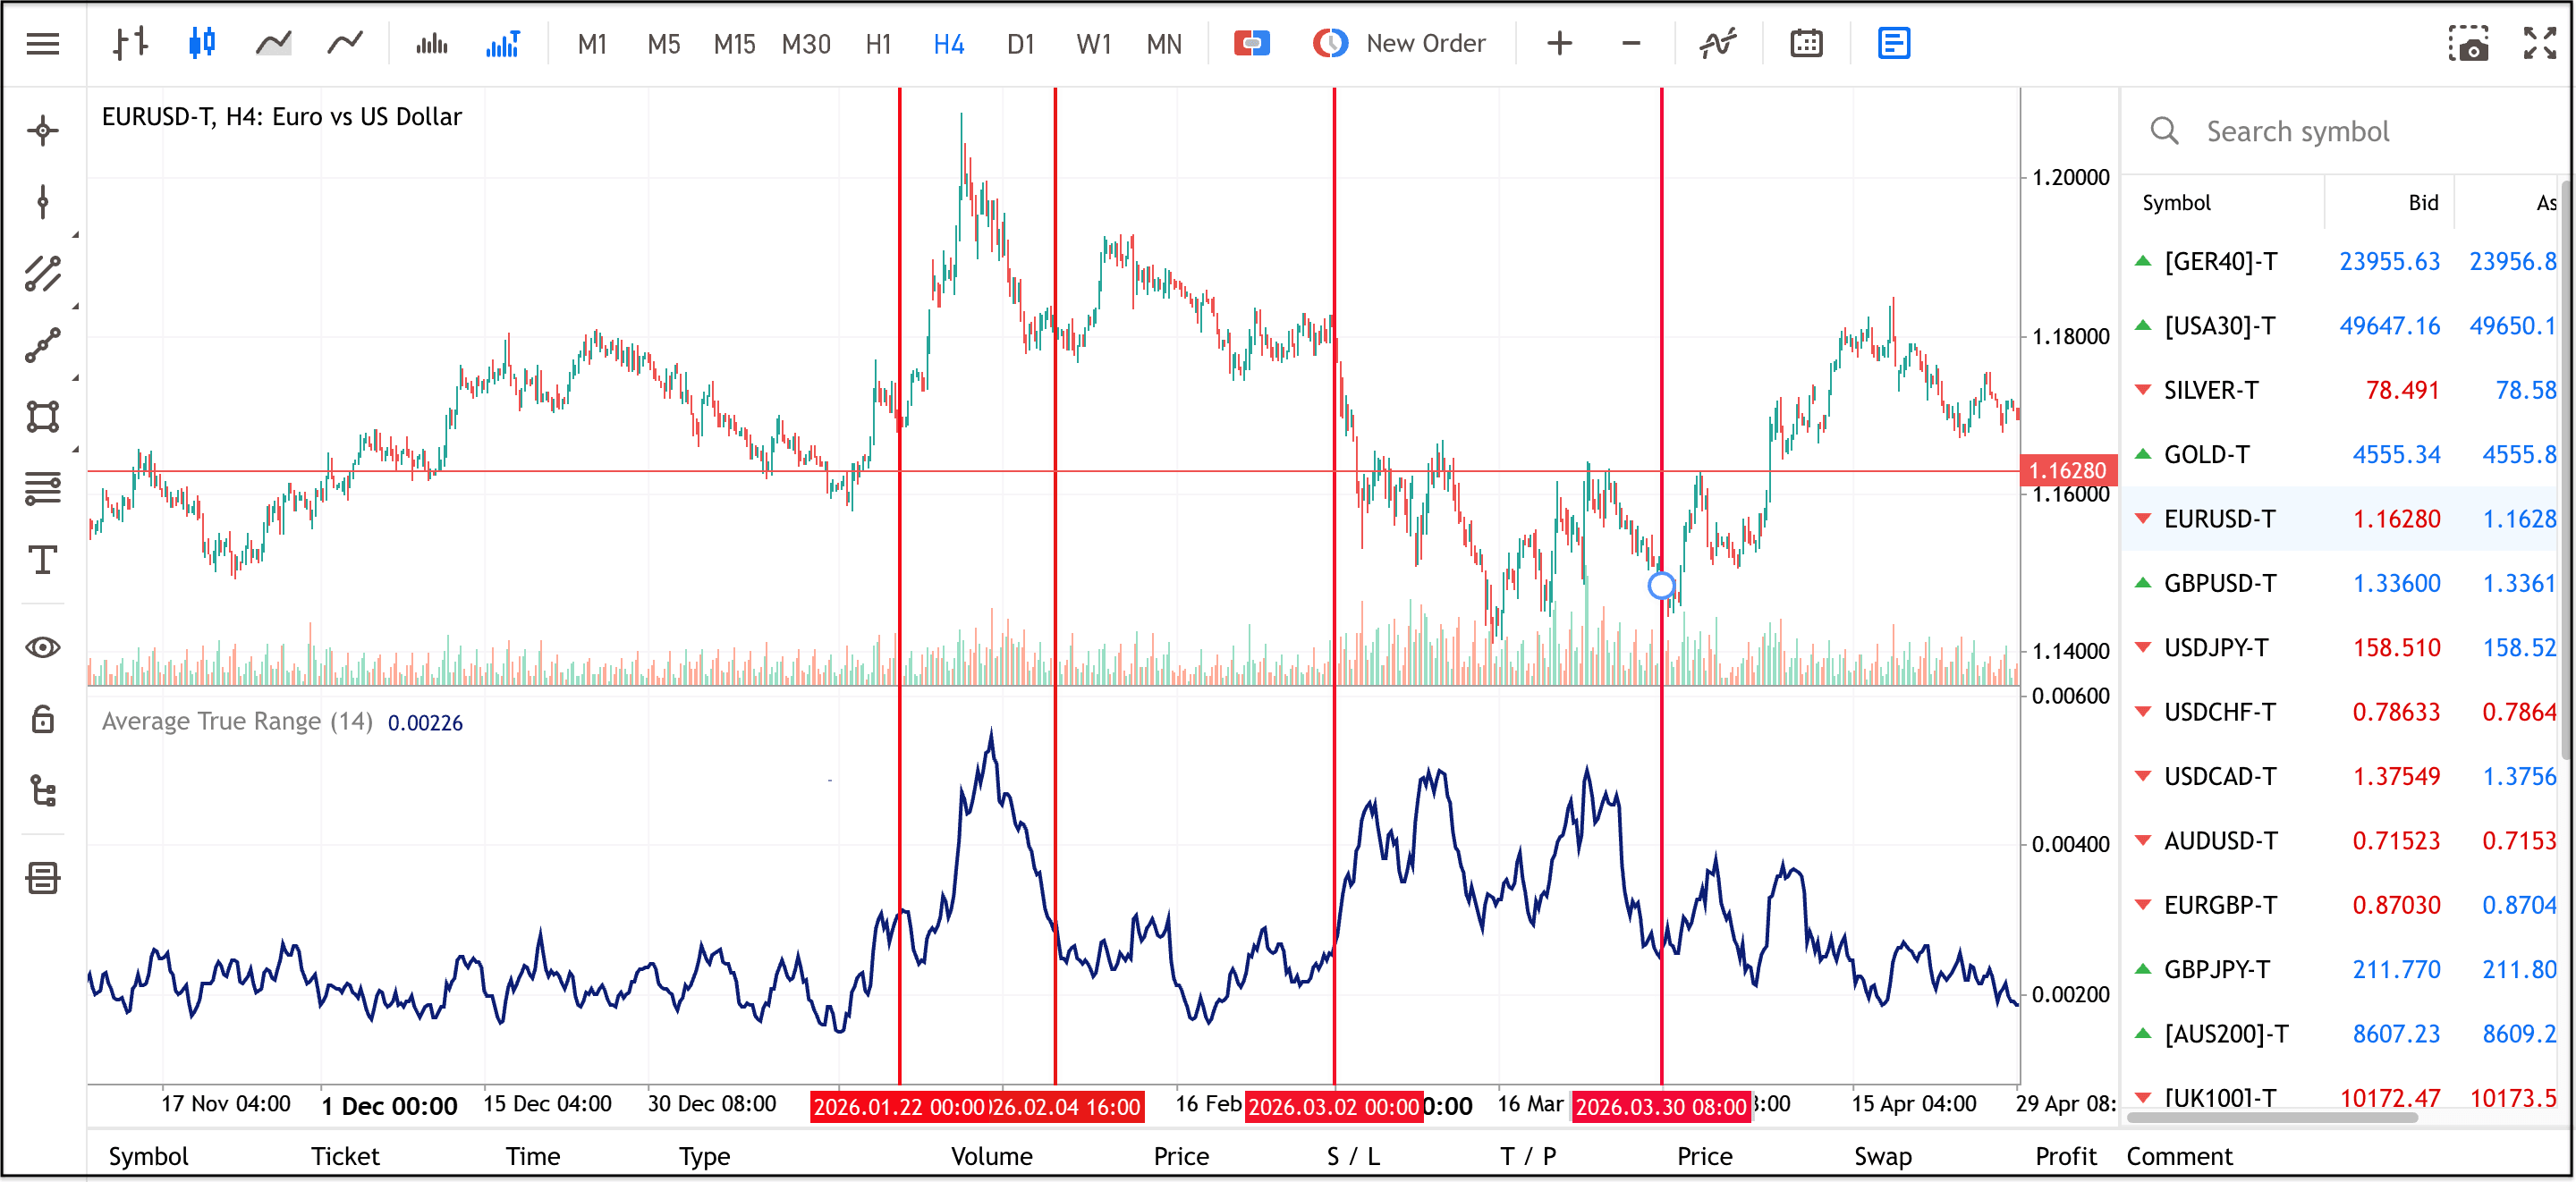
Rising ATR vs Falling ATR
Neither direction tells you where price is headed next. ATR answers one question only: how much has this market been moving.
Interpreting ATR Values in Context
ATR is expressed in the raw price units of the instrument, so the number itself has little meaning in isolation. A more useful approach is to compare the current ATR reading to its recent history on the same market.
For example, if the current 14-period ATR is near the upper end of its range over the past several months, volatility is relatively elevated. If it is near the lower end, market activity is comparatively subdued.
Some traders also compare shorter-period ATR readings to longer-period ATR readings to gauge whether volatility is increasing or fading relative to the broader environment.
How Traders Commonly Interpret ATR
- High ATR: Market volatility is elevated and price swings are larger
- Low ATR: Market conditions are quieter with smaller price movements
- Rising ATR: Volatility is increasing
- Falling ATR: Volatility is decreasing
ATR values should always be compared against the instrument’s own historical behaviour rather than another market.
How to Use the Average True Range Indicator
ATR can support several parts of trade planning, especially when traders connect it to their broader risk and strategy process. Here are the four ways it can be used in practice.
1. ATR Stop Loss
When trading ATR setups, stop-loss placement should account for the market’s normal volatility, with the stop placed outside the range of typical movement rather than within it. If the stop loss is placed too close to the entry, it risks being triggered by the normal volatility of the market.
For example:
- If ATR shows relatively low market volatility, some traders may choose to place tighter stop losses because price movements are comparatively smaller.
- Conversely, when ATR rises and volatility increases, traders may consider placing stops further from the entry price to account for larger market swings.
The underlying idea is to avoid placing a stop so close that it is triggered by normal market movement rather than a meaningful change in the trade setup.
2. ATR Trailing Stop
A trailing stop follows price as a trade moves in your favour, locking in potential gains progressively.
In ATR forex trading, the stop adjusts its distance according to current market volatility rather than using a fixed number of pips.
One example that can be used in an ATR indicator forex setup is the Chandelier Exit, a method developed by trader Chuck LeBeau. This ATR indicator is particularly popular among forex traders because it helps measure changing volatility in currency pairs.
In a long trade, the stop is placed a certain ATR distance below the highest price reached during the trade. As price makes new highs, the stop gradually moves higher as well.
The idea is to give the trade room for normal pullbacks while still protecting profits if the market begins to reverse more significantly.
For short trades, the process works in reverse, with the stop trailing above the lowest price reached during the position. As the trend matures and ATR contracts, the stop naturally tightens.
That said, ATR trailing stops are generally better suited to trending conditions.
3. ATR and Position Sizing
ATR can also support position sizing by helping traders account for changing volatility. When market ranges expand, a wider stop loss may be needed to give the trade enough room. In that case, traders may choose to reduce position size so that the overall risk on the trade remains consistent.
For example, a trader risking the same amount per trade may take a smaller position during highly volatile conditions and a larger position when market movement is relatively contained.
Used this way, ATR can help traders avoid taking disproportionately large risks during periods of elevated volatility while maintaining a more consistent approach to risk management across different market conditions.
ATR-based position sizing does not guarantee profits or prevent losses. It is simply one method traders may use to adapt risk management to changing market conditions.
4. ATR as a Strategy Filter
ATR can be used before a trade is even considered as a filter for whether current market conditions suit the strategy being applied. The same setup can look very different depending on whether the market is in a high-volatility or low-volatility phase.
- Breakout strategies may benefit from ATR confirming that volatility is expanding alongside the move. A breakout accompanied by rising ATR may suggest genuine participation; a break on flat or declining ATR warrants more caution about follow-through.
- Range-trading strategies often work better when ATR is stable or falling, an indication that the market is in a genuinely contained phase rather than a brief pause within a larger move.
- Trend-following strategies may be more cautious when ATR is spiking erratically in both directions, which can indicate choppy, directionless conditions rather than a clean trend.
Of course, none of this guarantees outcomes, and ATR is not an indicator that predicts the direction or strength of a trend. But using it as a conditions filter may help avoid applying the wrong approach in the wrong environment.
How to Use ATR Indicator MT4 and MT5
The Average True Range indicator comes with the standard package of indicators available when you install both MT4 and MT5, meaning that you will not have to perform a separate ATR indicator download.
In both MetaTrader 4 and MetaTrader 5, you will find the Average True Range indicator in the 'Indicators' section within the 'Navigator' window on the left-hand side of the screen, as shown below.
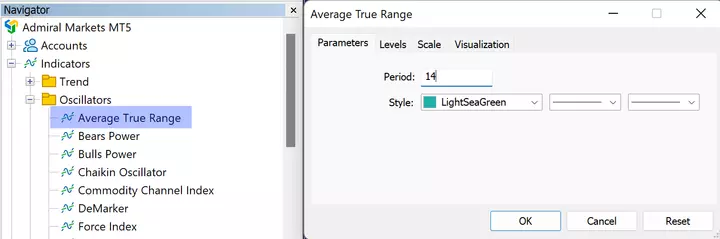
When you add the Average True Range indicator to your price chart, you will be presented with the ATR indicator settings window. The only variable you need to worry about is the ‘Period’.
This is the number of periods over which MT4 or MT5 will make the Average True Range calculation. As shown in the screenshot above of the ATR trading indicator settings, the default value in both MT4 and MT5 is 14, which is a good starting place for traders to begin with.
Once you click 'OK', a graph displaying the Average True Range indicator will appear beneath your main price chart. This is shown below in an hourly GBPUSD chart, with a 14-period ATR indicator applied:
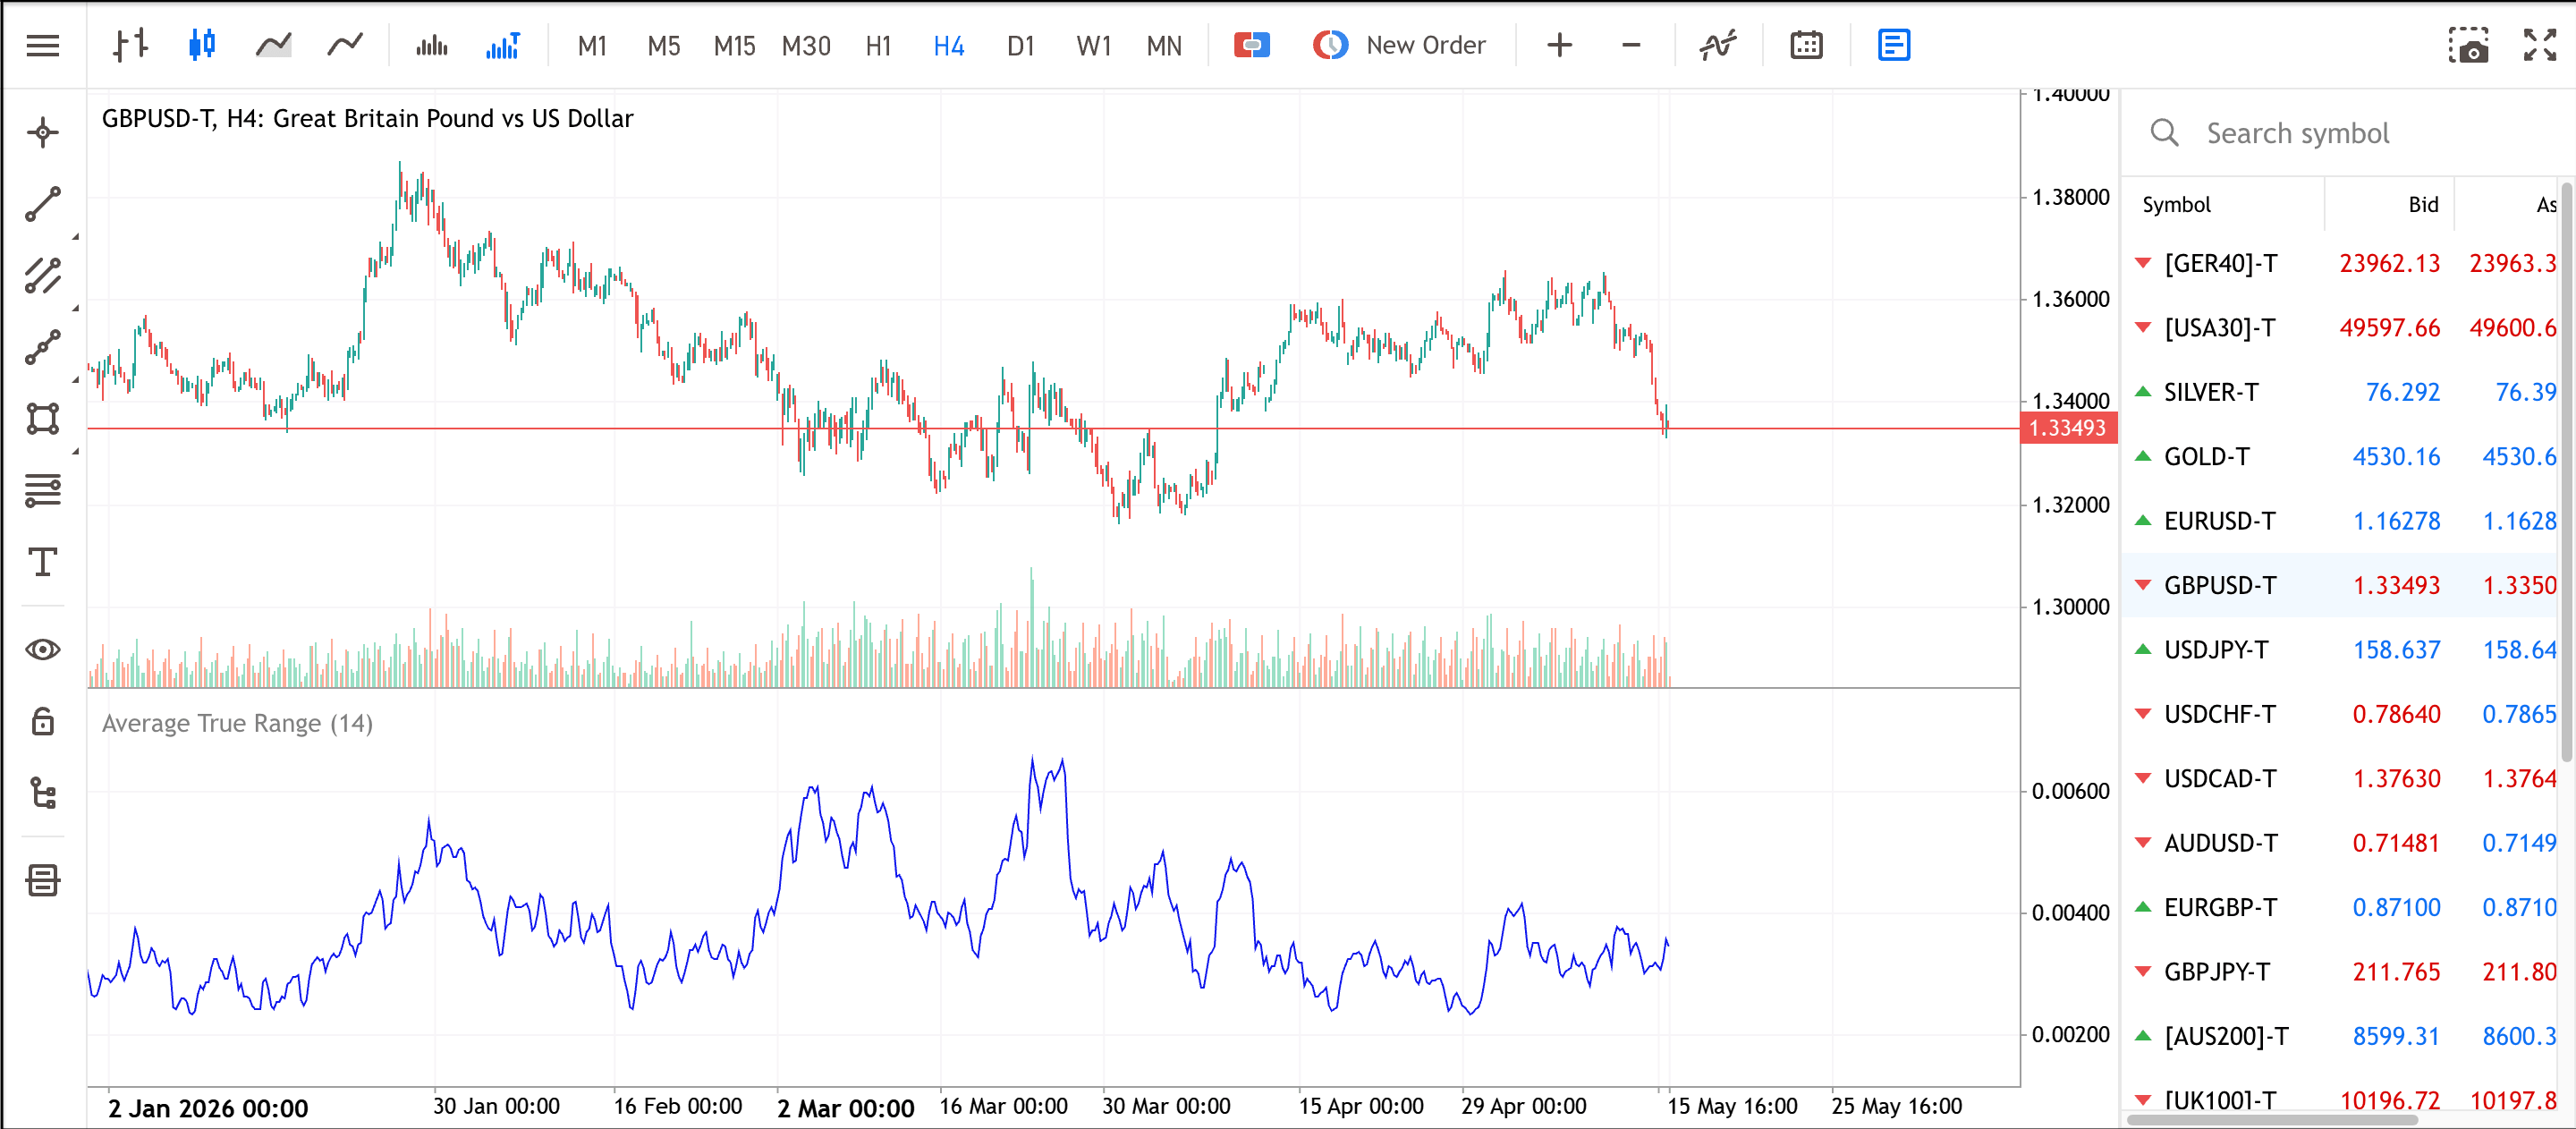
The peaks on the ATR indicator chart above show the more volatile trading times, whereas the troughs indicate less volatile periods. Hovering your cursor on the line chart will provide you with the exact value of the average true range at that particular point in time.
Practical Ways to Approach ATR
- Use ATR together with price action or trend analysis rather than alone
- Compare current ATR readings with historical ATR levels on the same instrument
- Adjust stop-loss distances when volatility changes
- Match ATR settings to your trading timeframe
- Avoid treating ATR as a buy or sell signal
Bottom Line on the ATR Indicator
Although the ATR indicator is designed to measure market volatility, many traders use it to help with stop placement, position sizing and more.
ATR technical indicator is often used as part of a broader trading approach rather than in isolation. Used alongside market structure, risk management and trade planning, it can provide useful context across forex, equities, commodities and other markets.
Traders who want to explore ATR in practice can use an Admirals demo account to test different settings, timeframes and approaches across MetaTrader 4 or MetaTrader 5.
Frequently Asked Questions on ATR Indicator
What is an ATR in trading?
ATR, or Average True Range, is a technical indicator used to measure how much a market typically moves over a given period, helping traders assess market volatility.
Is the ATR indicator available in MT4 and MT5?
Yes. ATR indicator is included as a standard indicator in both MetaTrader 4 and MetaTrader 5.
What is the top ATR setting for day trading?
Some traders use shorter ATR periods such as 7 or 10 for day trading because they react more quickly to recent price movement. Shorter settings may also generate more market noise.
Can ATR predict market direction?
No. ATR measures volatility only. It does not indicate whether price is likely to move up or down.
How is ATR used in forex trading?
In Average True Range forex trading, ATR helps traders measure currency-pair volatility, place stop losses beyond normal price movement, adjust trailing stops and manage risk as market conditions change.
INFORMATION ABOUT ANALYTICAL MATERIALS:
The given data provides additional information regarding all analysis, estimates, prognosis, forecasts, market reviews, weekly outlooks or other similar assessments or information (hereinafter “Analysis”) published on the websites of Admirals investment firms operating under the Admirals trademark (hereinafter “Admirals”) Before making any investment decisions please pay close attention to the following:
- This is a marketing communication. The content is published for informative purposes only and is in no way to be construed as investment advice or recommendation. It has not been prepared in accordance with legal requirements designed to promote the independence of investment research, and that it is not subject to any prohibition on dealing ahead of the dissemination of investment research.
- Any investment decision is made by each client alone whereas Admirals shall not be responsible for any loss or damage arising from any such decision, whether or not based on the content.
- With view to protecting the interests of our clients and the objectivity of the Analysis, Admirals has established relevant internal procedures for prevention and management of conflicts of interest.
- The Analysis is prepared by an analyst (hereinafter “Author”) with the assistance of AI tools. The Author Amrita Kundu is a contractor for Admirals. This content is a marketing communication and does not constitute independent financial research.
- Whilst every reasonable effort is taken to ensure that all sources of the content are reliable and that all information is presented, as much as possible, in an understandable, timely, precise and complete manner, Admirals does not guarantee the accuracy or completeness of any information contained within the Analysis.
- Any kind of past or modelled performance of financial instruments indicated within the content should not be construed as an express or implied promise, guarantee or implication by Admirals for any future performance. The value of the financial instrument may both increase and decrease and the preservation of the asset value is not guaranteed.
- Leveraged products (including contracts for difference) are speculative in nature and may result in losses or profit. Before you start trading, please ensure that you fully understand the risks involved.