How to Use the Momentum Indicator
This article will provide an insight into the Momentum Indicator, also referred to as the Momentum Oscillator, in MetaTrader 4 (MT4) and MetaTrader 5 (MT5). We will examine the Momentum Indicator formula, share an example of a Momentum Indicator strategy and much more!
Table of Contents
What Is Momentum Indicator?
Momentum indicators are technical indicators which depict the momentum behind an asset’s price, by measuring the rate of its rise or fall. Momentum can be a useful tool in determining the strength, or weakness, of an asset’s price movements.
Of the numerous different momentum indicators which exist, one is the Momentum Oscillator, which can be found in both MT4 and MT5. The Momentum Oscillator indicator measures how an asset’s current price compares to its price a predetermined number of periods ago.
The subsequent indicator oscillates around a value of 100, with values above this level indicating positive momentum, or increasing prices, and values below this level indicating negative momentum, or decreasing prices.
The Momentum Indicator Formula
When compared with other indicators, the Momentum Indicator formula is actually quite straightforward. Nevertheless, you won’t need to worry about doing the calculations yourself, as both MT4 and MT5 will take care of that for you.
However, understanding how the Momentum Oscillator is calculated provides us with a better understanding of how the indicator works.
The indicator makes a comparison between an asset’s current price and the price N periods previously, where N is a number which is chosen by the trader. The default value for N in both MT4 and MT5 is 14, however, traders can set it to whatever value they wish.
The Momentum Indicator is calculated as follows:
| Momentum = ( Current Closing Price / Closing Price N Periods Ago ) x 100 |
As already highlighted, both the MT4 and MT5 trading platforms will do the Momentum Indicator calculation for you instantly, displaying the results for you below the main price chart, as we will see in the following section.
How to Use Momentum Indicator MT4 & MT5
The Momentum Indicator MT4 & MT5 comes as part of the standard package of indicators available on both trading platforms.
In order to start trading with the indicator, you need to go to the ‘Navigator’ window on the left-hand side of the screen. Here, you will find the Forex Momentum Indicator in the ‘Oscillators’ folder within the ‘Indicators’ section.
Once found, click and drag it on to your price chart in order to bring up the Momentum Indicator settings, as shown below.
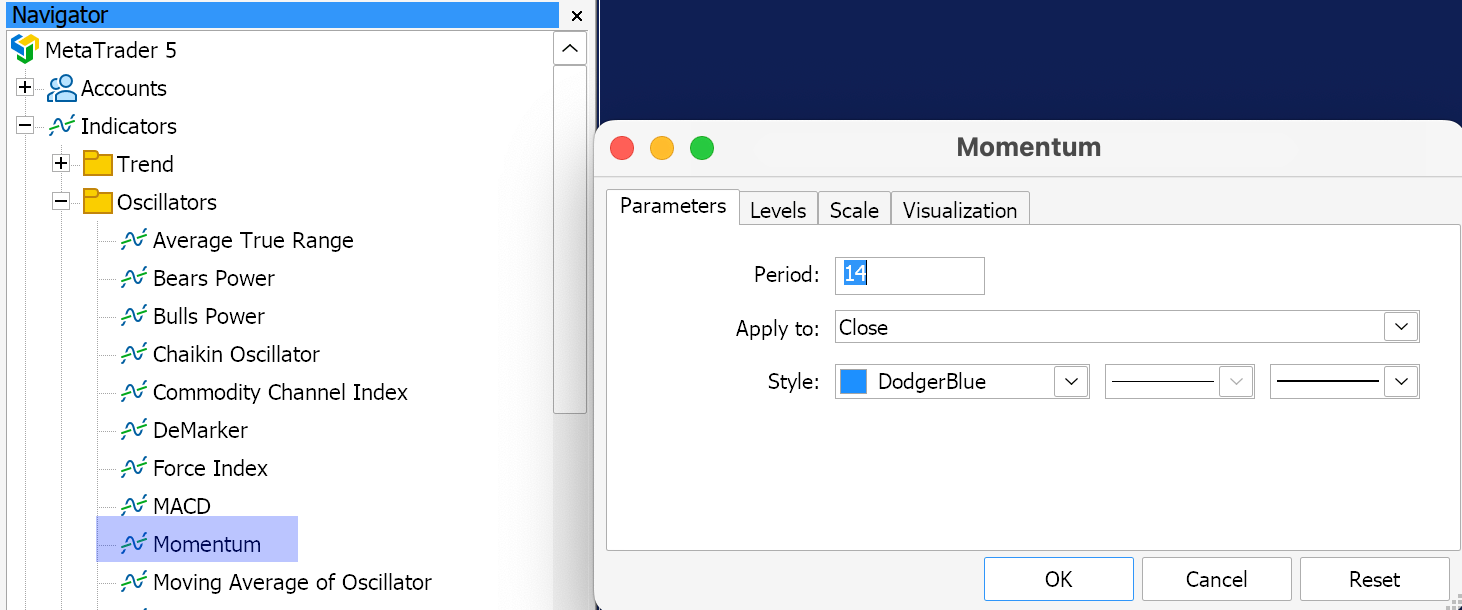
The default value for the period of the Momentum Indicator settings is 14. This value can be changed to anything you like, however, when using any technical indicator for the first time, it is usually a good idea to start off with the default settings.
Once you become more acquainted with the indicator you can start to experiment to find out which settings work best for you and your Momentum Indicator strategy.
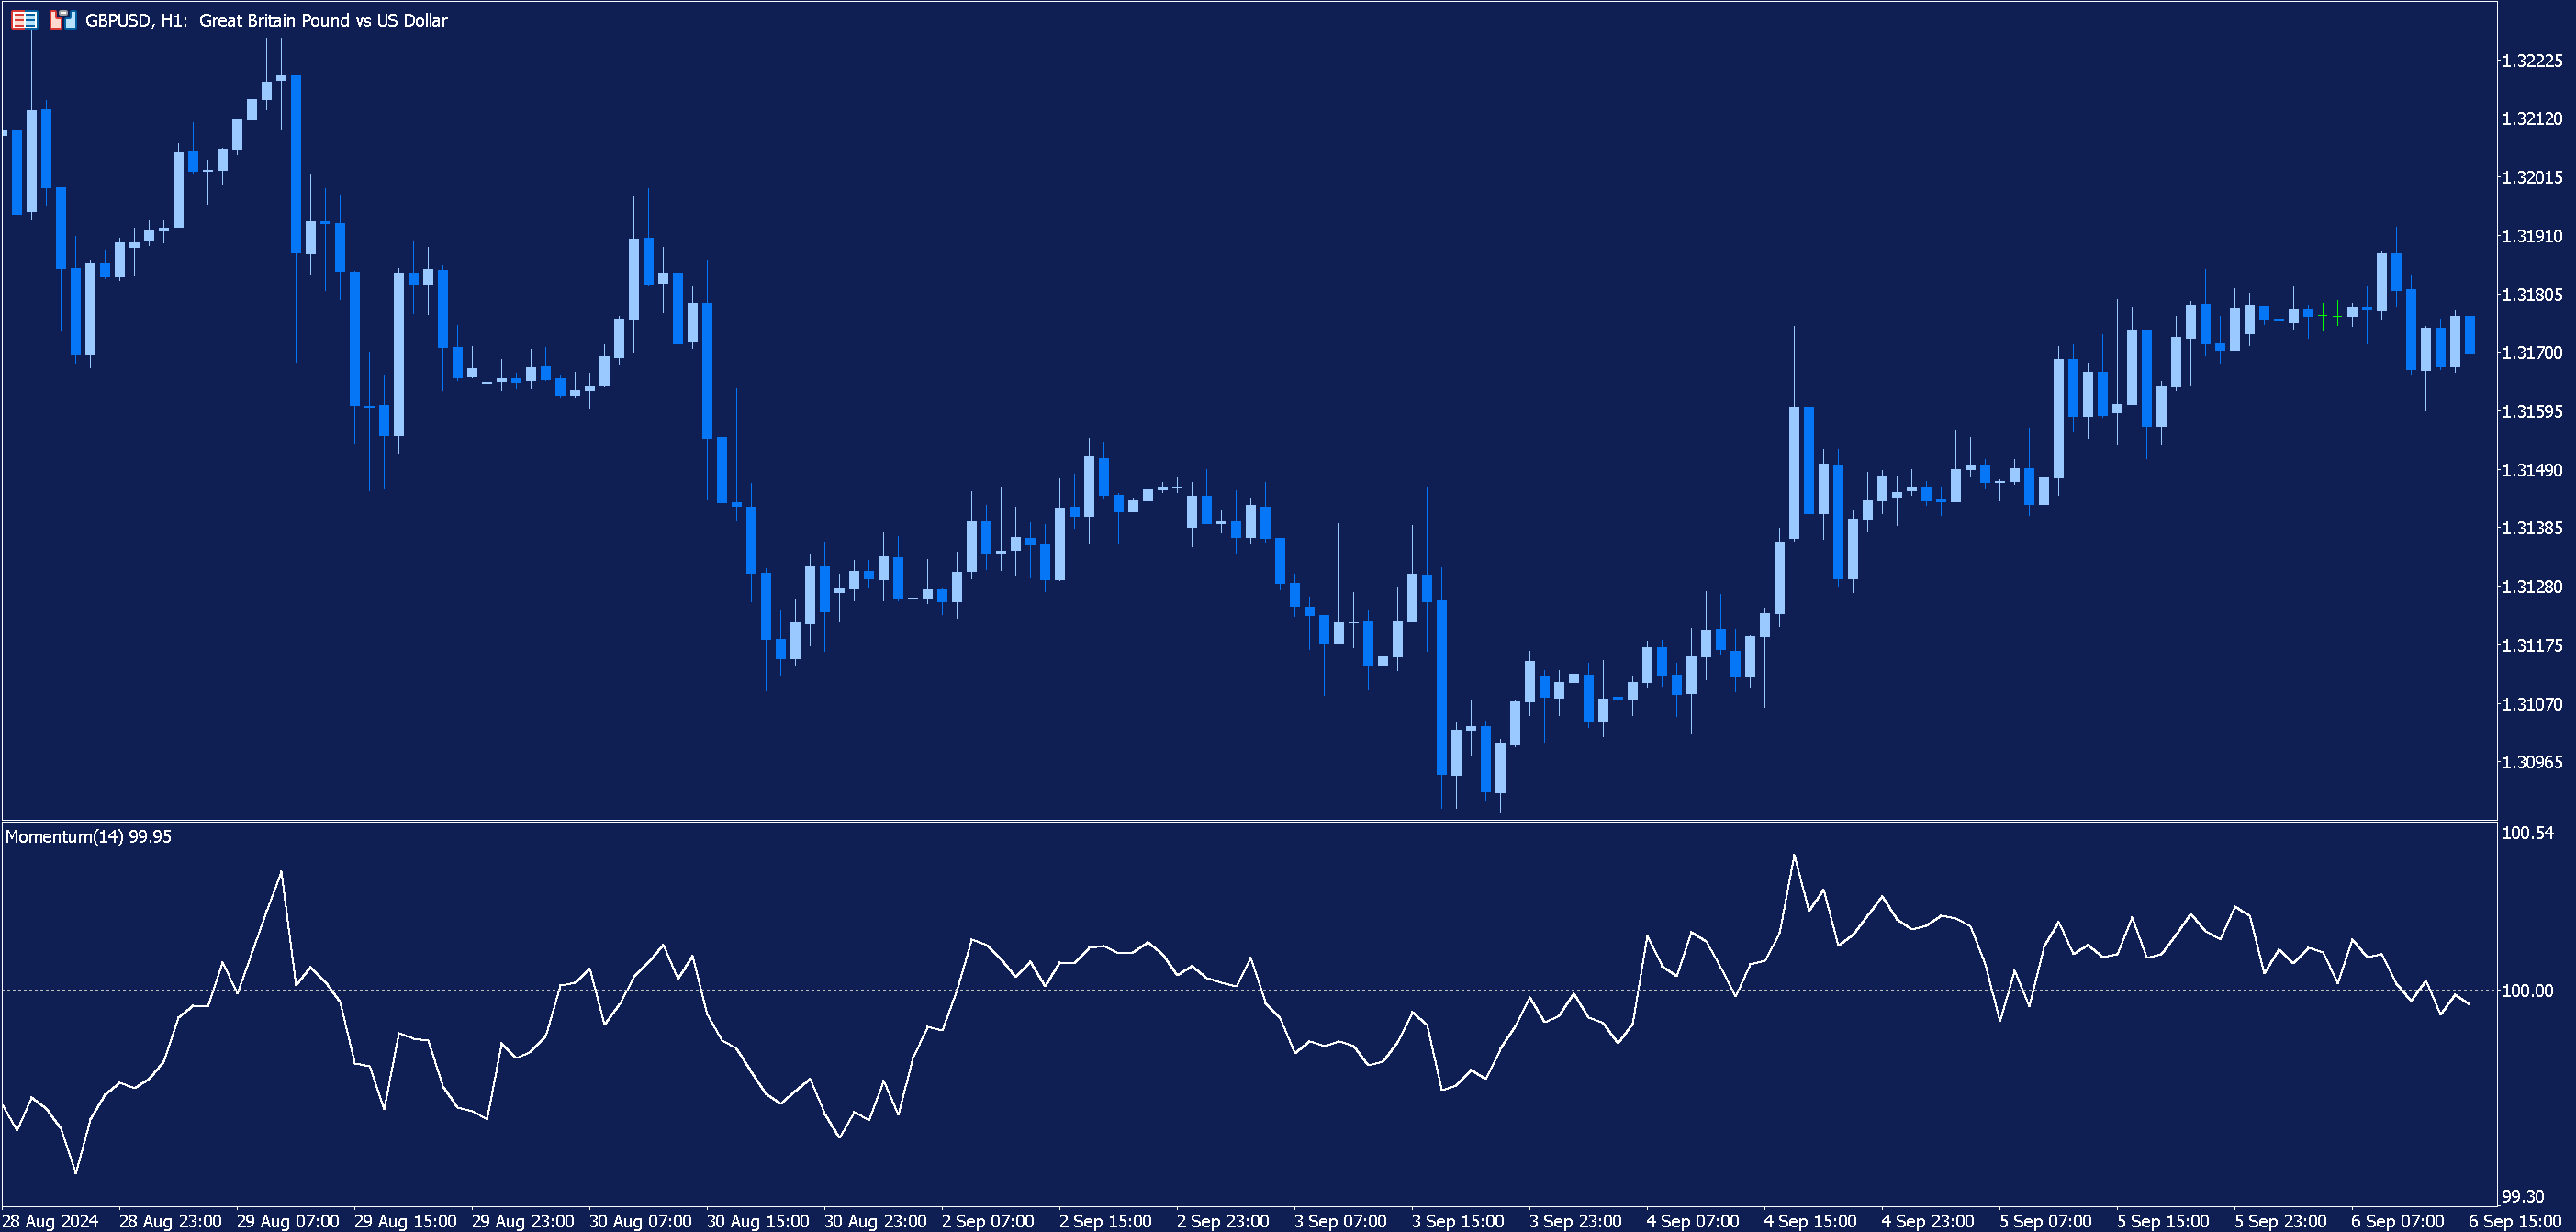
In the image above, the Momentum Oscillator has been added to an hourly GBPUSD chart, where it appears underneath the main chart. We have also added a centreline of 100 to the indicator, which can be done within the ‘Levels’ section of the Momentum Indicator settings. This makes it easier to interpret the information displayed by the indicator.
You will note that the indicator oscillates either side of the 100 level and, in the chart above, is plotted between the values of 99.30 and 100.54. However, bear in mind that the Momentum Oscillator indicator is in fact unbound, meaning that it has no upper or lower limits to its value.
When the indicator is higher than 100, the current price is higher than the price 14 periods ago. On the other hand, when it drops below 100, the current price is lower than the price 14 periods ago. How far the Momentum Indicator moves above or below 100 demonstrates how fast the price is moving.
Trading with a Momentum Indicator Strategy
So, how can you incorporate a Momentum Indicator strategy into your Forex trading? Whilst the Momentum Indicator can be used to provide trading signals, it is better used as a confirmation tool for signals generated by price action or by other technical indicators.
However, there are several ways you can use the indicator to judge which direction the price might move. A simple example of such involves paying attention to when the indicator crosses its 100 line. Below is the same hourly GBPUSD chart as earlier, but this time we have highlighted each time the indicator crosses its 100 level.
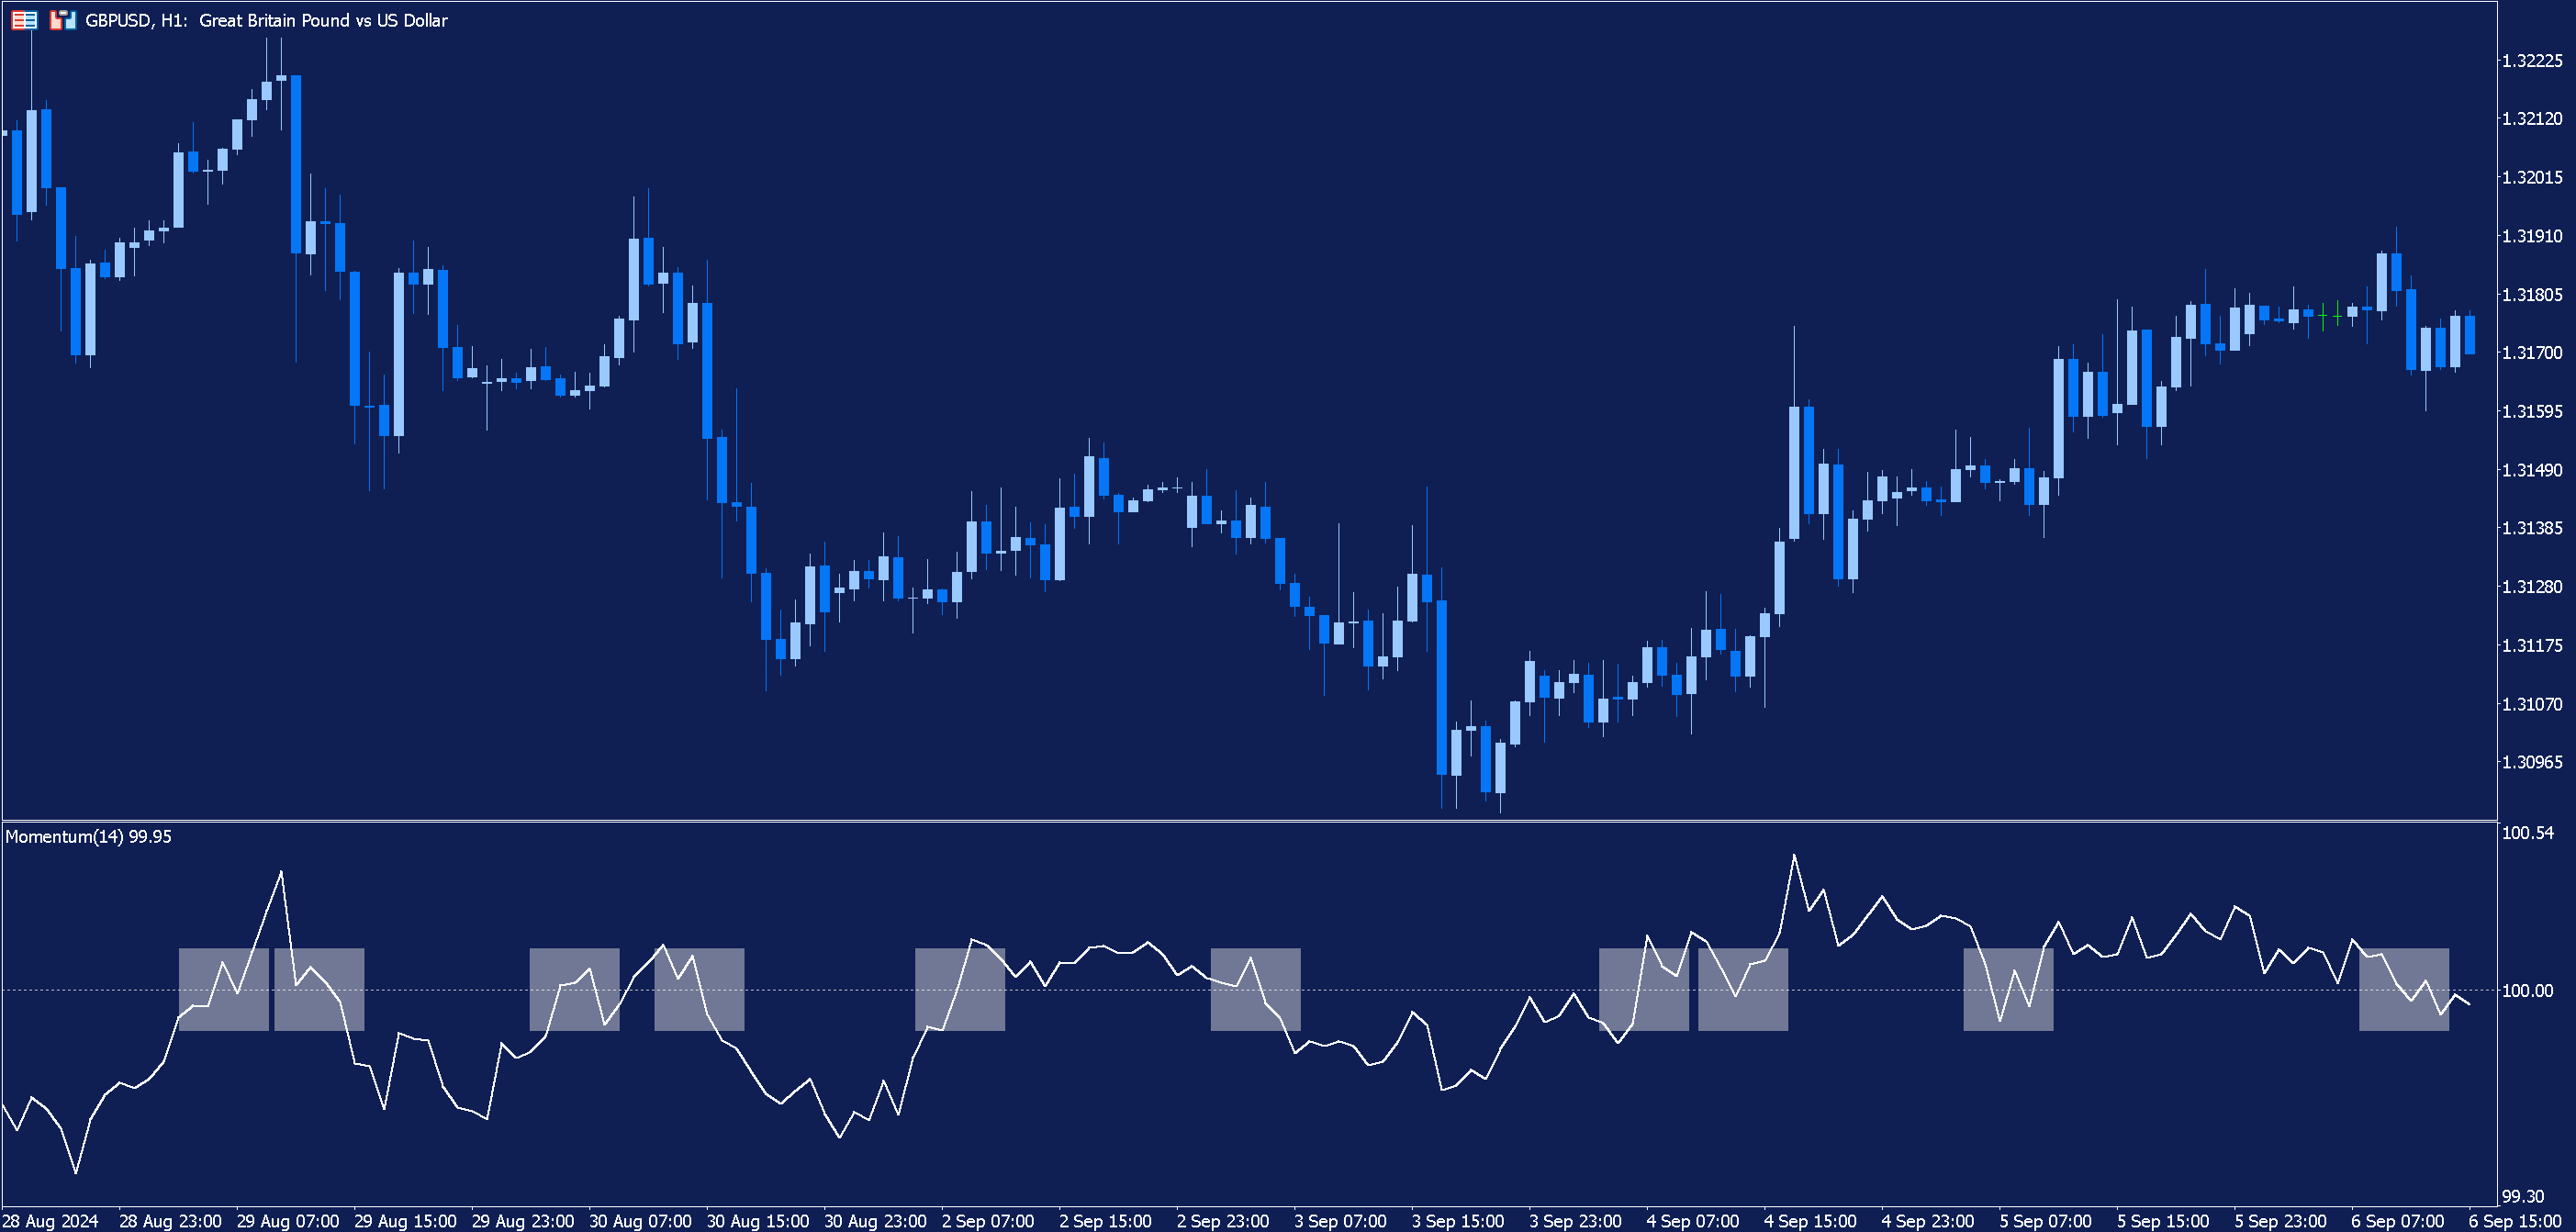
When the Momentum Indicator crosses above the 100 line, this can be interpreted as a buy signal. Conversely, each time it crosses below the 100 line, it can be interpreted as a sell signal.
The logic behind this is that the fact the Momentum Indicator has crossed the 100 line means that the price is either rising or falling, depending on the direction.
However, there are downsides to this Momentum Indicator strategy. As seen in the chart, there are instances where the indicator crosses the 100 line, only to cross it immediately afterwards in the opposite direction. This drawback can be limited by only acknowledging signals which complement the current trend.
Another drawback of this method is that, often, by the time the Forex Momentum Indicator has crossed the 100 line, much, or even all, of the price movement has been missed.
Momentum Oscillator Crossover Strategy
Another possibility for a Momentum Indicator Strategy involves adding a Moving Average to the Momentum Indicator and using their crossovers as trading signals.
In order to do this, find the Moving Average in the ‘Indicators’ folder. Instead of dragging it onto the main price chart, drag it on to the Momentum Indicator’s chart below. When the Moving Average settings dialogue box appears, click the drop down next to ‘Apply to’ and select ‘First Indicator’s Data’.
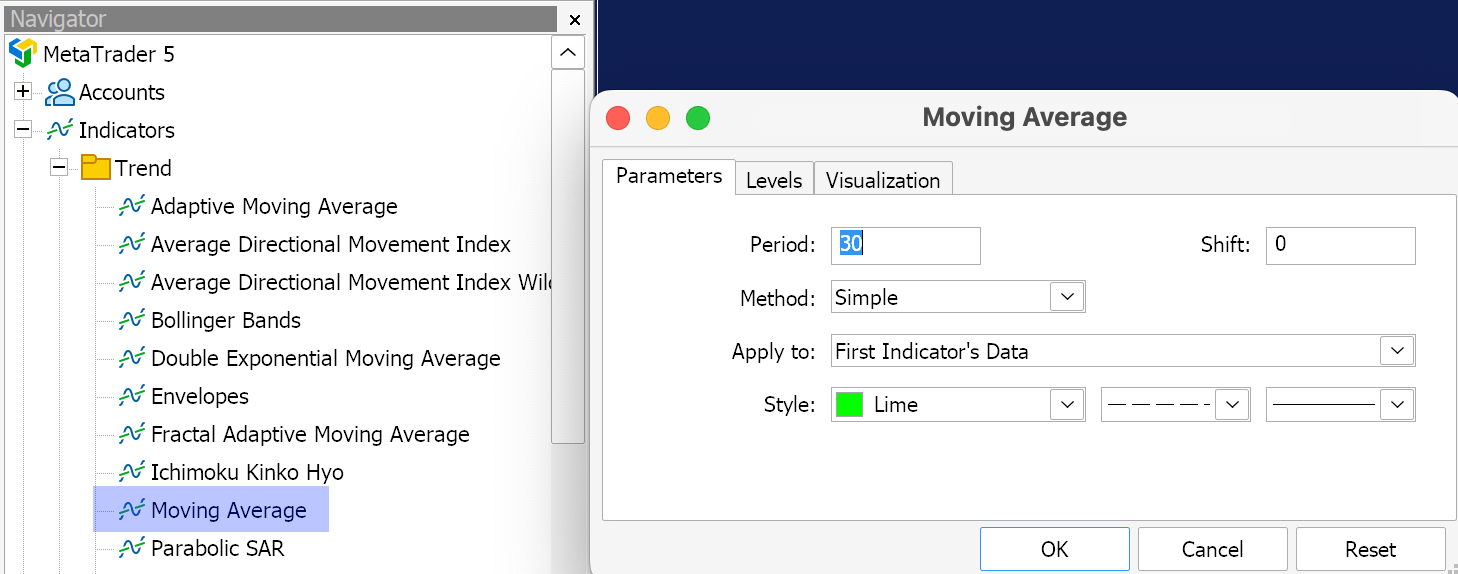
The moving average will then be applied to the Momentum Oscillator’s data, as shown below. In our example, we have used a Simple Moving Average with a period of 30; however, as with the Momentum Indicator settings, this can be adjusted to whatever works best for you.
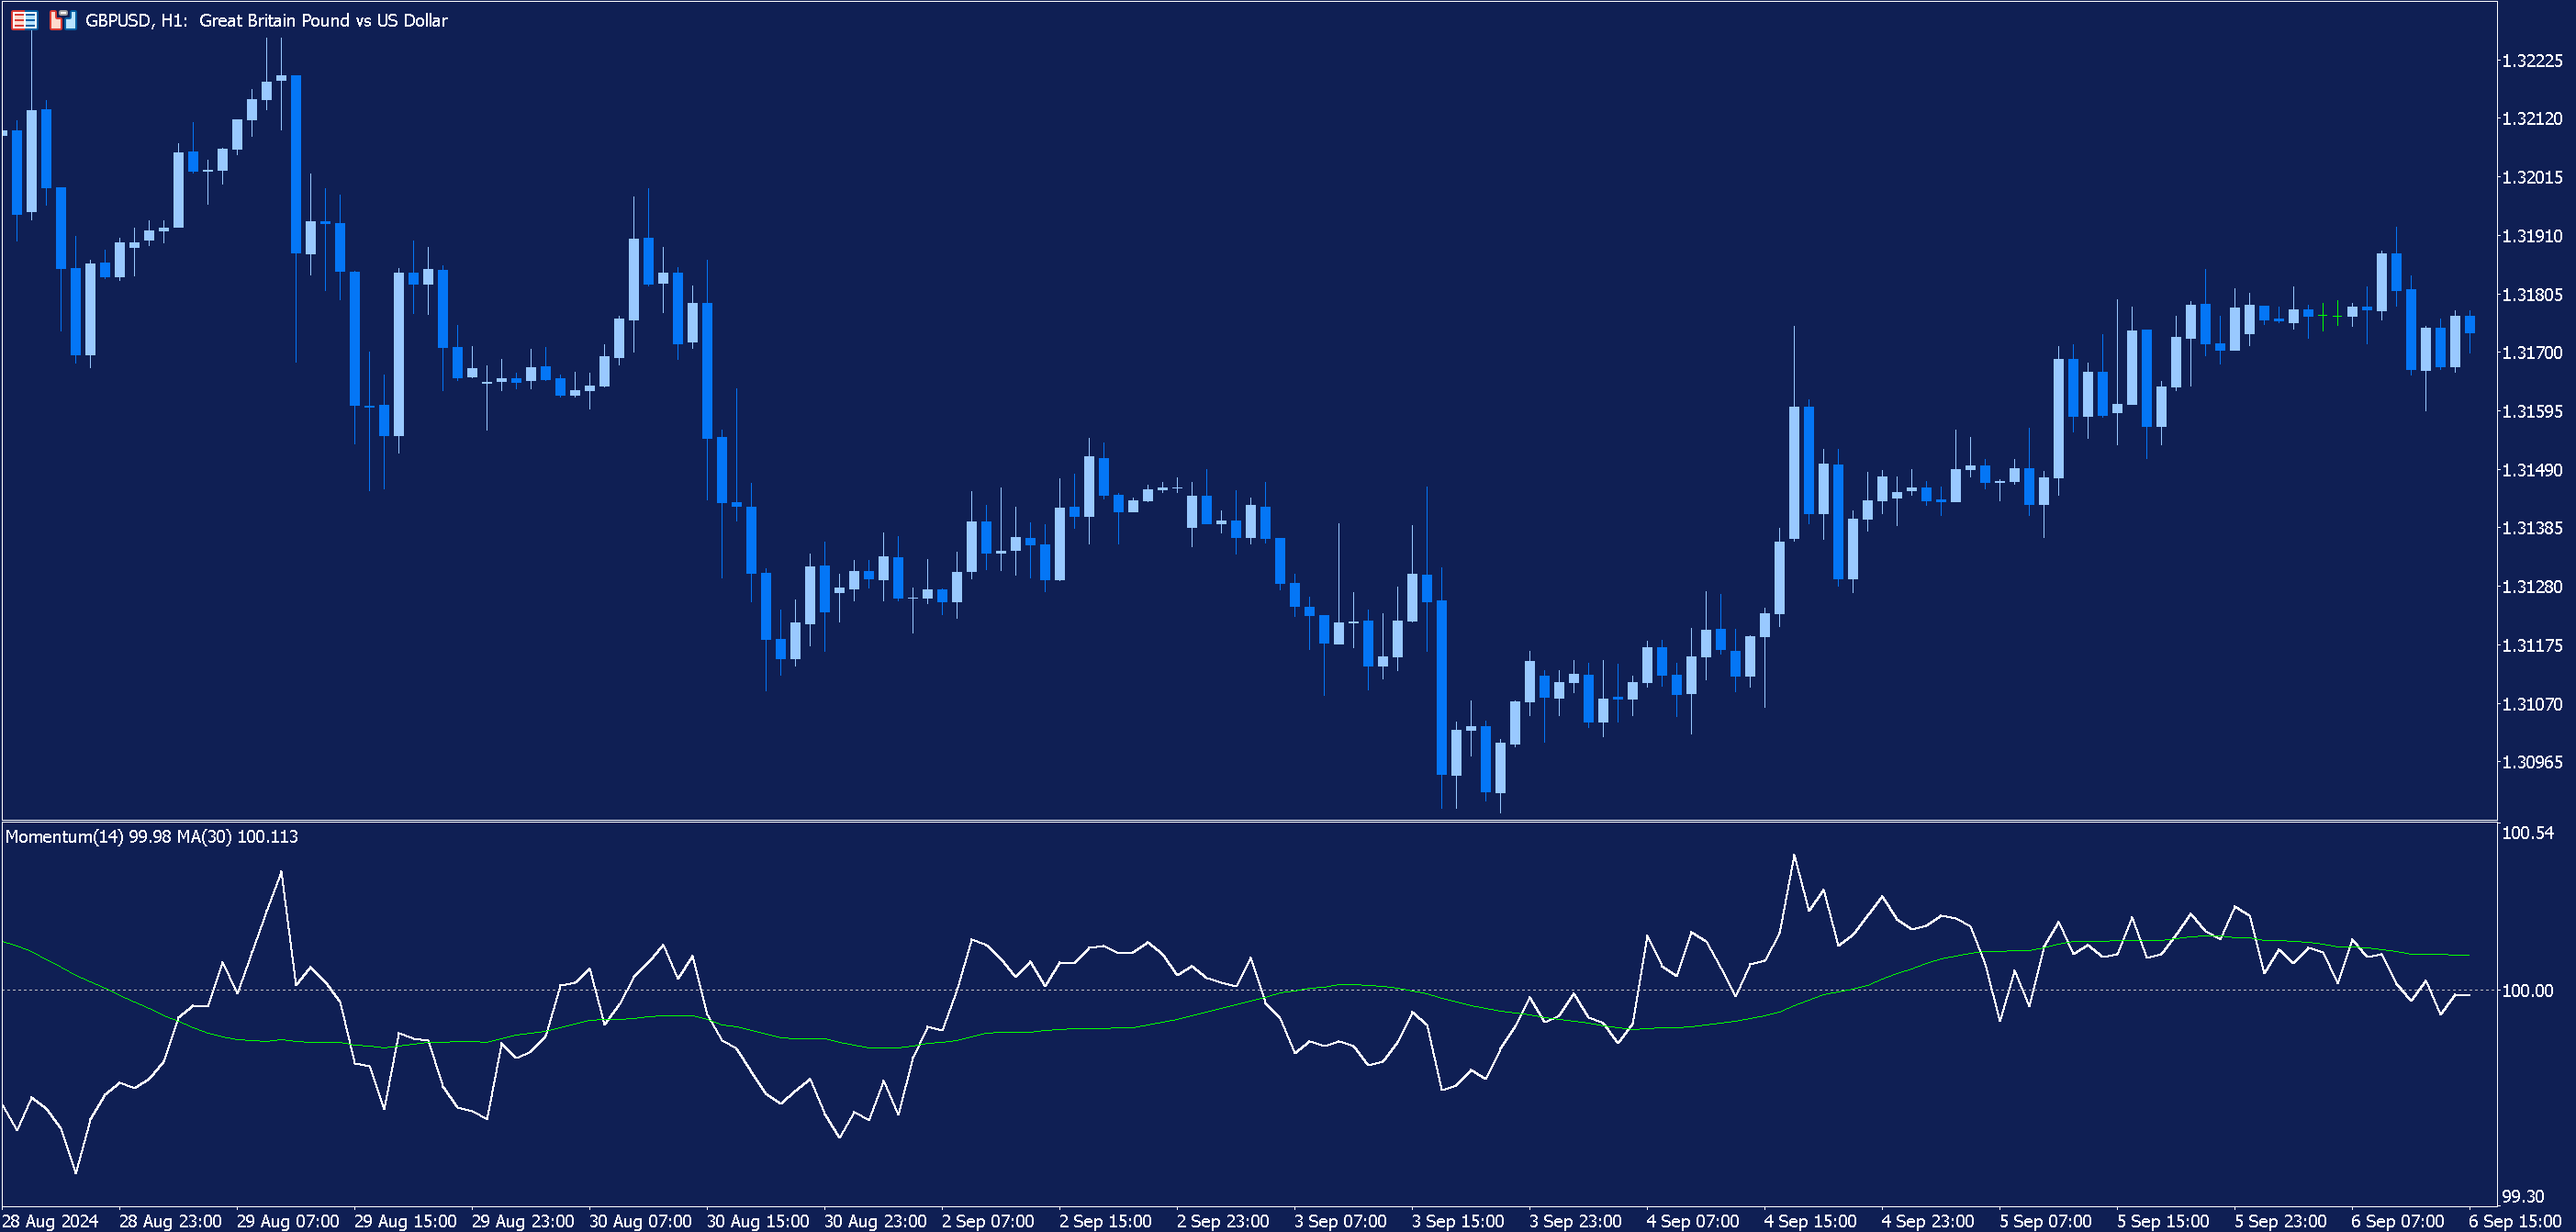
The signals here are generated in a similar way to before, however, instead of the 100 line, we are looking at crossovers of the two indicators. When the Momentum Oscillator indicator crosses above its moving average, this can be interpreted as a buy signal; when it crosses below, a sell signal.
As before, the accuracy of this Momentum Indicator strategy can be improved by only making trades when the trade signal is in the same direction as the trend. However, please note that both of the trading strategies highlighted here are for example purposes and are only intended to demonstrate how the indicator can be used. Neither have been tested in a live trading environment.
Forex Trading with Admirals
If you feel ready to take your trading to the next level and perhaps even implement a Momentum Indicator strategy on the live markets, the Trade.MT5 account from Admirals could be just what you are looking for. With Admirals, you can trade Contracts for Difference (CFDs) on more than 80 currency pairs as well as on a range of other markets. Click the banner below to find out more:
FAQ
What is the best period for momentum indicator?
The Momentum Indicator comes with a default setting of 14 in both MetaTrader 4 and MetaTrader 5. As is often the case, the best period to use with the Momentum Oscillator will depend on trader in question and their trading style and strategy. It is recommendable to start with the default period setting before experimenting to find out what works best for you.
Other Articles You May Find Interesting:
- How to Use the CCI Indicator
- How to Use the Parabolic SAR Indicator
- How to Use the Market Facilitation Index Indicator
About Admirals
Admirals is a multi-award winning, globally regulated Forex and CFD broker, offering trading on over 8,000 financial instruments via the world's most popular trading platforms: MetaTrader 4 and MetaTrader 5. Start trading today!
This material does not contain and should not be construed as containing investment advice, investment recommendations, an offer of or solicitation for any transactions in financial instruments. Please note that such trading analysis is not a reliable indicator for any current or future performance, as circumstances may change over time. Before making any investment decisions, you should seek advice from independent financial advisors to ensure you understand the risks.