How to Use Market Facilitation Index Indicator
In this article, we will examine the Market Facilitation Index indicator, also referred to as the BW MFI, which is one of a number of technical indicators created by Bill Williams. We will explain what the indicator is, show how it is calculated and demonstrate how to use the Market Facilitation Index in MetaTrader 4 (MT4) and MetaTrader 5 (MT5).
Table of Contents
What Is Market Facilitation Index?
Bill Williams, the creator of the Market Facilitation Index, described the indicator as “a measure of the market’s willingness to move the price”.
The BW MFI does this by looking at two things, price and volume, calculating how much an asset’s price has moved with respect to volume in the market. Williams argued that an increase or decrease in volume only tells traders so much and that, in fact, we should be more interested in how the market responds to the change in volume.
How to Calculate the BW MFI Indicator
| MFI = (H - L) / V |
Where:
- H = high
- L = low
- V = tick volume
The calculations behind the BW MFI are actually quite simple. First, you determine the price range by subtracting the period’s low from its high. This figure is then divided by the tick volume for the period.
How to Use Market Facilitation Index MT4 & MT5
Both MetaTrader 4 and MetaTrader 5 have a folder dedicated to technical indicators developed by Bill Williams, which is where you can find the Market Facilitation Index indicator, as shown in the image below.
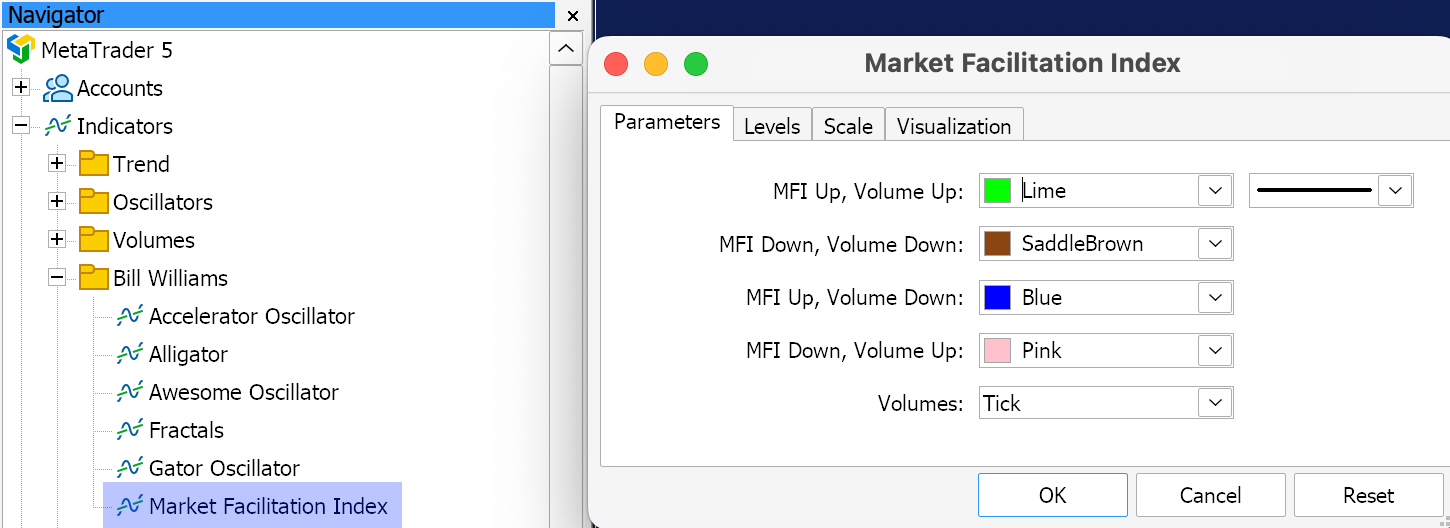
You can set the colours for the bars on the BW MFI histogram as you like but, other than that, there are no parameters to set.
Each colour represents a different combination of how the Market Facilitation Index and volume compares to the previous bar, which we will discuss in detail in the following section. The image below shows a daily GBPUSD chart to which we have added the Market Facilitation Index indicator.
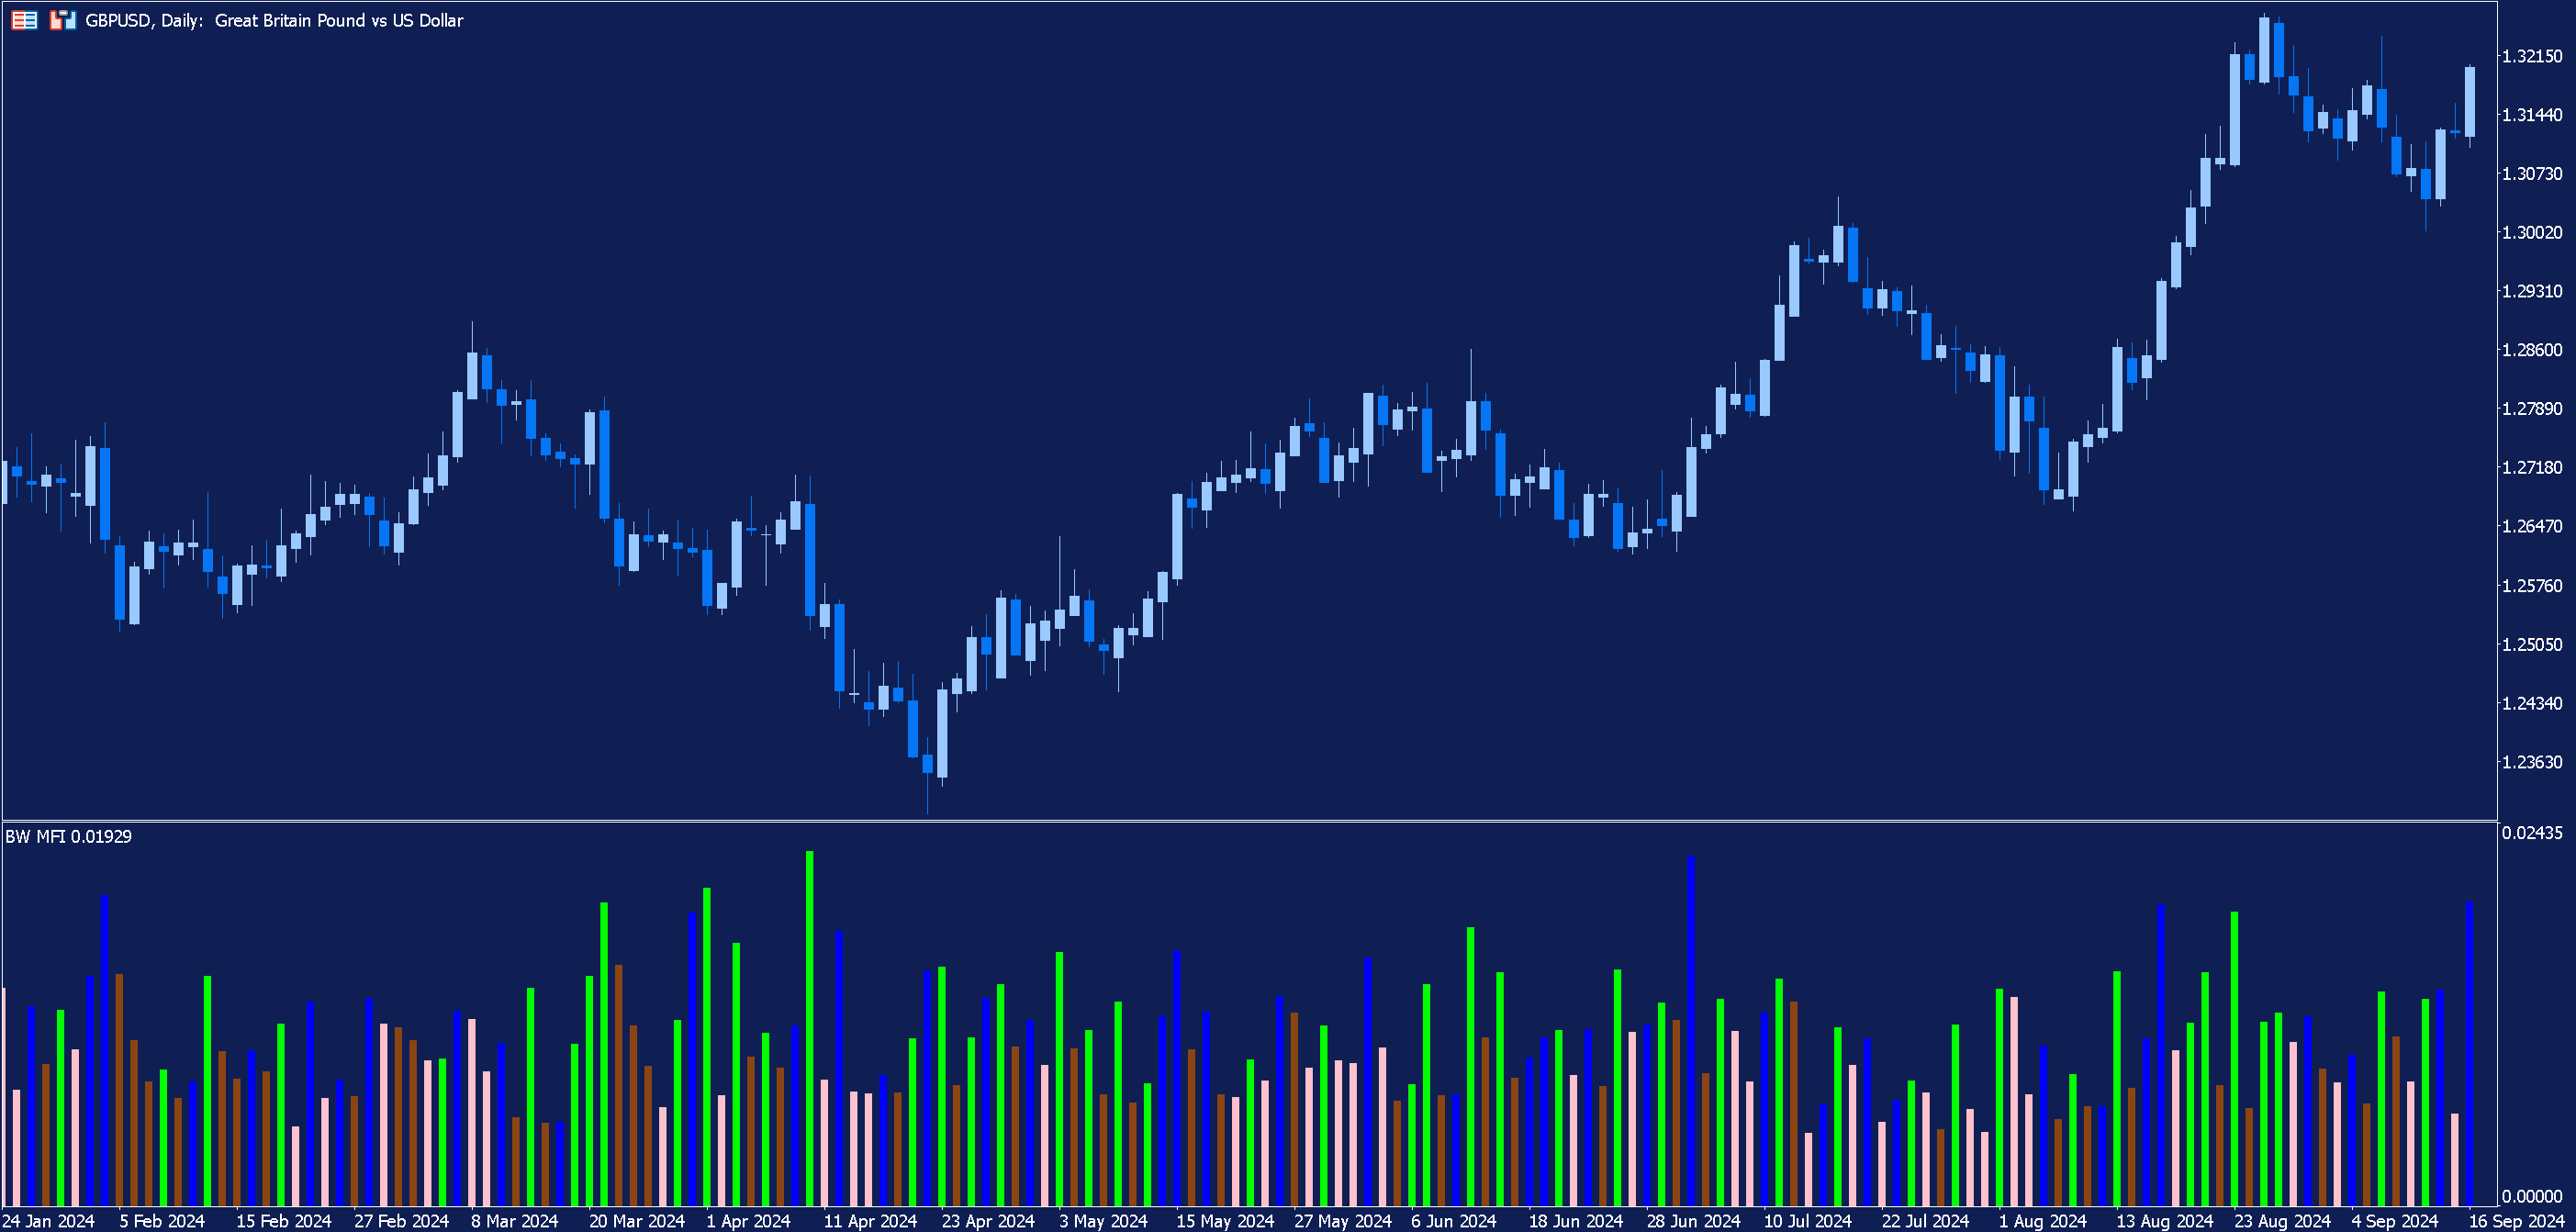
The main use for the BW MFI indicator is to compare a bar with the bar immediately preceding it in order to analyse whether the conditions are more or less favourable for trading. Let’s take a look at what the indicator’s differently coloured bars tell us about the market.
Trading with a Market Facilitation Index Strategy
The BW MFI indicator provides us with clues as to how the market is responding to a change in volume.
In isolation, the absolute values generated by the indicator don’t tell us an awful lot and don’t provide any trading signals. What we are looking for are changes from one bar to the next, and this is where the Market Facilitation Index indicator’s different colours come into play.
The indicator’s colours signify how the current bar’s Market Facilitation Index value and volume compares to the previous bar. There are four possible combinations, each denoted by its own colour.
Below are the possible combinations together with the default colours in both MT4 and MT5:
But what can we deduce from these different combinations?
Green
A green bar signifies that both the BW MFI and volume have risen in comparison to the previous bar. This, in turn, tells traders a couple of things:
- The number of market participants is increasing.
- These participants are mostly opening positions in the direction the market is already moving.
Consequently, a green bar is seen as a signal for trend continuation. Money is flowing into the market and the increased BW MFI suggests that the price movement is accelerating. Williams recommended that traders go with the direction of the market in such a circumstance.
Brown
A brown bar shows that both BW MFI and volume are decreasing, something which Williams labelled as a ‘Fade’.
This implies that the market has lost enthusiasm for the price movement and not an awful lot is going on. Traders who had previously been participating in the market have lost interest and it may be that a previous trend has come to its end. This lull in activity could be interpreted as a gap between two market moves and, consequently, may foreshadow the start of a new build in momentum.
Blue
A blue bar indicates that the BW MFI is increasing, but the volume is decreasing, a situation which was labelled a ‘Fake’ by Williams.
The market appears to be facilitating a move in a certain direction, but it is not supported by volume which might imply that there is not yet much interest in the move (or may in fact, simply be a result of low volume, given that volume is the denominator in the Market Facilitation Index formula). Price moves at this time should be viewed with some scepticism, as the move is not underpinned by volume.
Pink
The final combination, known as a 'Squat', is one in which we see increasing volume, but a decline in the Market Facilitation Index. Participants are entering the market, but the price movement is stalling, implying that there is a tussle occurring between bulls and bears.
The direction of the market remains undecided whilst the buyers and sellers compete. At some point, someone will win and, consequently, a ‘Squat’ may signal either the resumption of a previous trend or the beginning of a trend in the opposite direction. Williams referred to this as the ‘Squat’ as it implies the market is crouching, but ready to leap into action.
You will notice that in the list of combinations, for the first and last combinations (green and pink), volume is increasing. By this token, increasing volume is usually a signal that it may be a favourable opportunity to trade.
Whilst The BW MFI indicator can help inform us about the market, its use as a stand-alone indicator is fairly limited.
As with most indicators, the Market Facilitation Index becomes far more useful when used in combination with other tools as part of an overall system. Bill Williams recommended using the indicator in combination with his Fractals Indicator. Even then, you might want help from other indicators to obtain more information. For example, a moving average can help to confirm the presence and direction of a trend.
Final Thoughts
The BW MFI indicator was intended to take simple aspects of market action – price change and volume – and use them to provide insights on a bar-by-bar basis of what the market is doing, and what it may be about to do next.
When considering a new indicator, such as the Market Facilitation Index, it is important to make sure you fully understand how it works before attempting to integrate it into your trading.
FAQ
How to read Market Facilitation Index indicator?
The Market Facilitation Index is depicted by a series of coloured bars underneath the main price chart. Each bar’s colour is determined by how its Market Facilitation Index value and volume compares to the previous bar.
- Green bars indicate that both the Market Facilitation Index and volume has increased.
- Brown bars indicate that both the BW MFI and volume have decreased.
- Blue bars show that the Market Facilitation Index has increased whilst volume has decreased.
- Pink bars signify that Market Facilitation Index has decreased and volume has increased.
Other Articles You May Find Interesting:
- How to Trade with the Money Flow Index Indicator
- How to Use the Parabolic SAR Indicator
- How to Use the CCI Indicator
About Admirals
Admirals is a multi-award winning, globally regulated Forex and CFD broker, offering trading on over 8,000 financial instruments via the world's most popular trading platforms: MetaTrader 4 and MetaTrader 5. Start trading today!
This material does not contain and should not be construed as containing investment advice, investment recommendations, an offer of or solicitation for any transactions in financial instruments. Please note that such trading analysis is not a reliable indicator for any current or future performance, as circumstances may change over time. Before making any investment decisions, you should seek advice from independent financial advisors to ensure you understand the risks.