Parabolic SAR: What It Is and How to Use It

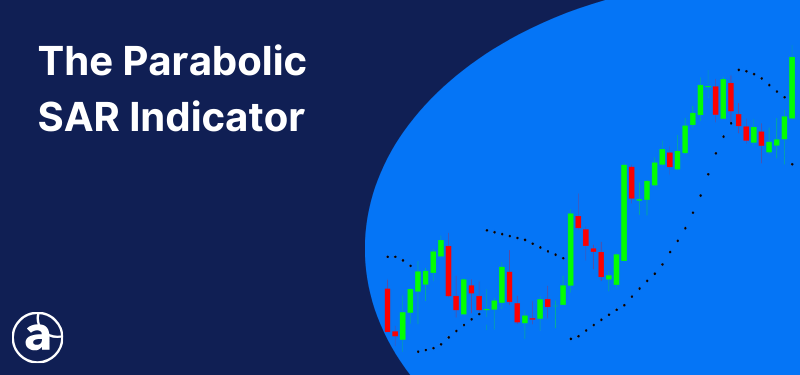
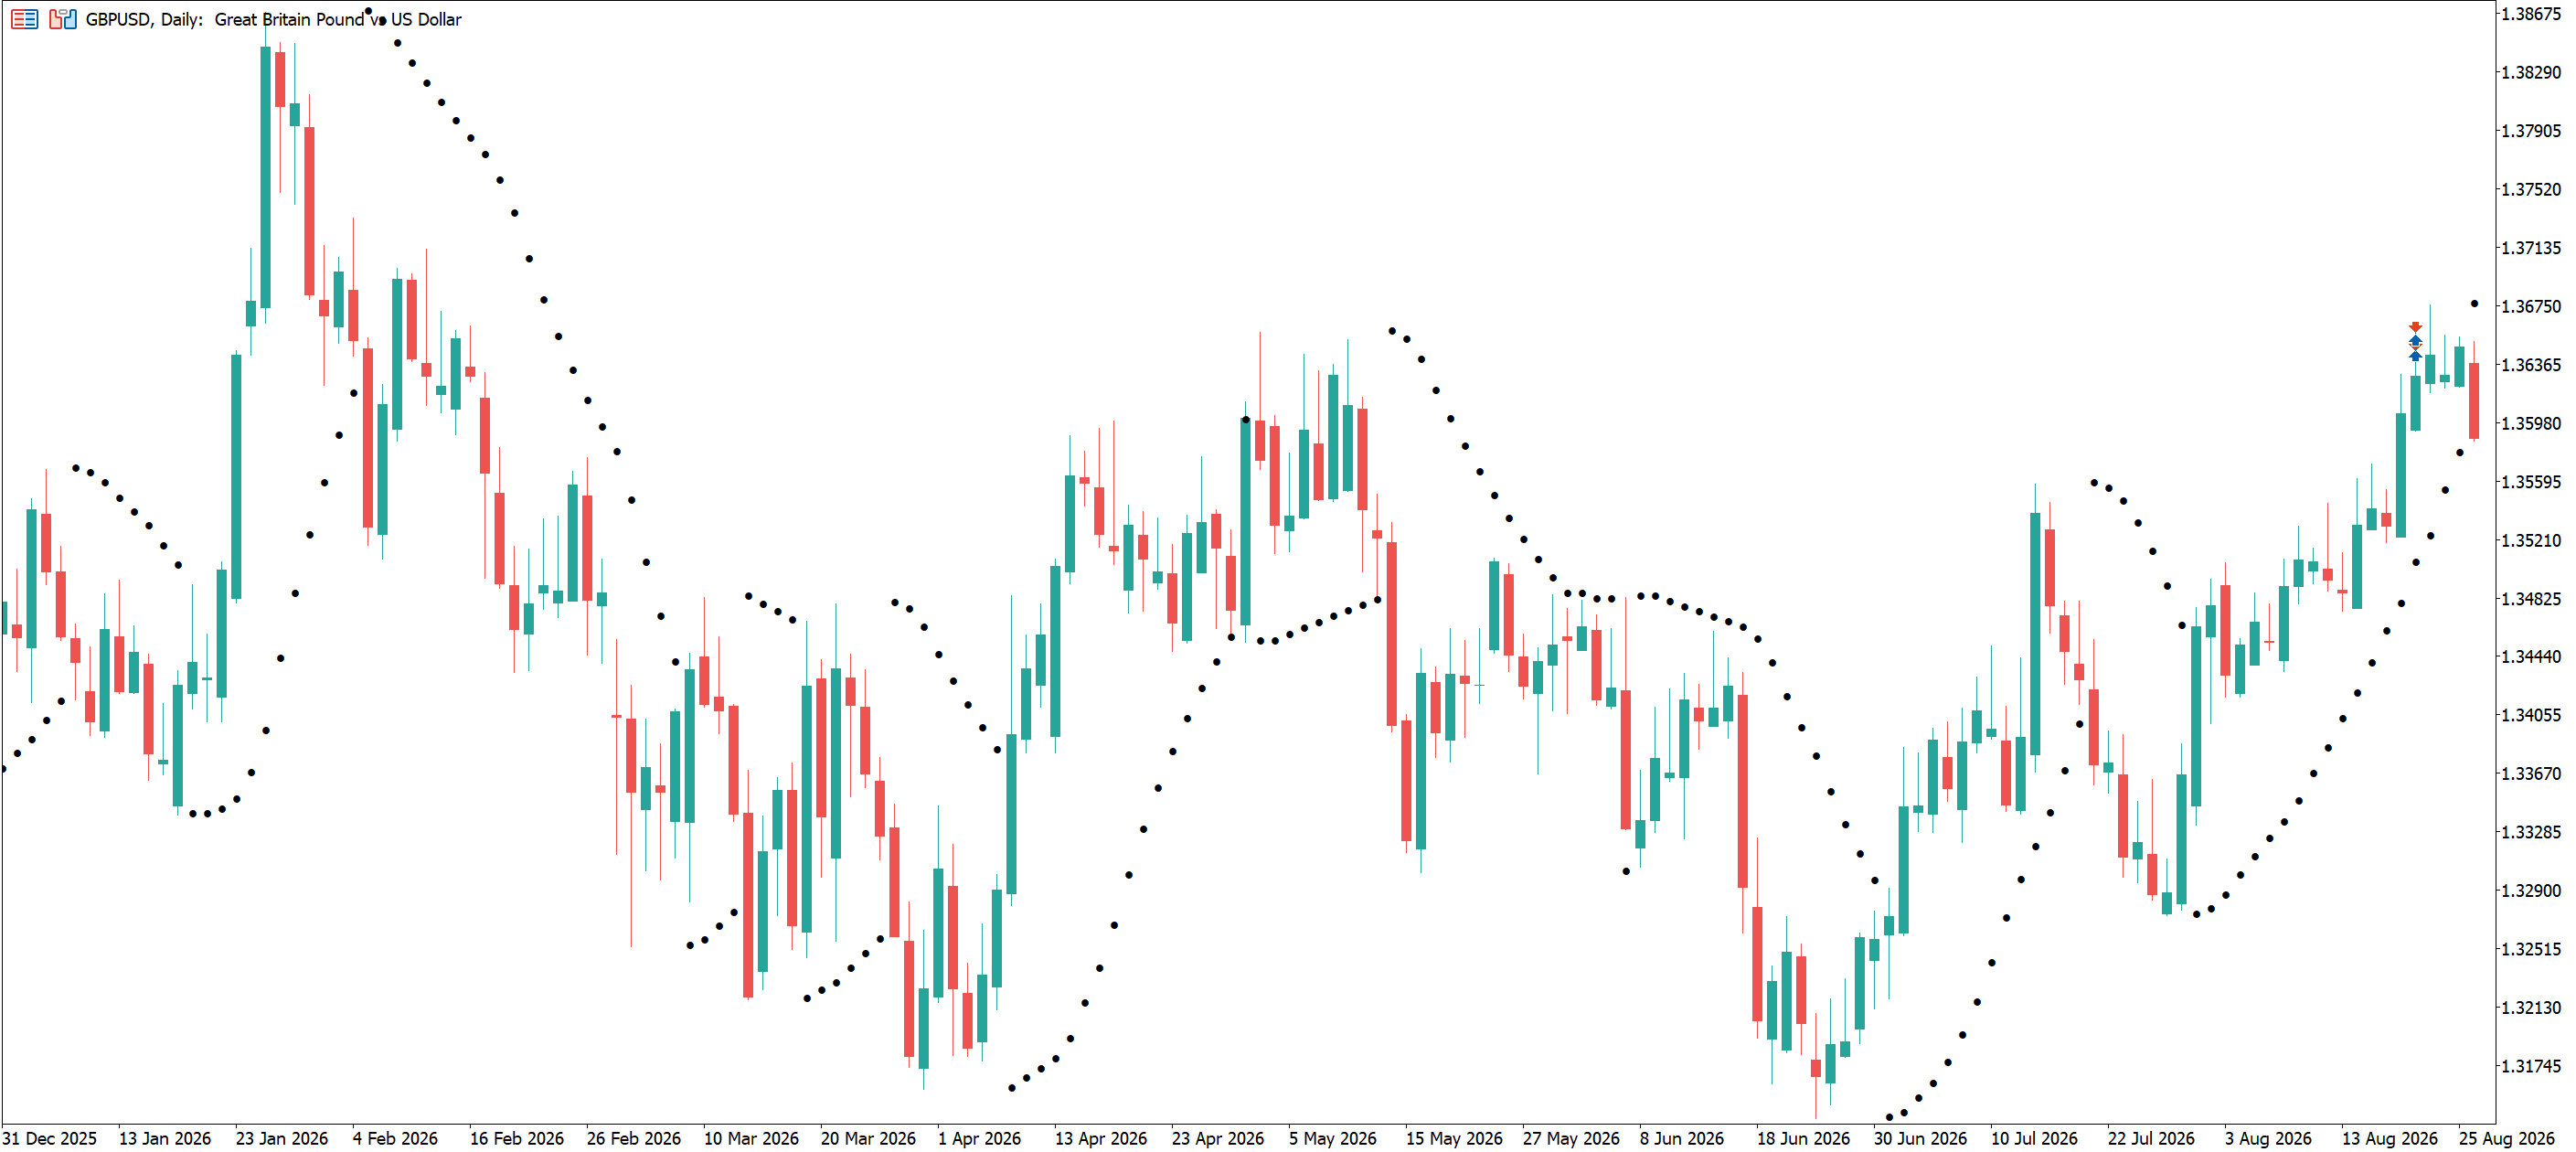
The Parabolic SAR is a technical indicator used to help identify the direction of price movement and potential points at which the price may reverse. The indicator appears on a chart as a series of dots; dots below the price indicate an upward trend, whilst dots above the price indicate a downward trend. When the dots switch sides, this may signal a possible reversal.
In this article, we examine how Parabolic SAR works, how it’s calculated, how to interpret its settings and formula, and how it can be incorporated into a Parabolic SAR strategy.
The information in this article is provided for educational purposes only and does not constitute financial advice. Consult a financial advisor before making investment decisions.
Key Takeaways
- The Parabolic SAR indicator uses dots above or below the price to show which direction the market is currently moving in.
- Parabolic SAR trading signals occur when the dots switch sides, although this only indicates a possible reversal rather than confirming one.
- The default Parabolic SAR settings are a Step of 0.02 and a Maximum of 0.20. Adjusting these values can change how closely the dots follow the price.
- The indicator tends to produce clearer signals during sustained trends. Choppy or sideways markets can produce many false signals.
Table of Contents
What Is the Parabolic SAR Indicator?
The Parabolic SAR, short for Parabolic Stop and Reverse, is a technical indicator developed by J. Welles Wilder Jr. It plots a series of dots above or below an instrument’s price to indicate the direction of the trend and to highlight potential changes in the direction of price.
The name “stop and reverse” reflects the indicator’s original design. When the price reached or crossed the SAR level, Wilder’s original system called for an existing position to be closed and reversed.
However, a switch in the dots does not guarantee a reversal and traders may want to seek additional confirmation using other technical analysis tools before taking any action.
How Does Parabolic SAR Work?
The Parabolic SAR indicator calculates a value for each period on a price chart and plots that value as a dot. During an upward move, the dots appear below the price, whilst during a downward move, they appear above it.
As a trend continues and reaches new highs or lows, the dots accelerate towards the price, which produces the curved, parabolic shape that the indicator takes its name from. If the price reaches or crosses the SAR level, the dots switch sides.
How to Read the Parabolic SAR
The Parabolic SAR’s signals depend on the position and movement of the dots:
The distance between the dots and the price is affected by the indicator’s acceleration factor and should not be interpreted as a direct measurement of trend strength.
These Parabolic SAR trading signals can provide potential entry or exit points. However, a switch in the dots does not distinguish between a lasting reversal and a temporary price movement.
Because the indicator is continuously either bullish or bearish, it can produce frequent false signals during choppy or sideways markets. Rather than using signals from the Parabolic SAR in isolation, traders may want to consider them in the context of market conditions and alongside other technical analysis tools.
Parabolic SAR Formula
The Parabolic SAR formula calculates the value of the dot for the current period using information recorded at the end of the previous period:
Current SAR = Prior SAR + Prior AF × (Prior EP − Prior SAR)
Where:
- Current SAR: The Parabolic SAR value being calculated for the current period.
- Prior SAR: The SAR value from the previous period.
- Prior AF: The acceleration factor in effect at the end of the previous period.
- Prior EP: The extreme point recorded by the end of the previous period; the highest high in an uptrend or the lowest low in a downtrend.
The same formula applies in both directions. During an upward trend, the prior extreme point is above the prior SAR, so the difference between them is positive and the SAR rises. In a downtrend, the prior extreme point is below the prior SAR, meaning the difference is negative which causes the SAR to fall.
The acceleration factor typically begins at 0.02. Each time the price establishes a new extreme point in the direction of the trend, it increases by 0.02, up to a default maximum of 0.20. This causes the dots to move towards the price more quickly as the trend continues.
Parabolic SAR Settings
The two Parabolic SAR settings which can be adjusted by traders are the Step and the Maximum. Together, they determine how quickly the dots accelerate towards the price as a trend develops.
- Step: the initial acceleration factor and the amount by which it increases when price reaches a new extreme. A higher value causes dots to follow price more closely, whilst a lower value means the dots remain further from the price.
- Maximum: the maximum level the acceleration factor can reach. A higher value allows the dots to accelerate further during a sustained trend; a lower value restricts how closely dots can approach price.
The default values on many trading platforms are a Step of 0.02 and a Maximum of 0.20.
Higher values tend to result in the indicator being more responsive. Although this may identify changes in trend earlier, it also produces more false signals based on short-term fluctuations. Less responsive settings can filter out some of this noise but may also react later to a genuine change in direction.
Example of a Parabolic SAR Strategy
The Parabolic SAR continuously produces bullish or bearish signals, even during periods when there is no clear trend. One way of helping to filter these signals is to combine the indicator with a trend indicator.
An example of a Parabolic SAR strategy could do this using the moving average indicator:
- When price is above a rising moving average, it indicates an uptrend; when it’s below a falling moving average, it indicates a downtrend.
- Using a moving average to determine the trend, traders may choose to consider bullish signals from the Parabolic SAR during an uptrend and bearish signals during a downtrend. In this example, if a signal from the Parabolic SAR doesn’t align with the underlying trend, the trader would not act on it.
- A change in position of the Parabolic SAR’s dots may prompt a review or exit of the position.
- An exit signal does not necessarily indicate that the trader should “reverse” their position. Instead, in the example strategy, they would first consider the trend according to the moving average.
Combining the two indicators may help reduce the number of false signals but it does not mean that the remaining signals would all be successful.
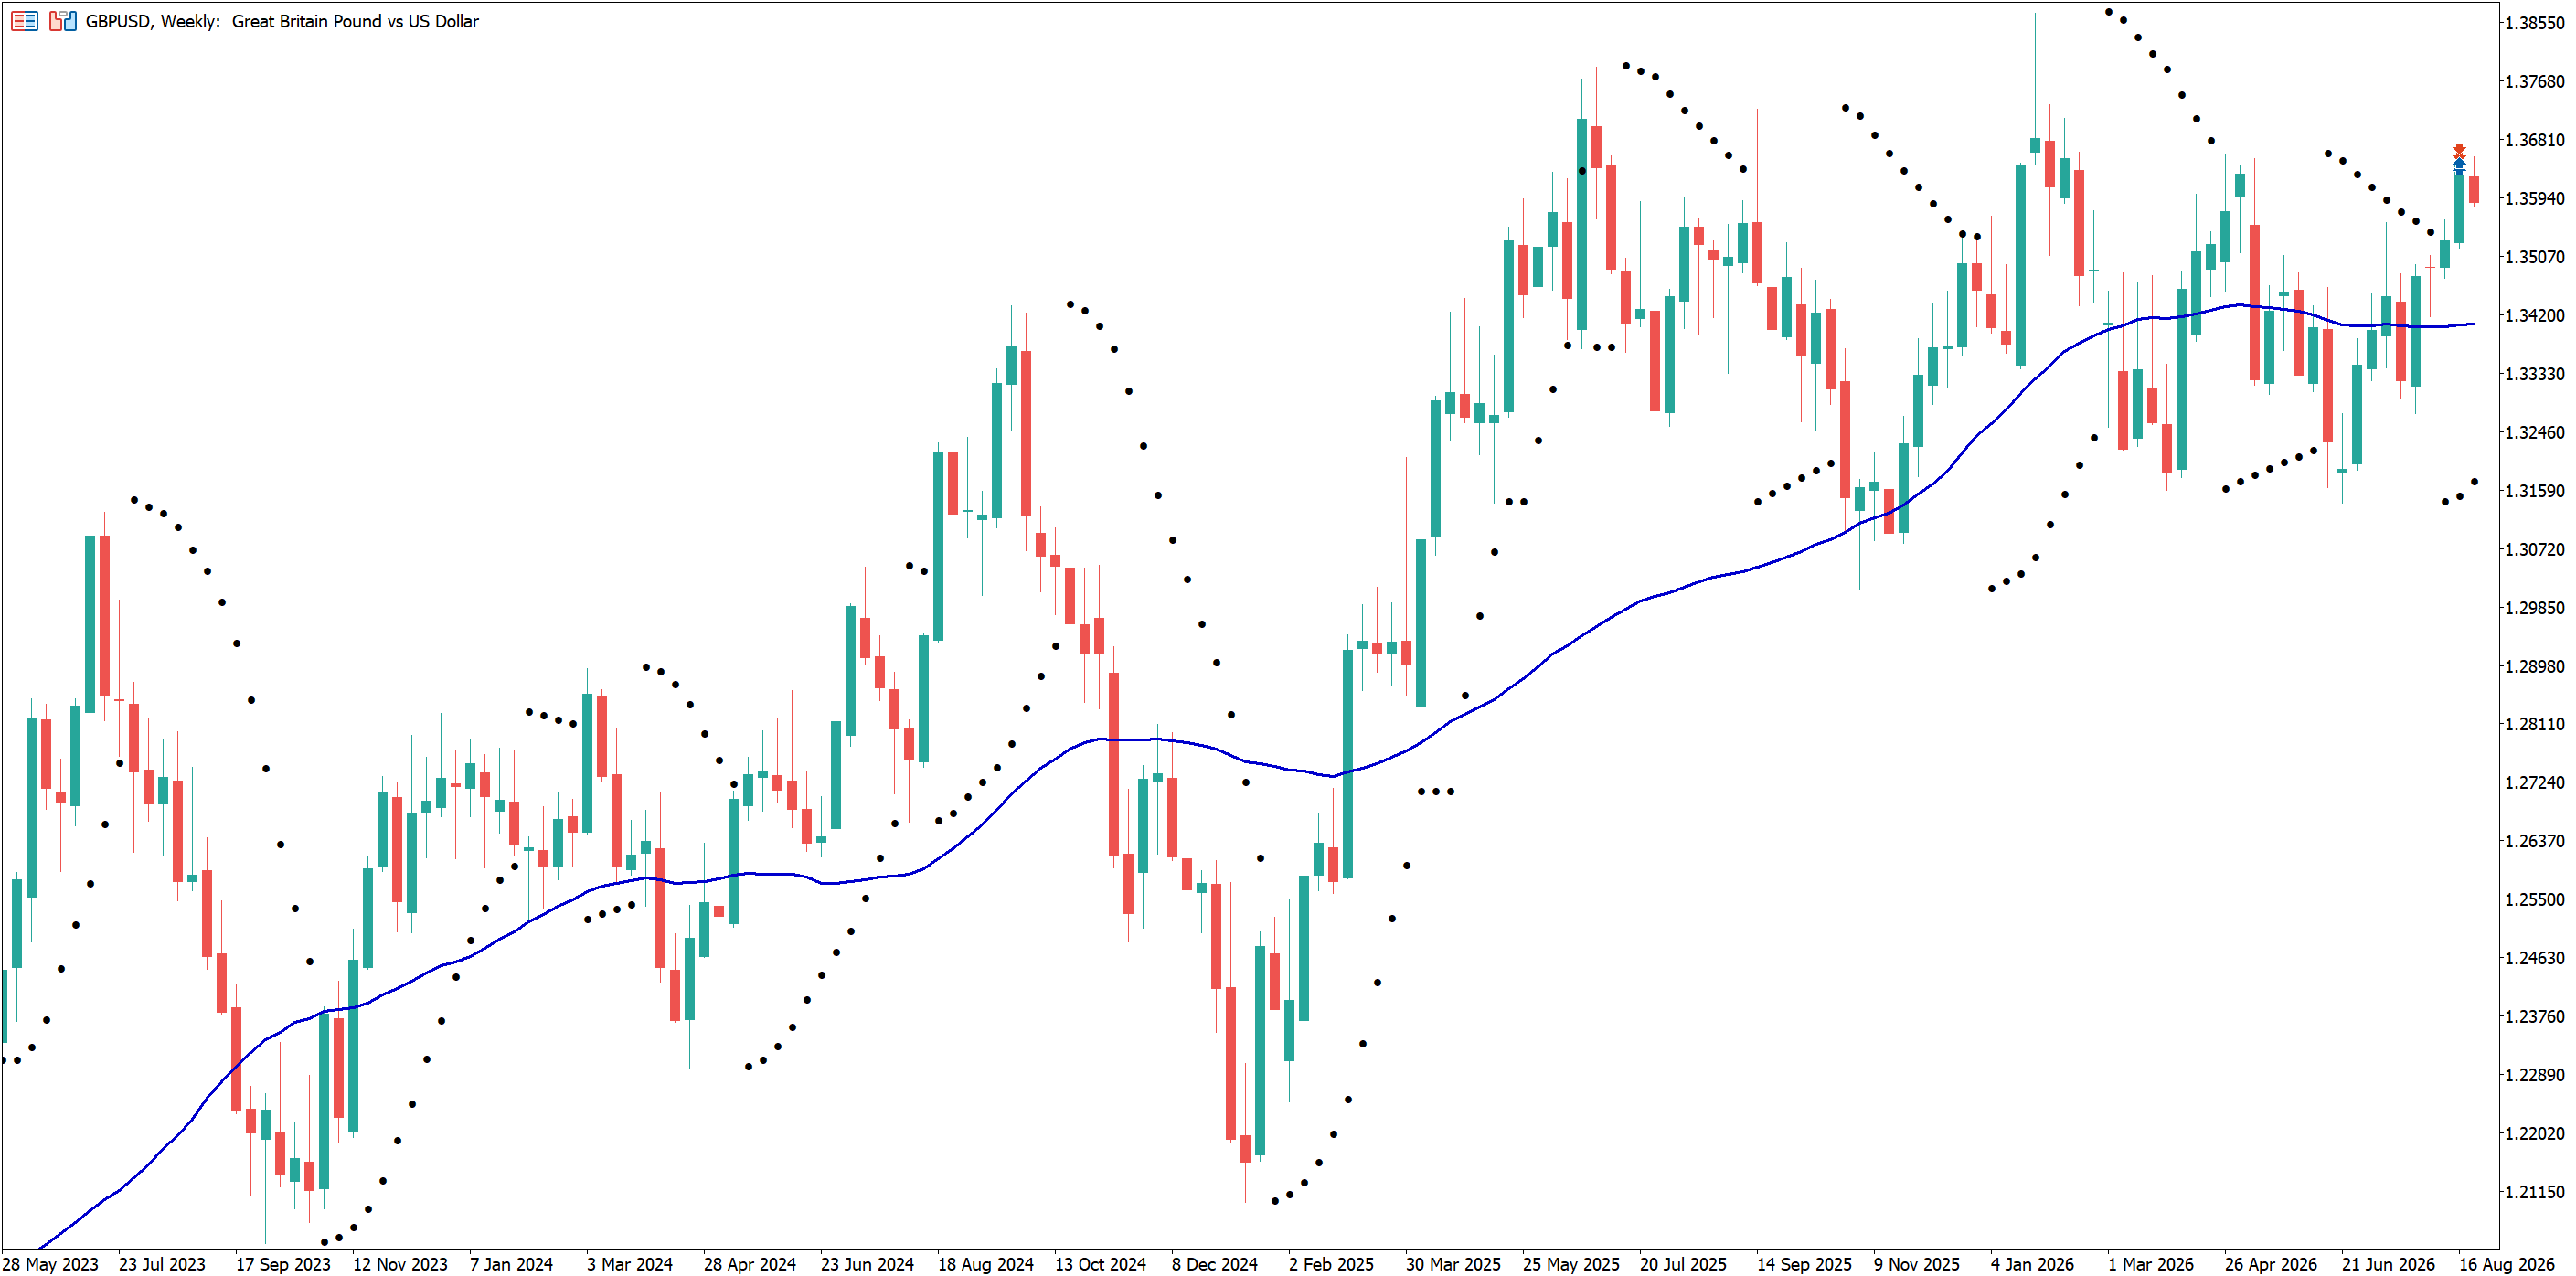
Below is a weekly chart of GBPUSD, with a 50-period moving average and the Parabolic SAR added. The moving average is rising, meaning that, in our example above, traders might consider bullish signals when the price is above the moving average.
Advantages and Limitations of Parabolic SAR
The Parabolic SAR provides clear, rule-based signals, but its usefulness can depend on market conditions amongst other things.
Advantages
- Simplicity: Dots make the indicator easy to interpret.
- Reversal signals: Dot flips provide clearly defined reversal signals.
- Exit management: SAR values can provide a reference for managing exits.
- Versatility: The indicator can be used across different markets and timeframes.
Disadvantages
- Trend strength: Position of the dots does not indicate the strength of a trend.
- Lag: Signals lag behind price and may occur after a reversal has begun.
- Sensitivity: More sensitive settings can cause frequent false signals.
- Choppy markets: In choppy or sideways markets it can produce lots of false signals.
A key disadvantage is that the Parabolic SAR is continuously either bullish or bearish, even when the market has no clear direction. In a ranging market, the dots may repeatedly switch sides as the price fluctuates within a range, which can produce a series of short-lived signals.
How to Add Parabolic SAR in MT4 and MT5
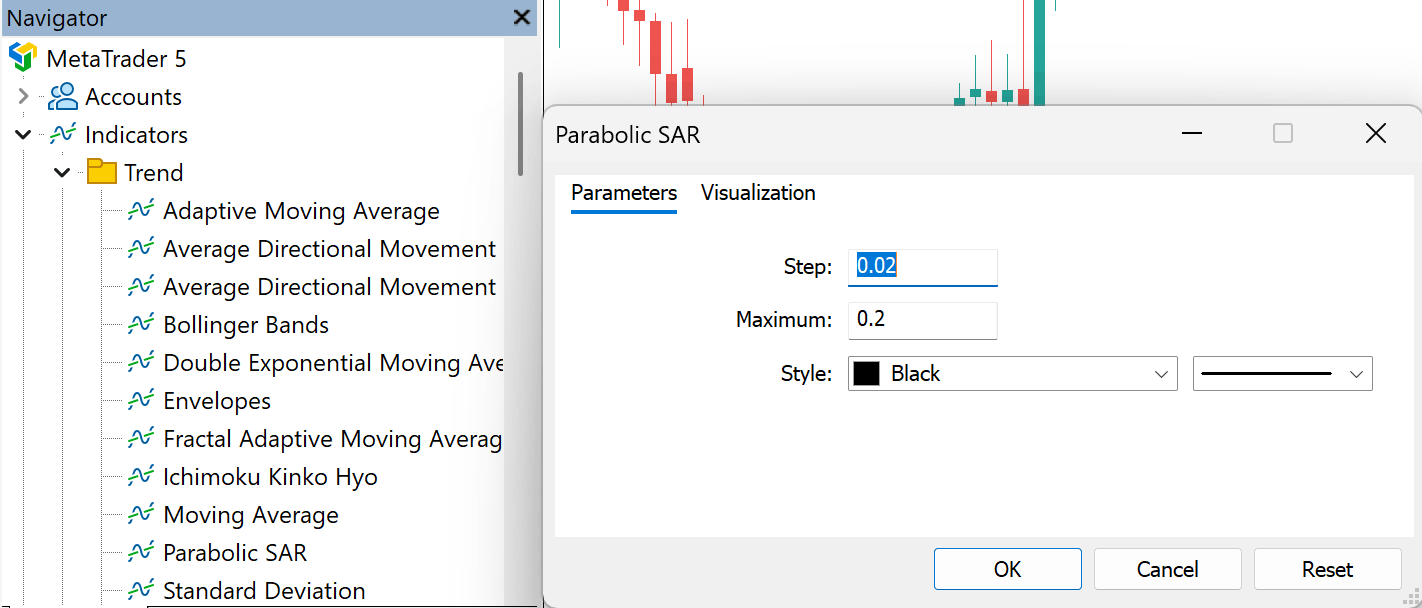
The Parabolic SAR is included as a standard indicator in both MetaTrader 4 (MT4) and MetaTrader 5 (MT5). The process for adding it to a chart is the same on both platforms:
- Open a price chart.
- Open the Navigator window on the left of the screen and expand Indicators.
- Open the Trend folder and locate Parabolic SAR.
- Drag the indicator onto the chart or double-click it.
- Review the Step and Maximum settings, their default values are 0.02 and 0.20, respectively.
- Select OK to add the indicator.
Parabolic SAR can also be added through Insert > Indicators > Trend > Parabolic SAR. Once applied, the dots appear directly above or below the price rather than in a separate indicator window.
Frequently Asked Questions
What Does Parabolic SAR Stand For?
Parabolic SAR stands for Parabolic Stop and Reverse. The name reflects the indicator’s original system, which called for positions to be closed and reversed when the price crosses the SAR level. When the dots flip sides, it may also be interpreted as a potential entry or exit signal rather than an instruction to reverse a position.
What Are the Default Parabolic SAR Settings?
The default settings are typically a Step of 0.02 and a Maximum of 0.20. The Step sets the initial acceleration factor and the amount by which it increases when a new extreme point is reached. The Maximum limits the level which the acceleration factor can rise to.
Is Parabolic SAR a Leading or Lagging Indicator?
The Parabolic SAR is a lagging indicator because its values are calculated from price movements that have already taken place. Consequently, its signals may appear after a trend or reversal has already begun.
Can Parabolic SAR Be Used in Sideways Markets?
The Parabolic SAR can be applied in sideways markets, but it tends to produce less reliable signals under these conditions. Because the indicator is continuously either bullish or bearish, relatively small price movements can cause the dots to switch sides repeatedly.
INFORMATION ABOUT ANALYTICAL MATERIALS:
The given data provides additional information regarding all analysis, estimates, prognosis, forecasts, market reviews, weekly outlooks or other similar assessments or information (hereinafter “Analysis”) published on the websites of Admirals investment firms operating under the Admirals trademark (hereinafter “Admirals”) Before making any investment decisions please pay close attention to the following:
- This is a marketing communication. The content is published for informative purposes only and is in no way to be construed as investment advice or recommendation. It has not been prepared in accordance with legal requirements designed to promote the independence of investment research, and that it is not subject to any prohibition on dealing ahead of the dissemination of investment research.
- Any investment decision is made by each client alone whereas Admirals shall not be responsible for any loss or damage arising from any such decision, whether or not based on the content.
- With view to protecting the interests of our clients and the objectivity of the Analysis, Admirals has established relevant internal procedures for prevention and management of conflicts of interest.
- The Analysis is prepared by an analyst (hereinafter “Author”), with the assistance of AI tools. The Author Roberto Rivero is a contractor for Admirals. This content is a marketing communication and does not constitute independent financial research.
- Whilst every reasonable effort is taken to ensure that all sources of the content are reliable and that all information is presented, as much as possible, in an understandable, timely, precise and complete manner, Admirals does not guarantee the accuracy or completeness of any information contained within the Analysis.
- Any kind of past or modelled performance of financial instruments indicated within the content should not be construed as an express or implied promise, guarantee or implication by Admirals for any future performance. The value of the financial instrument may both increase and decrease and the preservation of the asset value is not guaranteed.
- Leveraged products (including contracts for difference) are speculative in nature and may result in losses or profit. Before you start trading, please ensure that you fully understand the risks involved.