How to Use the RSI Indicator in Trading
The RSI indicator (Relative Strength Index) is one of the most widely used momentum indicators in technical analysis. Developed to measure the speed and magnitude of price movements, the RSI helps traders identify overbought and oversold conditions, assess trend strength and spot potential momentum shifts.
This guide explains how the RSI indicator works, how to interpret its signals, examples of RSI trading strategies and how to apply the indicator on MetaTrader 5 (MT5).
The information in this article is provided for educational purposes only and does not constitute financial advice. Consult a financial advisor before making investment decisions.
Table of Contents
- Key Takeaways
- What Is the RSI Indicator?
- How the RSI Indicator Works
- RSI Settings
- How to Interpret RSI Values
- RSI Divergence Explained
- Examples of RSI Trading Strategies
- Advantages & Limitations of RSI
- Common Mistakes When Using the RSI Indicator
- How to Use the RSI Indicator on MT5
- FAQ: RSI Indicator
Key Takeaways
- • The RSI indicator (Relative Strength Index) measures momentum by comparing recent gains and losses on a scale from 0 to 100.
- • Readings above 70 can indicate an overbought market, whilst readings below 30 may indicate oversold conditions.
- • Divergence between an asset’s price and the RSI may indicate a potential reversal.
- • The RSI should be used as part of a broader trading approach that includes confirmation and risk management.
What Is the RSI Indicator?
The Relative Strength Index (RSI) is a technical indicator used to measure price momentum. It was developed by J. Welles Wilder Jr. and introduced in his 1978 book on technical trading systems.
Rather than focusing purely on price direction, the RSI measures the speed and magnitude of recent price changes. It does this by comparing the average size of recent gains to the average size of recent losses over a chosen lookback period.
The result is plotted on a scale from 0 to 100. Higher values indicate stronger buying pressure over the lookback period, whereas lower values indicate stronger selling pressure.
It is important to note that the RSI does not predict price direction on its own. Instead, it highlights the balance of momentum.
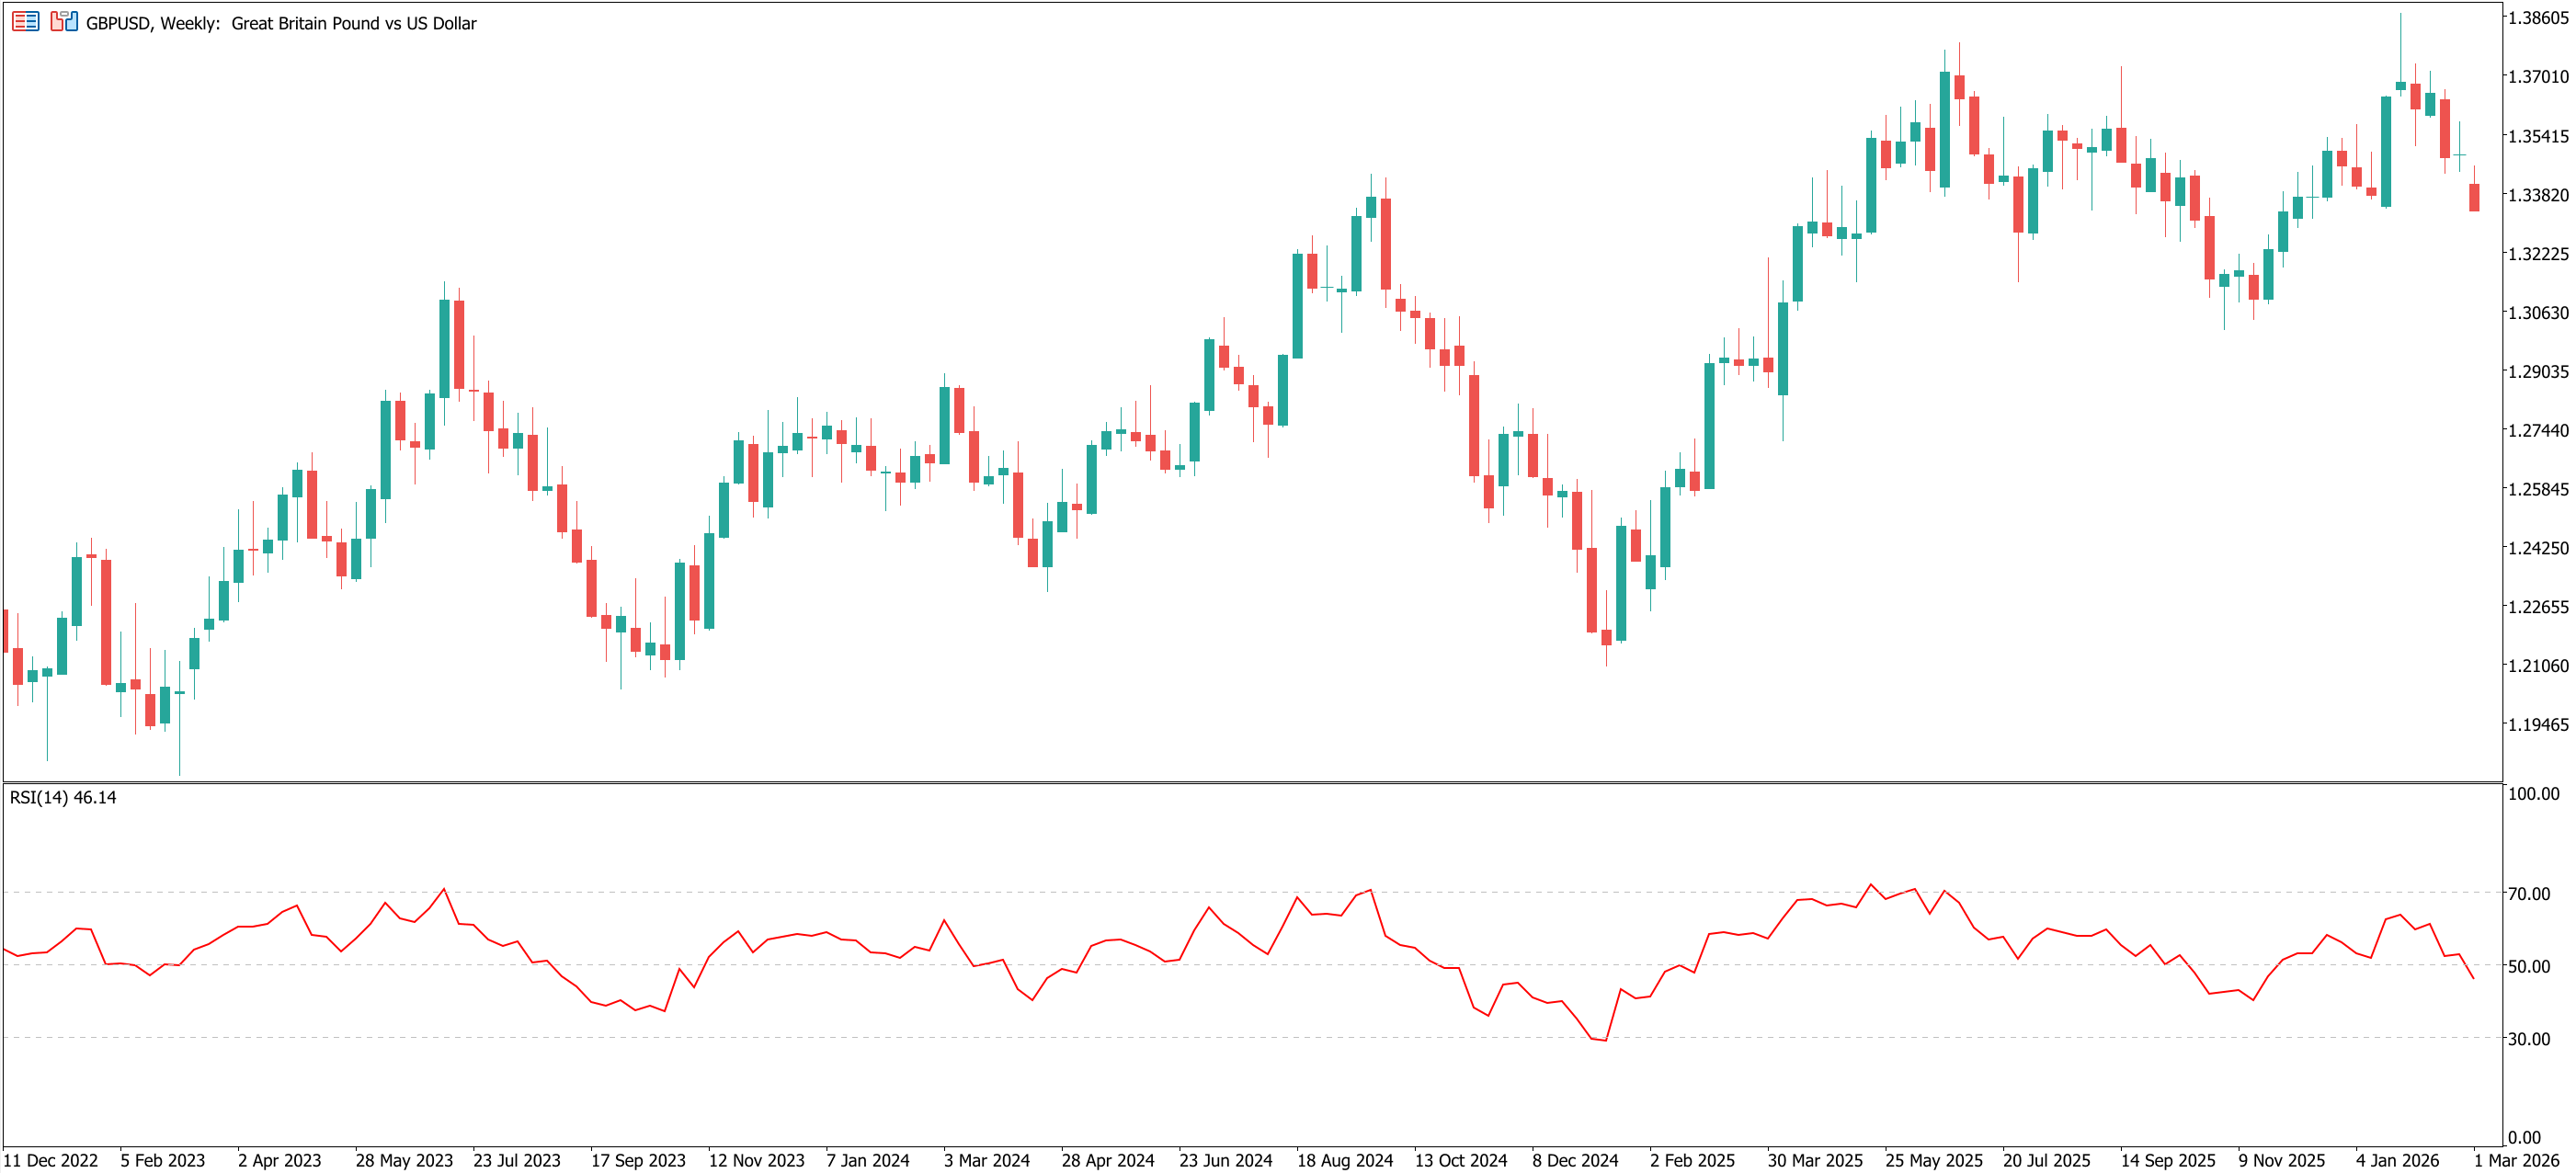
Below is an example of what the RSI indicator looks like when added to a price chart.
How the RSI Indicator Works
Now that we’ve defined what the RSI indicator is, the next step is to understand how it works. Whilst most trading platforms calculate it automatically, knowing the logic behind the formula can help traders better understand signals and avoid common misunderstandings.
The RSI Formula Explained
The standard formula for the Relative Strength Index is:
RSI = 100 − [100/(1+RS )]
Where:
RS (Relative Strength) = Average Gain ÷ Average Loss
The calculation typically follows these steps:
- Choose a look-back period (14 periods is the standard).
- Calculate the average gain over that period. Periods with a loss are counted as zero.
- Calculate the average loss over that period (expressed as a positive value). Periods with a gain are counted as zero.
- Divide the average gain by the average loss to get the Relative Strength (RS).
- Apply the RSI formula to convert that value into a number between 0 and 100.
If average gains outweigh average losses, the RS value rises, pushing the RSI closer to 100. If average losses outweigh gains, the RS falls, pushing the RSI closer to 0.
Note: In the calculations, the first averages are calculated as simple means over the look-back period. After the first RSI value, the averages are updated using Wilder’s smoothing, which gradually incorporates new gains or losses whilst keeping the averages mostly based on previous values.
RSI Settings
The default RSI setting is usually 14 periods, which was originally suggested by its creator and offers a balance between responsiveness to price and stability.
However, the standard settings might not be suitable for everyone. Traders may choose to adjust the period depending on their style, trading strategy and market conditions.
- Shorter periods: Likely to appeal to shorter-term traders. The RSI is more sensitive which results in more frequent signals but increases the risk of false signals.
- Longer periods: Likely to appeal to longer-term traders. The RSI is smoother, slower to react and produces fewer signals.
The table below shows examples of which RSI settings may be suitable for different types of trading styles.
How to Interpret RSI Values
Understanding RSI values can help traders apply the indicator more effectively and gain insights into momentum, potential reversals and market balance.
Overbought and Oversold Levels (70/30)
Traditionally, RSI readings above 70 are described as overbought, whilst readings below 30 are described as oversold.
- Above 70: Recent price gains are strong. Traders often view this as a potential warning that the market may be extended, though prices may continue rising for some time.
- Below 30: Recent price losses are strong. Traders may interpret this as a potential signal that the market is oversold, though prices can continue to fall in strong downtrends.
Being overbought or oversold does not guarantee a price reversal. Instead, they indicate that momentum has reached an extreme relative to recent history.
In trending markets, it's possible for the RSI to stay above 70 or below 30 for extended periods, so these signals must always be interpreted in context.
The 50 Level
The 50 level acts as the midpoint of the RSI scale and can serve as a simple momentum gauge:
- Above 50: May indicate bullish momentum - buyers are in control.
- Below 50: May indicate bearish momentum - sellers are in control.
- Around 50: A reading of 50 would indicate a balance between buying and selling pressure.
RSI in Trending vs Ranging Markets
The behaviour of the RSI differs significantly depending on whether the market is trending or rangebound:
- Trending markets: The RSI can remain in overbought or oversold territory for extended periods. In a strong uptrend, the RSI may repeatedly touch 70 without triggering a reversal. Treating 70/30levels as overbought/oversold in this context can produce false signals.
- Ranging markets: The RSI might oscillate more predictably between 30 and 70, which could make it more reliable for identifying overbought and oversold conditions.
Practical tip: Some traders may adjust the RSI thresholds during a strong trend, for example, using 80/20 to indicate overbought/oversold instead of 70/30. This may help reduce false signals.
RSI Divergence Explained
Divergence is an important concept for identifying potential trend reversals with the RSI.
It occurs when the price of an asset and the RSI indicator move in opposite directions, suggesting that momentum may be weakening and a change in trend could occur.
Bullish Divergence
Bullish divergence occurs when price makes lower lows whilst the RSI indicator forms higher lows. This suggests that selling momentum may be decreasing, even though price continues to fall.
Bullish divergence tends to be more informative near key support levels or after a sustained downtrend. Traders often look for confirmation with other technical indicators to attempt to filter out false signals.
Bearish Divergence
Bearish divergence occurs when the price makes higher highs, but the RSI forms lower highs. This indicates that upward momentum may be fading, even as the price continues to rise.
Bearish divergence might be more significant near key resistance levels or during strong uptrends. Traders may use additional indicators or price patterns to confirm potential signals.
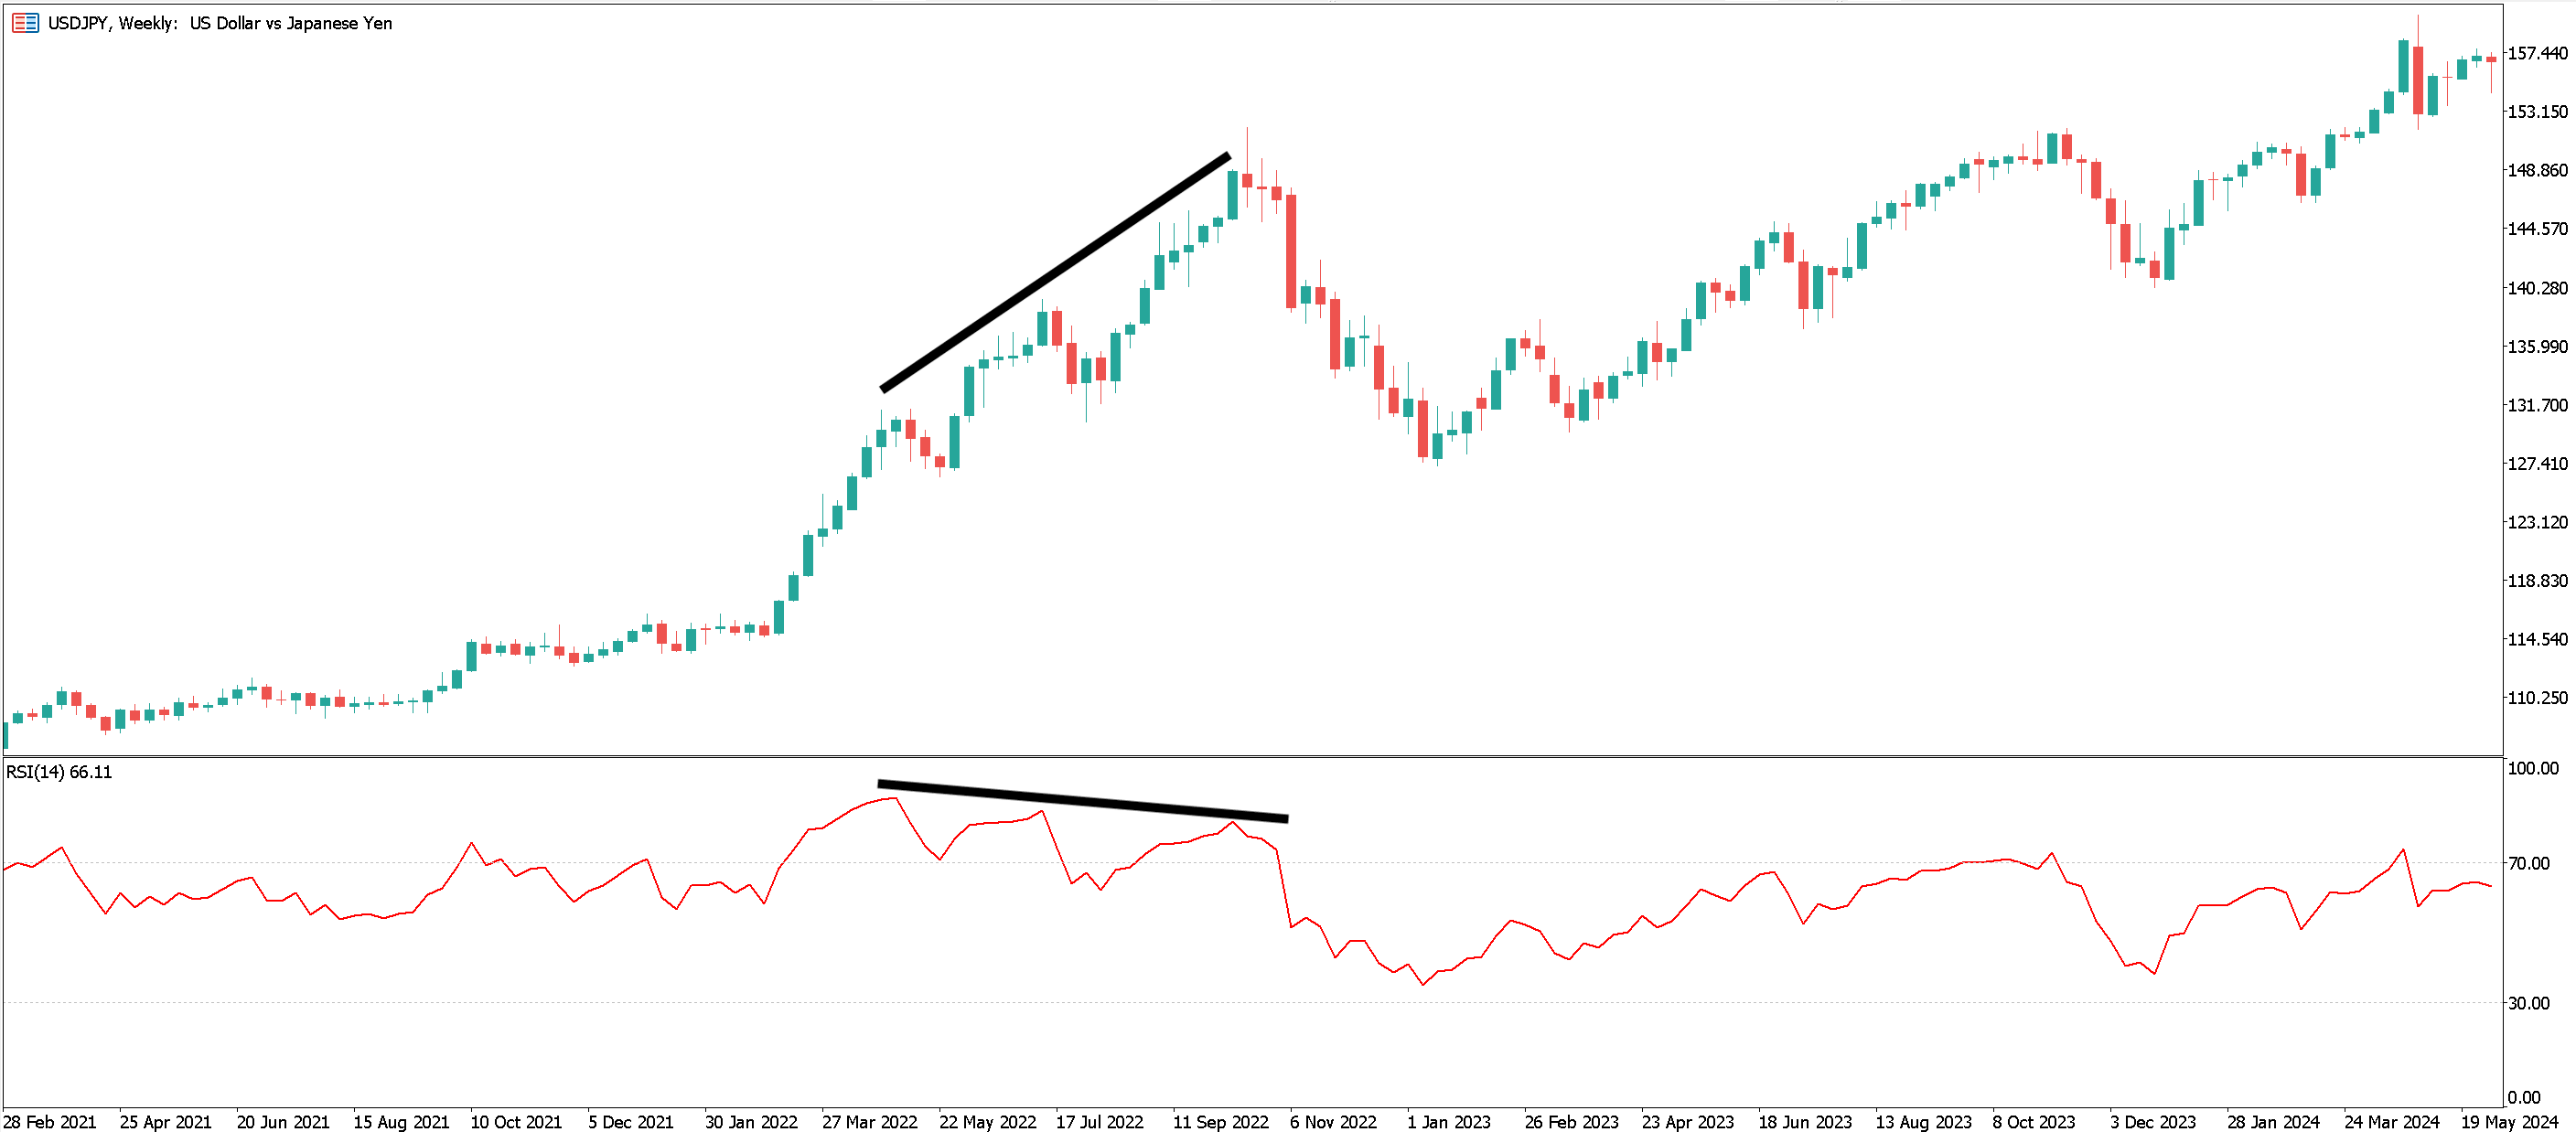
The chart below shows an example of bearish divergence with the RSI. The divergence takes place during an uptrend and is followed by a temporary pullback in price.
When to Consider Trading RSI Divergence
✅ Near key support or resistance levels
✅ After a sustained trend (when momentum starts to wane)
✅ With confirmation from other indicators (e.g. moving averages)
✅ In liquid markets
When Not to Trade RSI Divergence
❌ During a strong, uninterrupted trend
❌ On illiquid assets
❌ Without additional confirmation
❌ Around major news or market events
Examples of RSI Trading Strategies
Now we understand more about the Relative Strength Index, in this section, we will highlight some common ways in which traders use it.
Trend Continuation Pullbacks
In trending markets, many traders tend to focus on trades which align with the overall trend. The RSI may be used to help find entry points as follows:
📈 Uptrend Example
Signal:
- RSI dips toward or below 30 during a pullback
- RSI rebounds back above 30 as price stabilises
- Traders may interpret this as a signal to ‘buy the dip’
Confirmation: The chart shows a bullish price action signal.
Stop-Loss: Could be placed just below the recent swing low or below the trend support.
Target: Could be the most recent swing high, the next structural resistance or based on a predefined risk-reward ratio.
📉 Downtrend Example
Signal:
- RSI rises towards or above 70 during a pullback
- RSI rebounds below 70 as prices stabilise
- Traders may interpret this as a signal to ‘sell the rally’
Confirmation: Chart shows a bearish price action signal.
Stop Loss: May be placed just above recent swing high or above resistance.
Target: Could be the most recent swing low, a level of historic support or a predetermined risk-reward.
Key Point: Interpreting RSI extremes without considering the trend can be misleading, as strong trends can keep the RSI in overbought or oversold zones for extended periods.
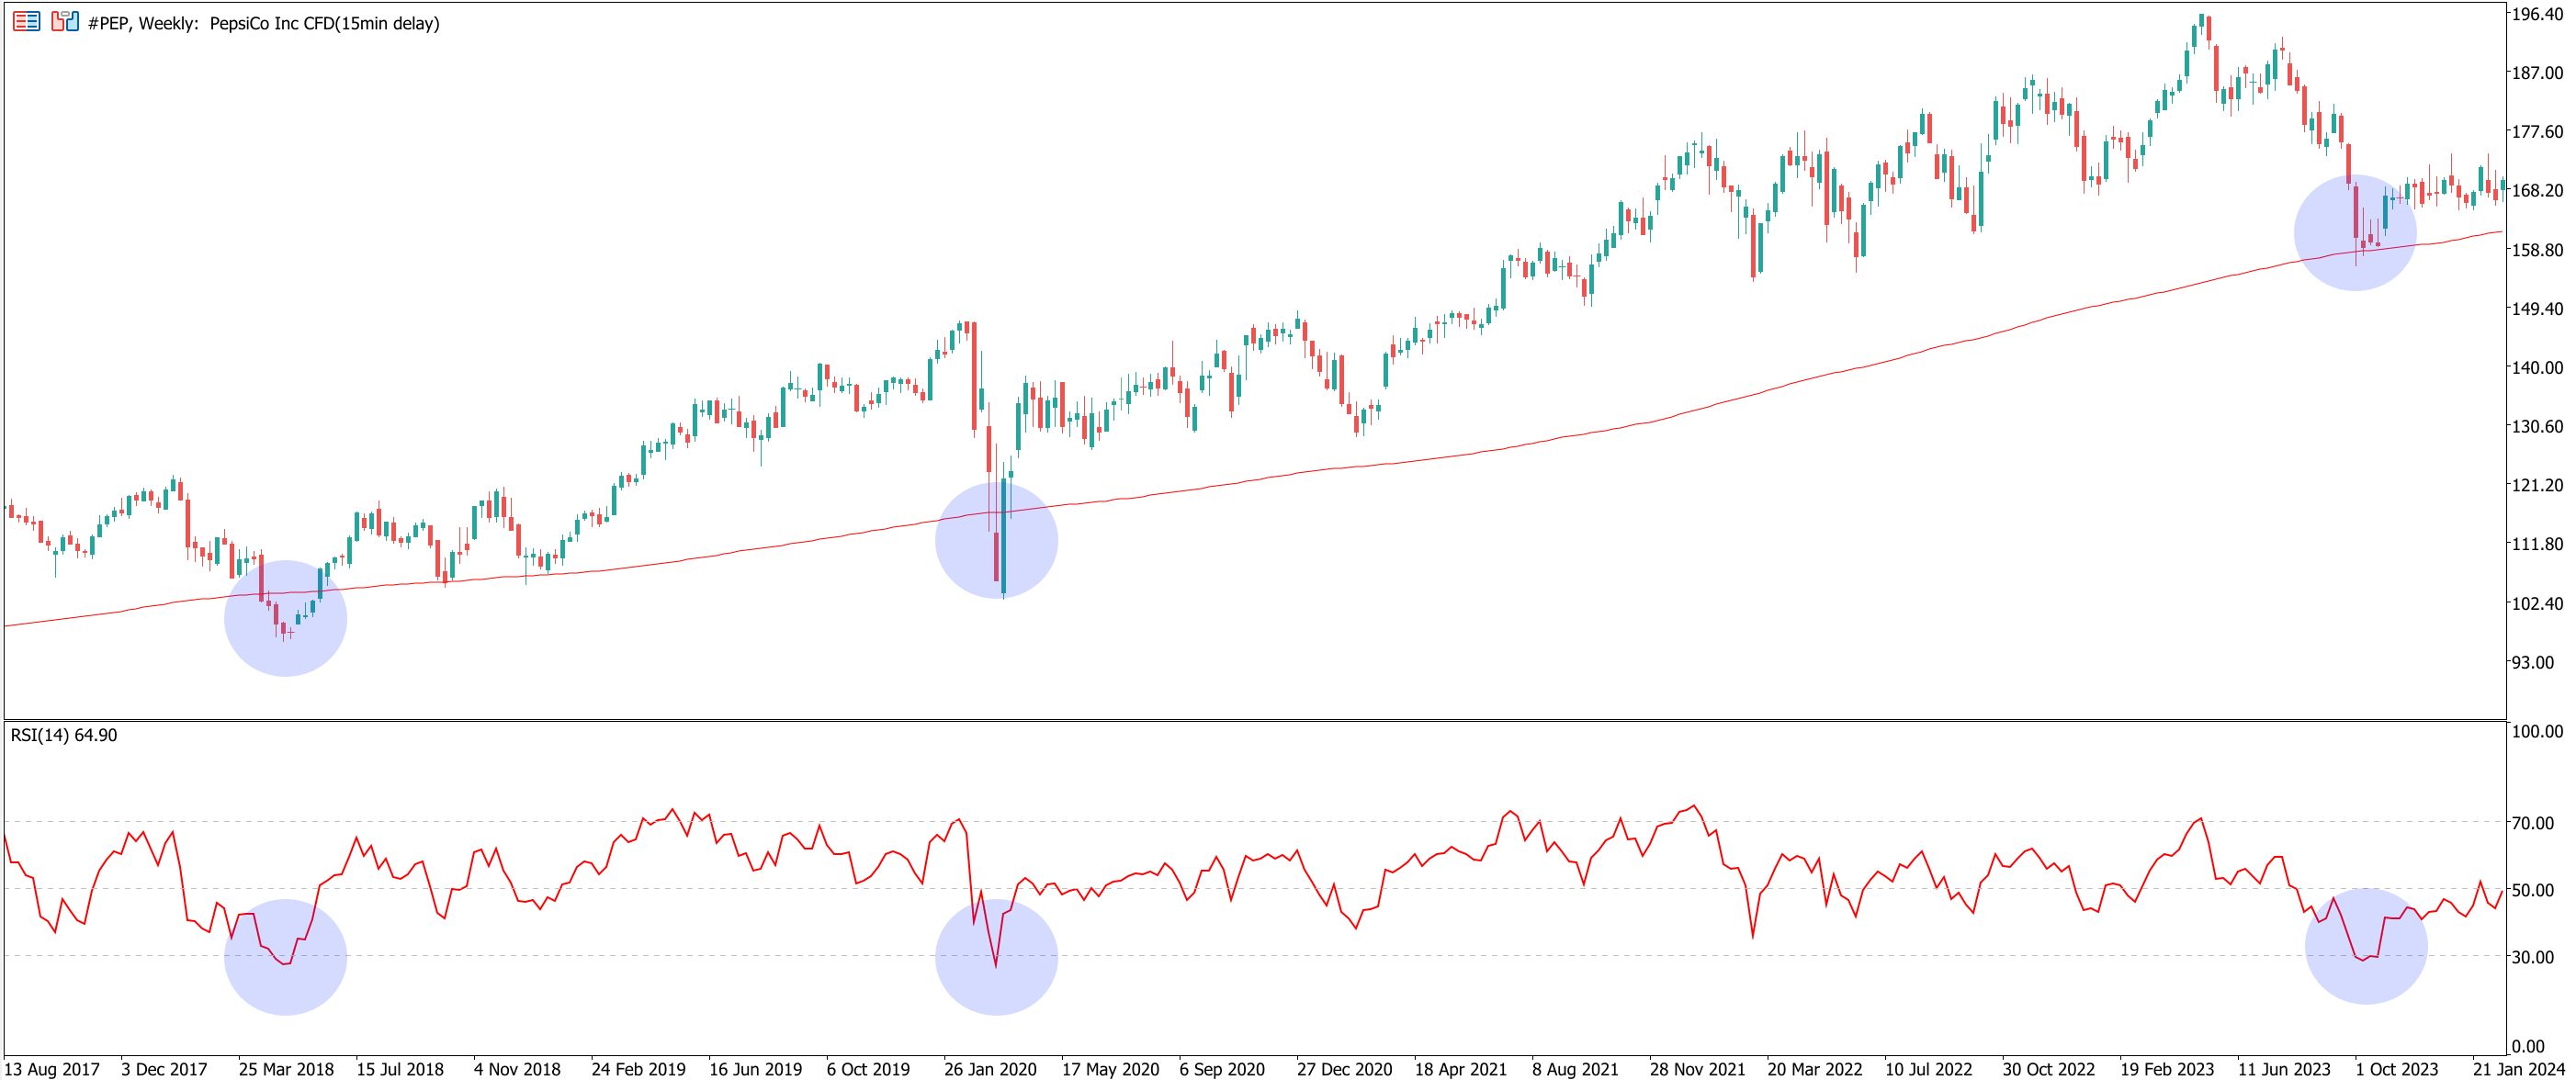
In the weekly chart of PepsiCo below, we can see three occasions where, during an uptrend, price retreats towards its 200-period moving average. At the same time, the RSI briefly breaks below 30 before rebounding as price resumes its upward trend.
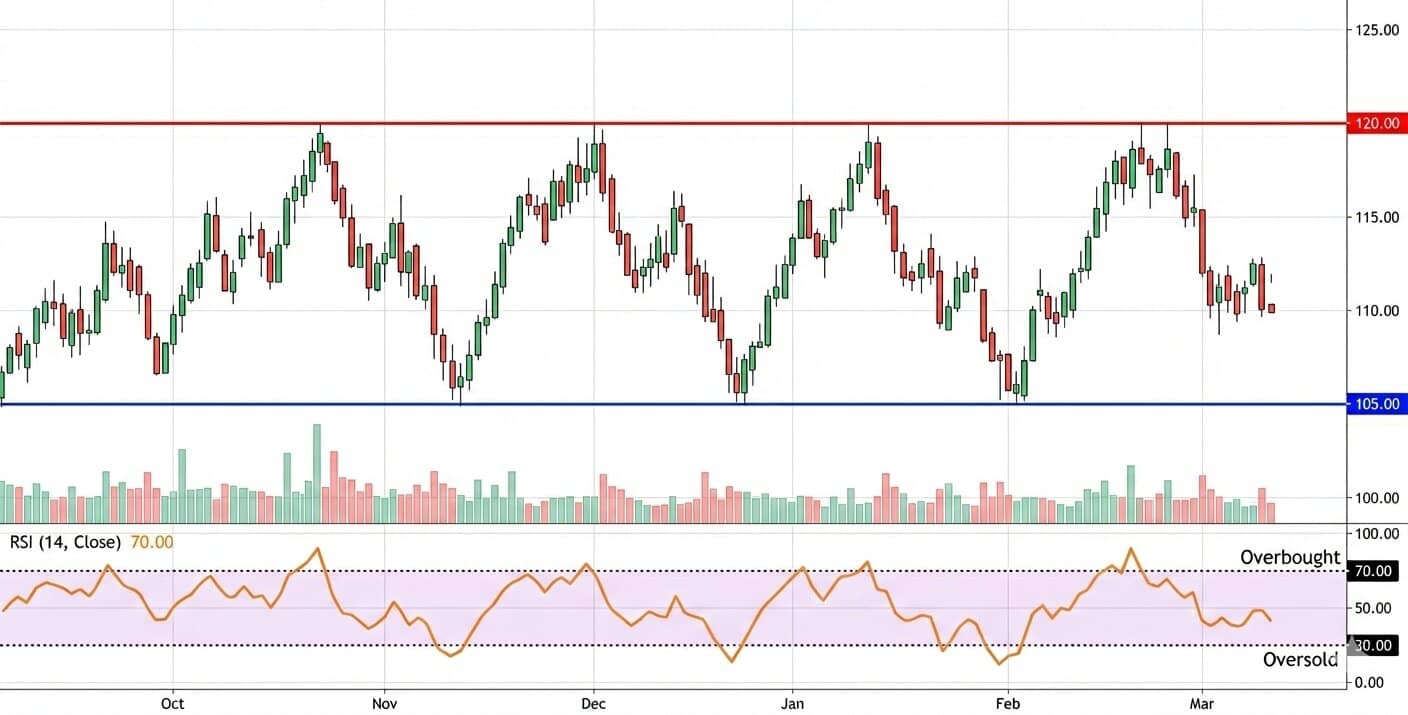
Range-Based Reversals
In a range-bound market, the RSI can help identify potential turning points as price bounces between support and resistance levels.
Traders may consider:
- Long positions when the RSI approaches 30 and price is near the lower boundary of the range.
- Short positions when the RSI approaches 70 and price is near the upper boundary.
Traders may look for a reversal candlestick pattern, or other confirmation, before taking a position. Stop loss levels are typically placed just outside the range, whilst targets often aim for the midpoint of the range.
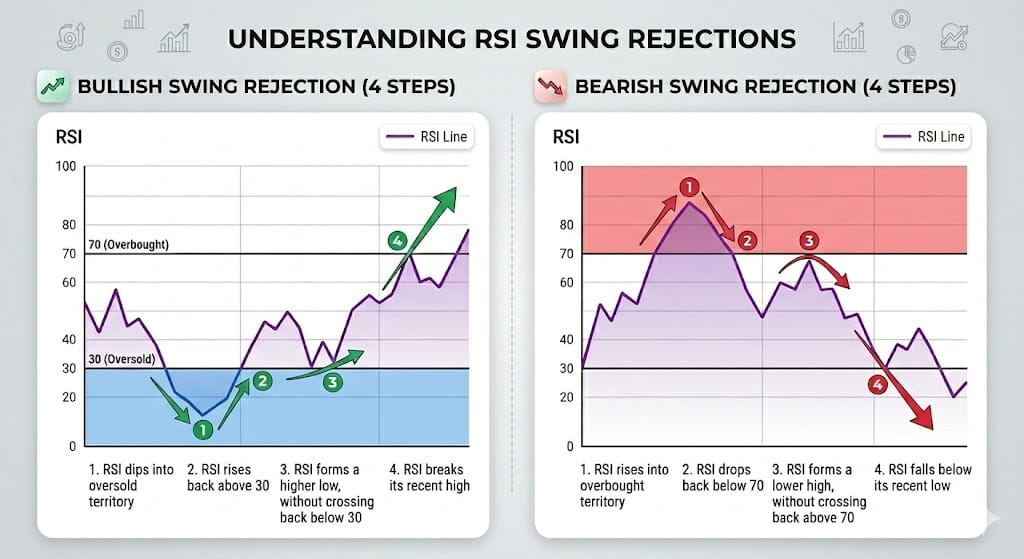
Swing Rejections
RSI swing rejections, also known as failure swings, occur when the RSI reverses after reaching an extreme, highlighting a potential shift in momentum. These signals might be more reliable if they align with the prevailing trend.
Bullish Swing Rejection
Potential Buy Signal
- Oversold: RSI dips below 30, reflecting heavy selling pressure.
- Initial Recovery: RSI rises back above 30, suggesting selling momentum is easing.
- Higher Low: RSI forms a higher low (stays above 30), indicating buyers are stepping in.
- Breakout: RSI breaks its recent high, signalling upward momentum is gaining strength.
Bearish Swing Rejection
Potential Sell Signal
- Overbought: RSI rises above 70, reflecting heavy buying pressure.
- Initial Pullback: RSI falls back below 70, indicating buying momentum is slowing.
- Lower High: RSI forms a lower high (stays below 70), suggesting sellers are stepping in.
- Breakdown: RSI falls beneath its recent low, signalling downward momentum is increasing.
Tips:
- Confirmation: Combine RSI swing rejections with support/resistance levels, candlestick patterns or other technical indicators to try and confirm the move.
- Trade with the trend: Signals may be more reliable if they align with the prevailing trend.
- Stop-Loss: Could be placed below recent swing lows for long positions or above recent highs for short positions.
- Target: When the RSI enters the opposite extreme, historic support/resistance levels or based on a fixed risk-reward ratio.
Advantages & Limitations of RSI
Like all tools, the Relative Strength Index has strengths and weaknesses. Understanding both can help traders use it more effectively.
Advantages of RSI
✅ Identifies Overbought/Oversold Conditions: When the RSI reaches extreme levels, it can highlight areas where price may be stretched relative to recent movement. Whilst this will not necessarily result in a reversal, it can alert traders to monitor price action more closely for confirmation signals.
✅ Versatility: The RSI can be applied to various markets, including stocks, commodities and Forex.
✅ Divergence: It can be used to spot divergence between price movements and momentum, which may signal a change in the direction of price.
✅ Ease of Use: It’s relatively simple to interpret and is included as standard on most trading platforms.
✅ Highlights Momentum: Unlike trend-following indicators that show direction, the RSI attempts to show the strength behind price moves, which can help traders assess the quality of a move, not just its direction.
Limitations of RSI
❌ False Signals: Like any indicator, the RSI can produce false signals. This is often true in strong trending markets when it can remain in overbought/oversold territory for extended periods.
❌ Not a Standalone Tool: For the above reason, the RSI should be used in conjunction with other technical analysis tools to help filter false signals.
❌ Lagging Indicator: The RSI is based on historical price data and, therefore, cannot be used to accurately predict future price movements. Furthermore, it may be slow to react in fast-moving markets.
Common Mistakes When Using the RSI Indicator
Although the Relative Strength Index (RSI) might seem straightforward to apply, it’s often misused or misinterpreted. In the following sections, we’ll examine some common mistakes made when using the RSI indicator.
Treating Overbought and Oversold as Automatic Reversal Signals
One of the most common errors is assuming that once the RSI breaks above 70 or below 30, it will automatically be followed by a reversal.
As highlighted already, during strong trends, the RSI can remain in overbought or oversold zones for an extended period. Selling simply because the RSI is above 70 or buying automatically because it’sbelow 30 can potentially result in a string of losses.
RSI readings at these levels highlight strong momentum, historically speaking; they do not automatically result in a reversal.
Ignoring Market Context
RSI signals should be interpreted within the current market context. The same reading could mean different things depending on what’s going on in the market.
For example, oversold readings in an uptrend may signal temporary pullbacks in price. However, the same reading during a strong downtrend may reflect sustained selling pressure rather than signal a buying opportunity.
Failing to consider the market context can lead to misinterpreting otherwise valid signals.
Using RSI in Isolation
Relying solely on the RSI without considering price action, support and resistance levels or other technical analysis tools can reduce its effectiveness.
For instance, a bullish divergence may appear on the RSI, but if price remains well above a key support level, the signal may lack confirmation. Obtaining additional confirmation can help filter out false signals.
Using the Same Settings in All Market Conditions
The standard 14-period RSI with 30/70 levels may work well in many situations, but markets can differ in volatility and behaviour.
Shorter periods, such as 7 or 9, produce more signals but may increase short-term noise. Longer periods, such as 21, smooth out fluctuations but react more slowly.
Similarly, some traders adjust overbought/oversold levels to 20/80 in strong trends in an attempt to reduce false signals.
How to Use the RSI Indicator on MT5
The Relative Strength Index (RSI) can be quickly added to charts in MetaTrader 5 (MT5). Once applied, traders can adjust its settings to suit different styles, markets and timeframes.
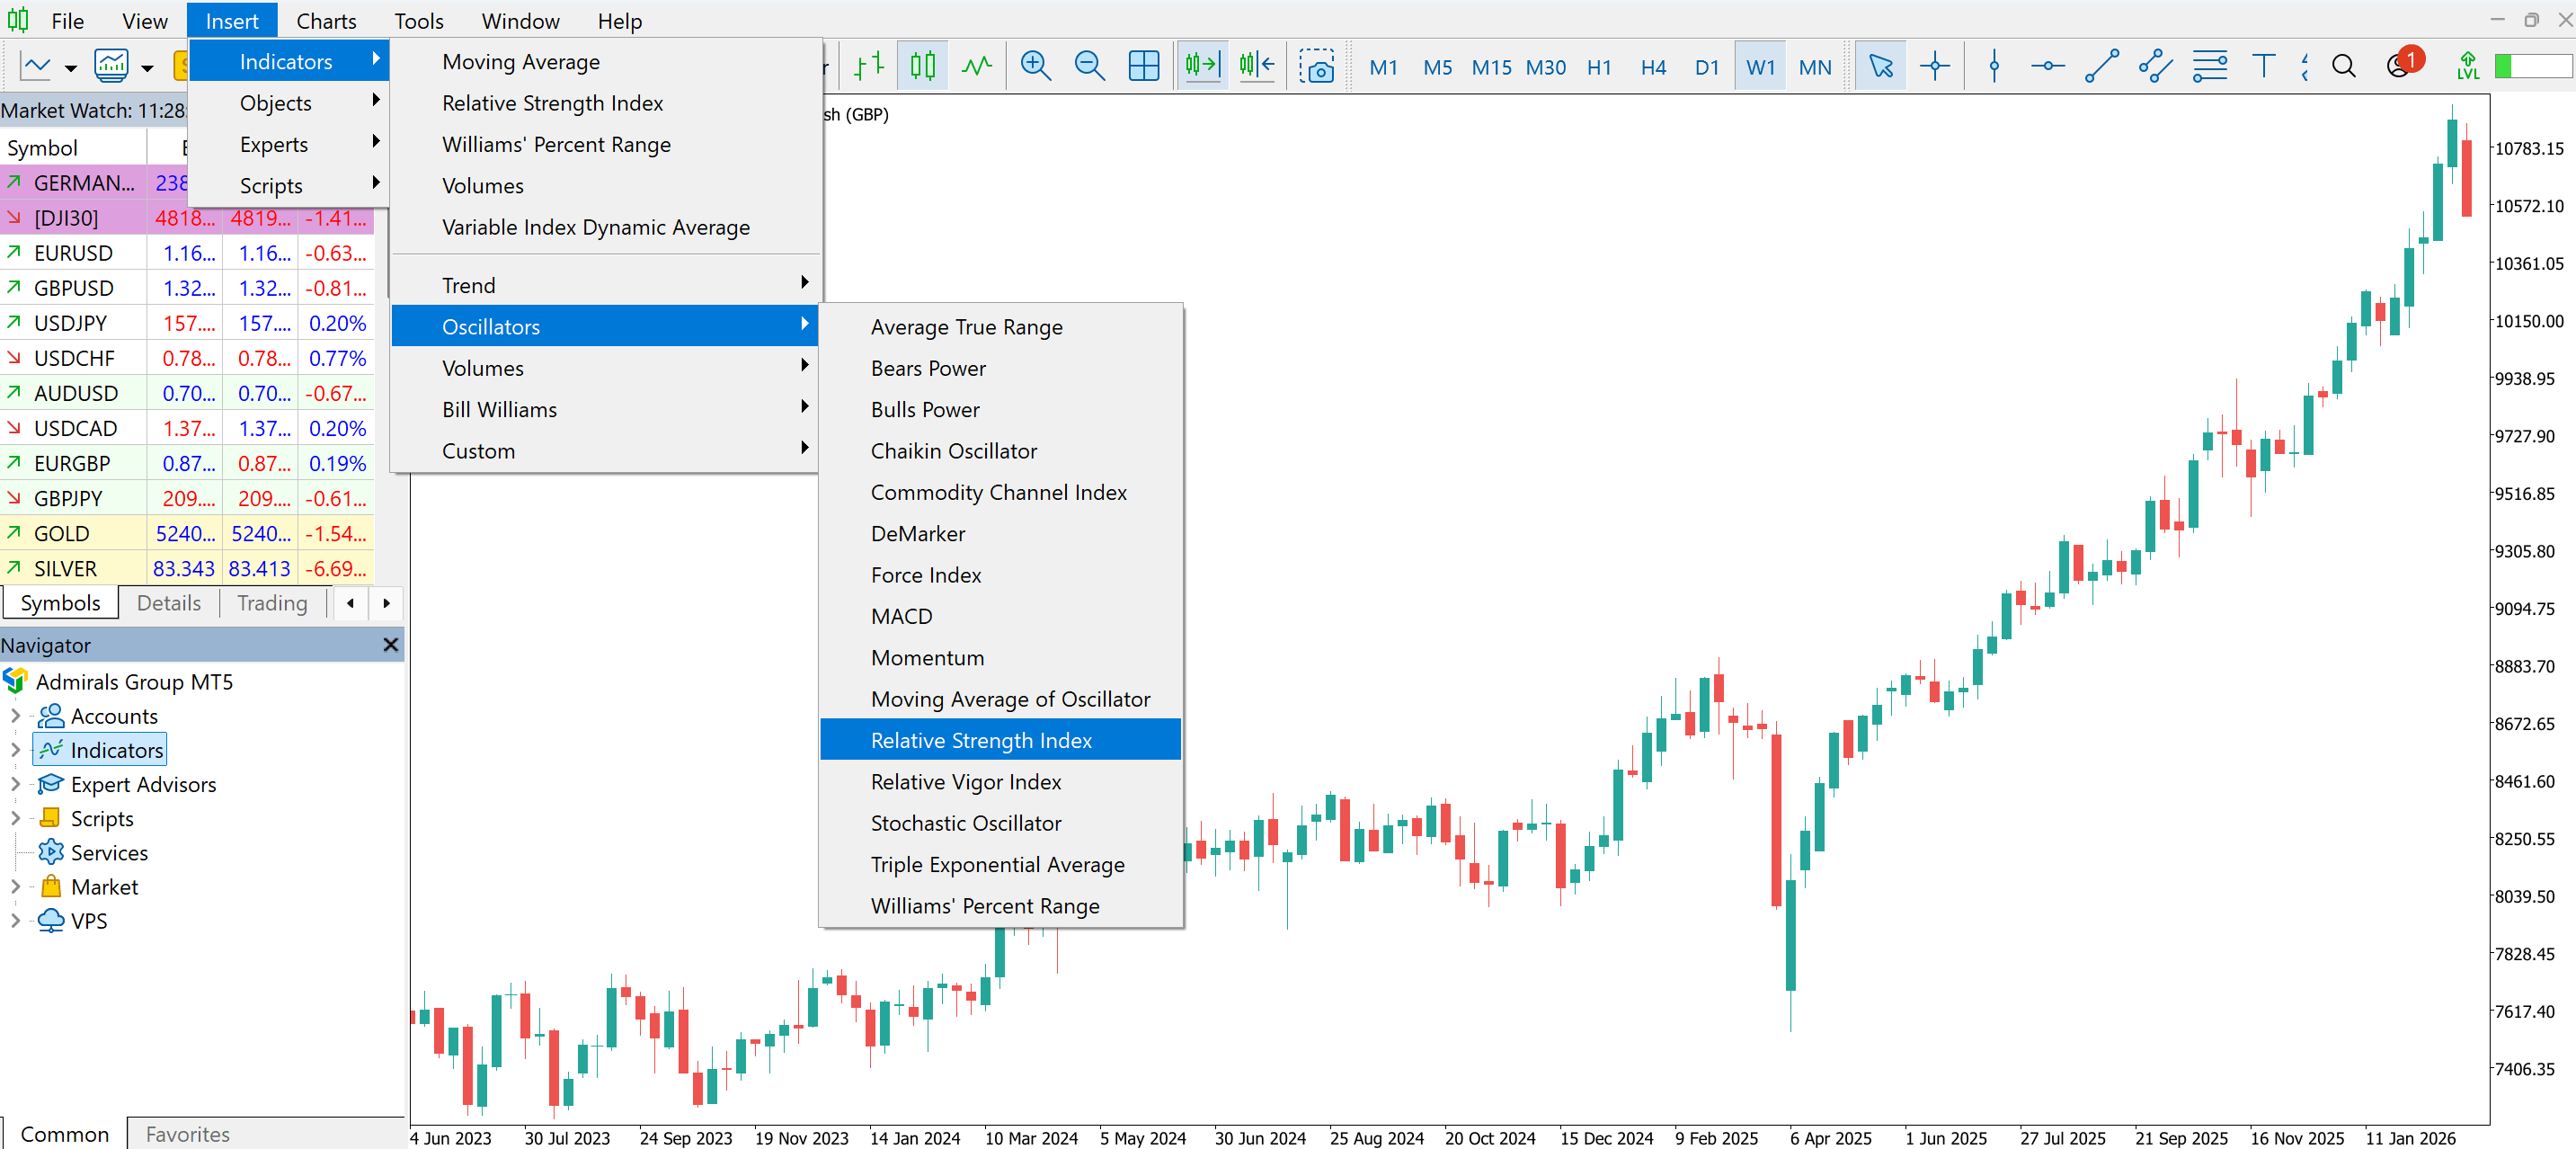
How to Add RSI in MT5
- Open your chart in MT5.
- Click Insert in the top menu.
- Select Indicators → Oscillators → Relative Strength Index.
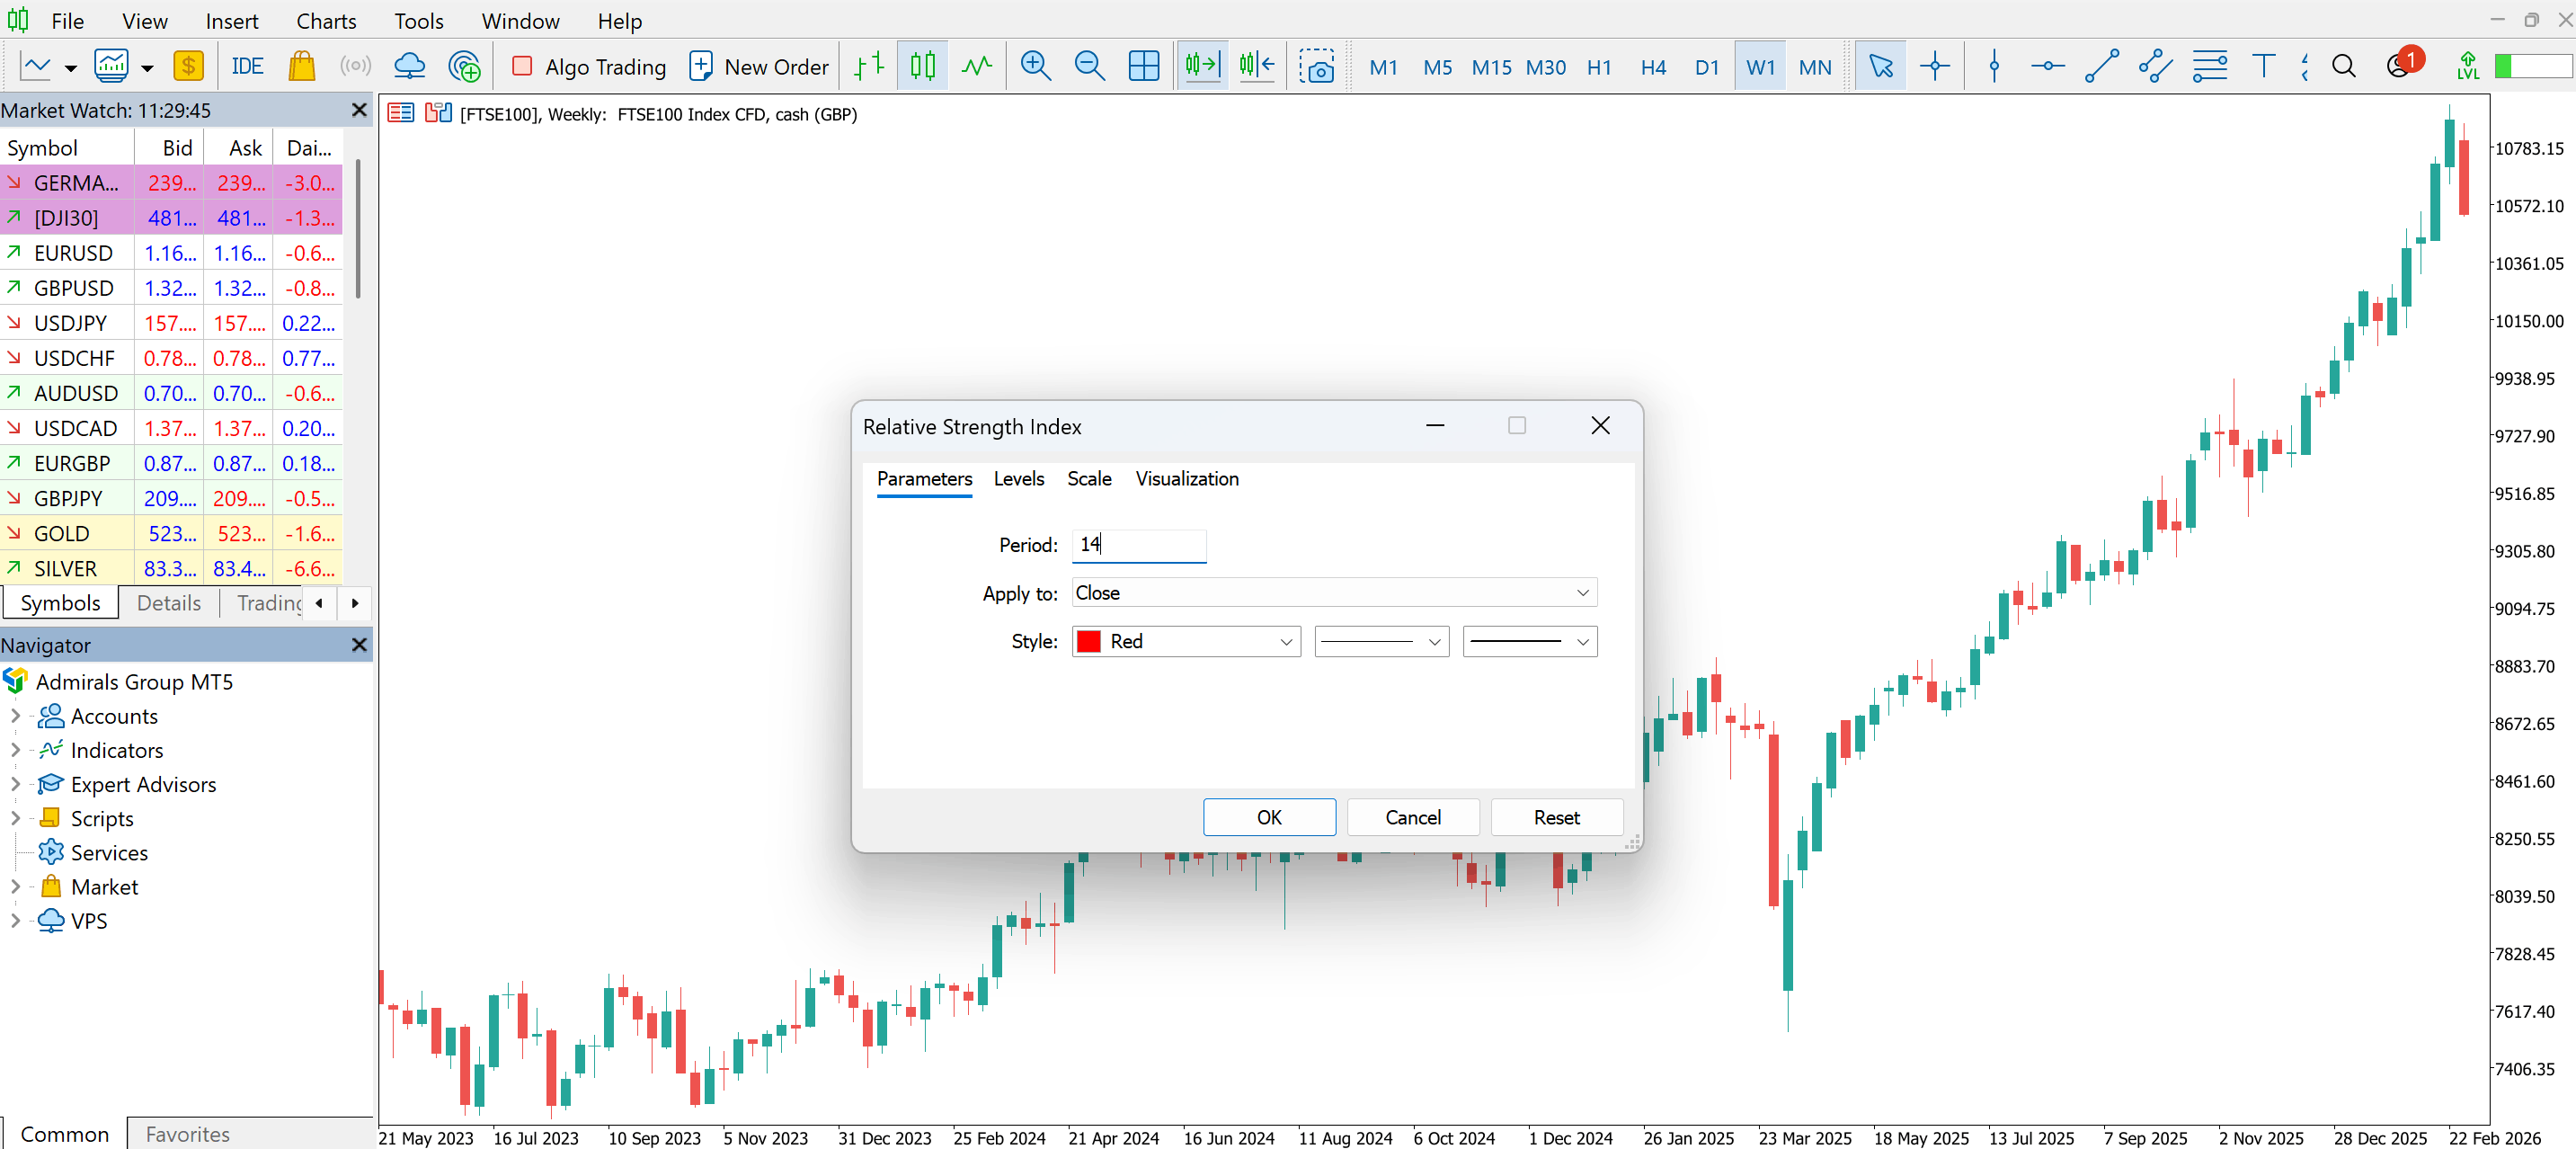
- A settings window will appear where you can configure the indicator.
- Click OK, and the RSI will appear in a separate window below the price chart.
By default, MT5 applies a 14-period RSI with standard 30 and 70 levels highlighted.
Adjusting RSI Settings
Within the settings window, traders can modify:
- Period: The number of lookback periods used in the calculation.
- Applied Price: Typically set to “Close”, though other options such as Open or Median Price are available.
- Levels: Traders can highlight other levels in addition to, or instead of, 30/70.
Other Articles You Might Be Interested In:
FAQ: RSI Indicator
What is the RSI indicator used for?
The RSI indicator is used to measure momentum. Traders can use it to identify overbought and oversold conditions, detect divergence and assess the strength of a trend.
What is a good RSI setting?
The standard setting is a 14-period RSI with 30 and 70 levels for oversold/overbought conditions. Shorter periods create more frequent signals, whereas longer periods smooth out the indicator and make it less responsive. The appropriate setting depends primarily on trading style and market conditions.
Is RSI a leading or lagging indicator?
RSI is a lagging indicator because it is calculated using historical price data. However, signals such as divergence may precede potential reversals in price.
What does RSI above 70 mean?
An RSI reading above 70 typically indicates strong upward momentum and may suggest overbought conditions. However, during strong uptrends, RSI can remain above 70 for extended periods.
What does RSI below 30 mean?
An RSI reading below 30 typically indicates strong downward momentum and may suggest oversold conditions. However, in downward trending markets, price can continue moving lower whilst the RSI remains below 30.
INFORMATION ABOUT ANALYTICAL MATERIALS:
The given data provides additional information regarding all analysis, estimates, prognosis, forecasts, market reviews, weekly outlooks or other similar assessments or information (hereinafter “Analysis”) published on the websites of Admirals investment firms operating under the Admirals trademark (hereinafter “Admirals”) Before making any investment decisions please pay close attention to the following:
- This is a marketing communication. The content is published for informative purposes only and is in no way to be construed as investment advice or recommendation. It has not been prepared in accordance with legal requirements designed to promote the independence of investment research, and that it is not subject to any prohibition on dealing ahead of the dissemination of investment research.
- Any investment decision is made by each client alone whereas Admirals shall not be responsible for any loss or damage arising from any such decision, whether or not based on the content.
- With view to protecting the interests of our clients and the objectivity of the Analysis, Admirals has established relevant internal procedures for prevention and management of conflicts of interest.
- The Analysis is prepared by an analyst (hereinafter “Author”) with the assistance of AI tools. The Author Roberto Rivero is a contractor for Admirals. This content is a marketing communication and does not constitute independent financial research.
- Whilst every reasonable effort is taken to ensure that all sources of the content are reliable and that all information is presented, as much as possible, in an understandable, timely, precise and complete manner, Admirals does not guarantee the accuracy or completeness of any information contained within the Analysis.
- Any kind of past or modelled performance of financial instruments indicated within the content should not be construed as an express or implied promise, guarantee or implication by Admirals for any future performance. The value of the financial instrument may both increase and decrease and the preservation of the asset value is not guaranteed.
- Leveraged products (including contracts for difference) are speculative in nature and may result in losses or profit. Before you start trading, please ensure that you fully understand the risks involved.