How to Trade with the Keltner Channel MT4 Indicator
In this article, we will provide traders with an explanation of what the Keltner Channel indicator is, Keltner Channel MT4 download instructions, how to trade using a Keltner Channel strategy and much more!
Table of Contents
Keltner Channel Indicator Explained
Before we delve deeper into the subject, let’s look at the basic premise behind Keltner Channels.
The Keltner Channel indicator, named by Chester W. Keltner, is a volatility based envelope that measures price movements in relation to lower and upper moving average bands. Although Keltner Channels are less known than another volatility indicator, Bollinger Bands®, they were actually conceived much earlier.
Keltner Channels are plotted using a combination of Exponential Moving Averages (EMA) and the Average True Range (ATR) indicator. The calculation behind the indicator when using the standard Keltner Channel settings is as follows:
- Middle Line: 20-day Exponential Moving Average
- Upper Channel Line: 20-day EMA + (2 x ATR(10))
- Lower Channel Line: 20-day EMA - (2 x ATR(10)
Trading with Keltner Channels
We can very broadly divide traders into two camps: trend followers and counter-trenders. Basically, both parties want to know if the market is stuck in a range or if it is trending. Usually, the price will either break out and form a new trend, or it will fail to break out and bounce back from where it came.
Traders can use the Keltner Channel indicator to easily identify levels offering good trading opportunities. The Keltner Channel MT4 indicator consists of three channel lines: the upper, the lower and the central. The upper and lower lines help us identify potential breakouts, whereas the centreline serves as a median point.
If you would like to learn more about trading indicators, you can register for our advanced trading webinars by clicking on the banner below:

Keltner Channel MT4 Download Instructions
Both the MetaTrader 4 (MT4) and MetaTrader 5 (MT5) trading platforms come as standard with a comprehensive range of built-in indicators, but this is just the tip of the iceberg.
There is a huge number of custom indicators that you can be downloaded, which are developed by users within the vast MT4 community. Unfortunately, the Keltner Channel indicator does not come as part of the standard package of MT4 indicators.
However, you can easily download the Keltner Channel MT4 indicator as part of the MetaTrader Supreme Edition (MTSE) from Admirals. MTSE is a plug-in offered exclusively by Admirals which works with both MT4 and MT5.
The MTSE plug-in allows traders to enhance their trading experience with a variety of additional technical indicators and trading tools. Click the banner below and follow the instructions in order to download MTSE for free and start Keltner Channel trading today!

The Best Keltner Channel Settings
Once you have downloaded MTSE, the Keltner Channel indicator can be found in the Custom Indicator section of MT4 and MT5, under the name Admiral Keltner.
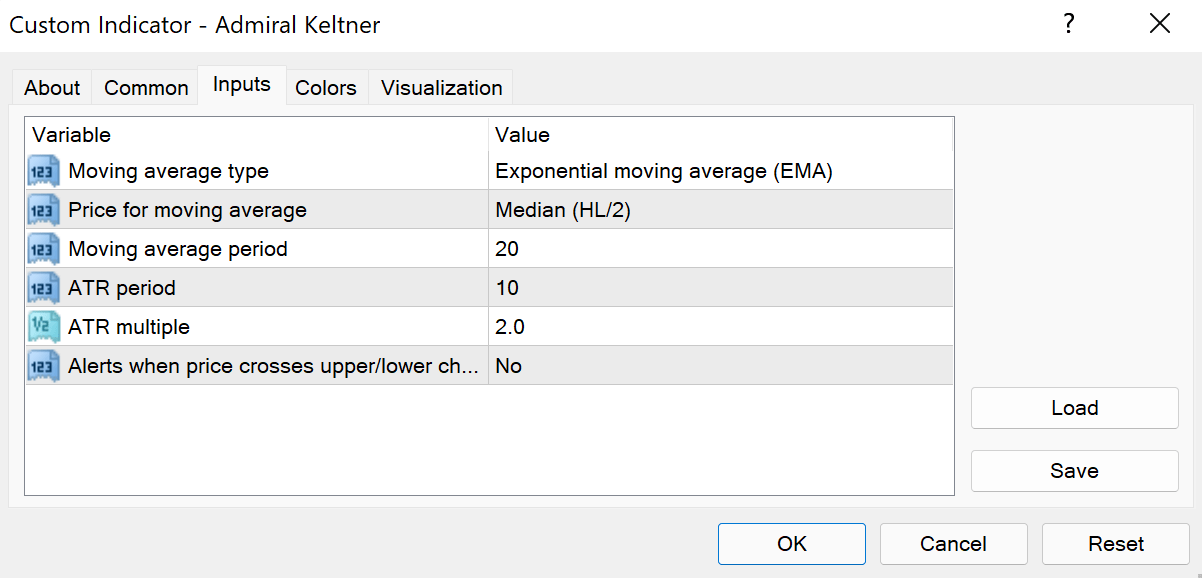
The screenshot above shows the default Keltner Channel settings when added to a price chart. The moving average type is an EMA, the period of which can be set to anything you need.
For day trading, usually a 15 to 40-period EMA is typical. The multiplier can be adjusted based on the market you are trading. While 2.0 is a common setting, you may find that a 1.6 or a 2.4 provides you with better information for the exact market you trade. Bear in mind that the higher the multiplier, the wider the channel, and vice versa.
The best Keltner Channel settings will vary depending on the trader in question and the strategy being used. Therefore, it is a good idea to start with the default Keltner Channel settings and experiment on a demo trading account until you find out what works best for you.
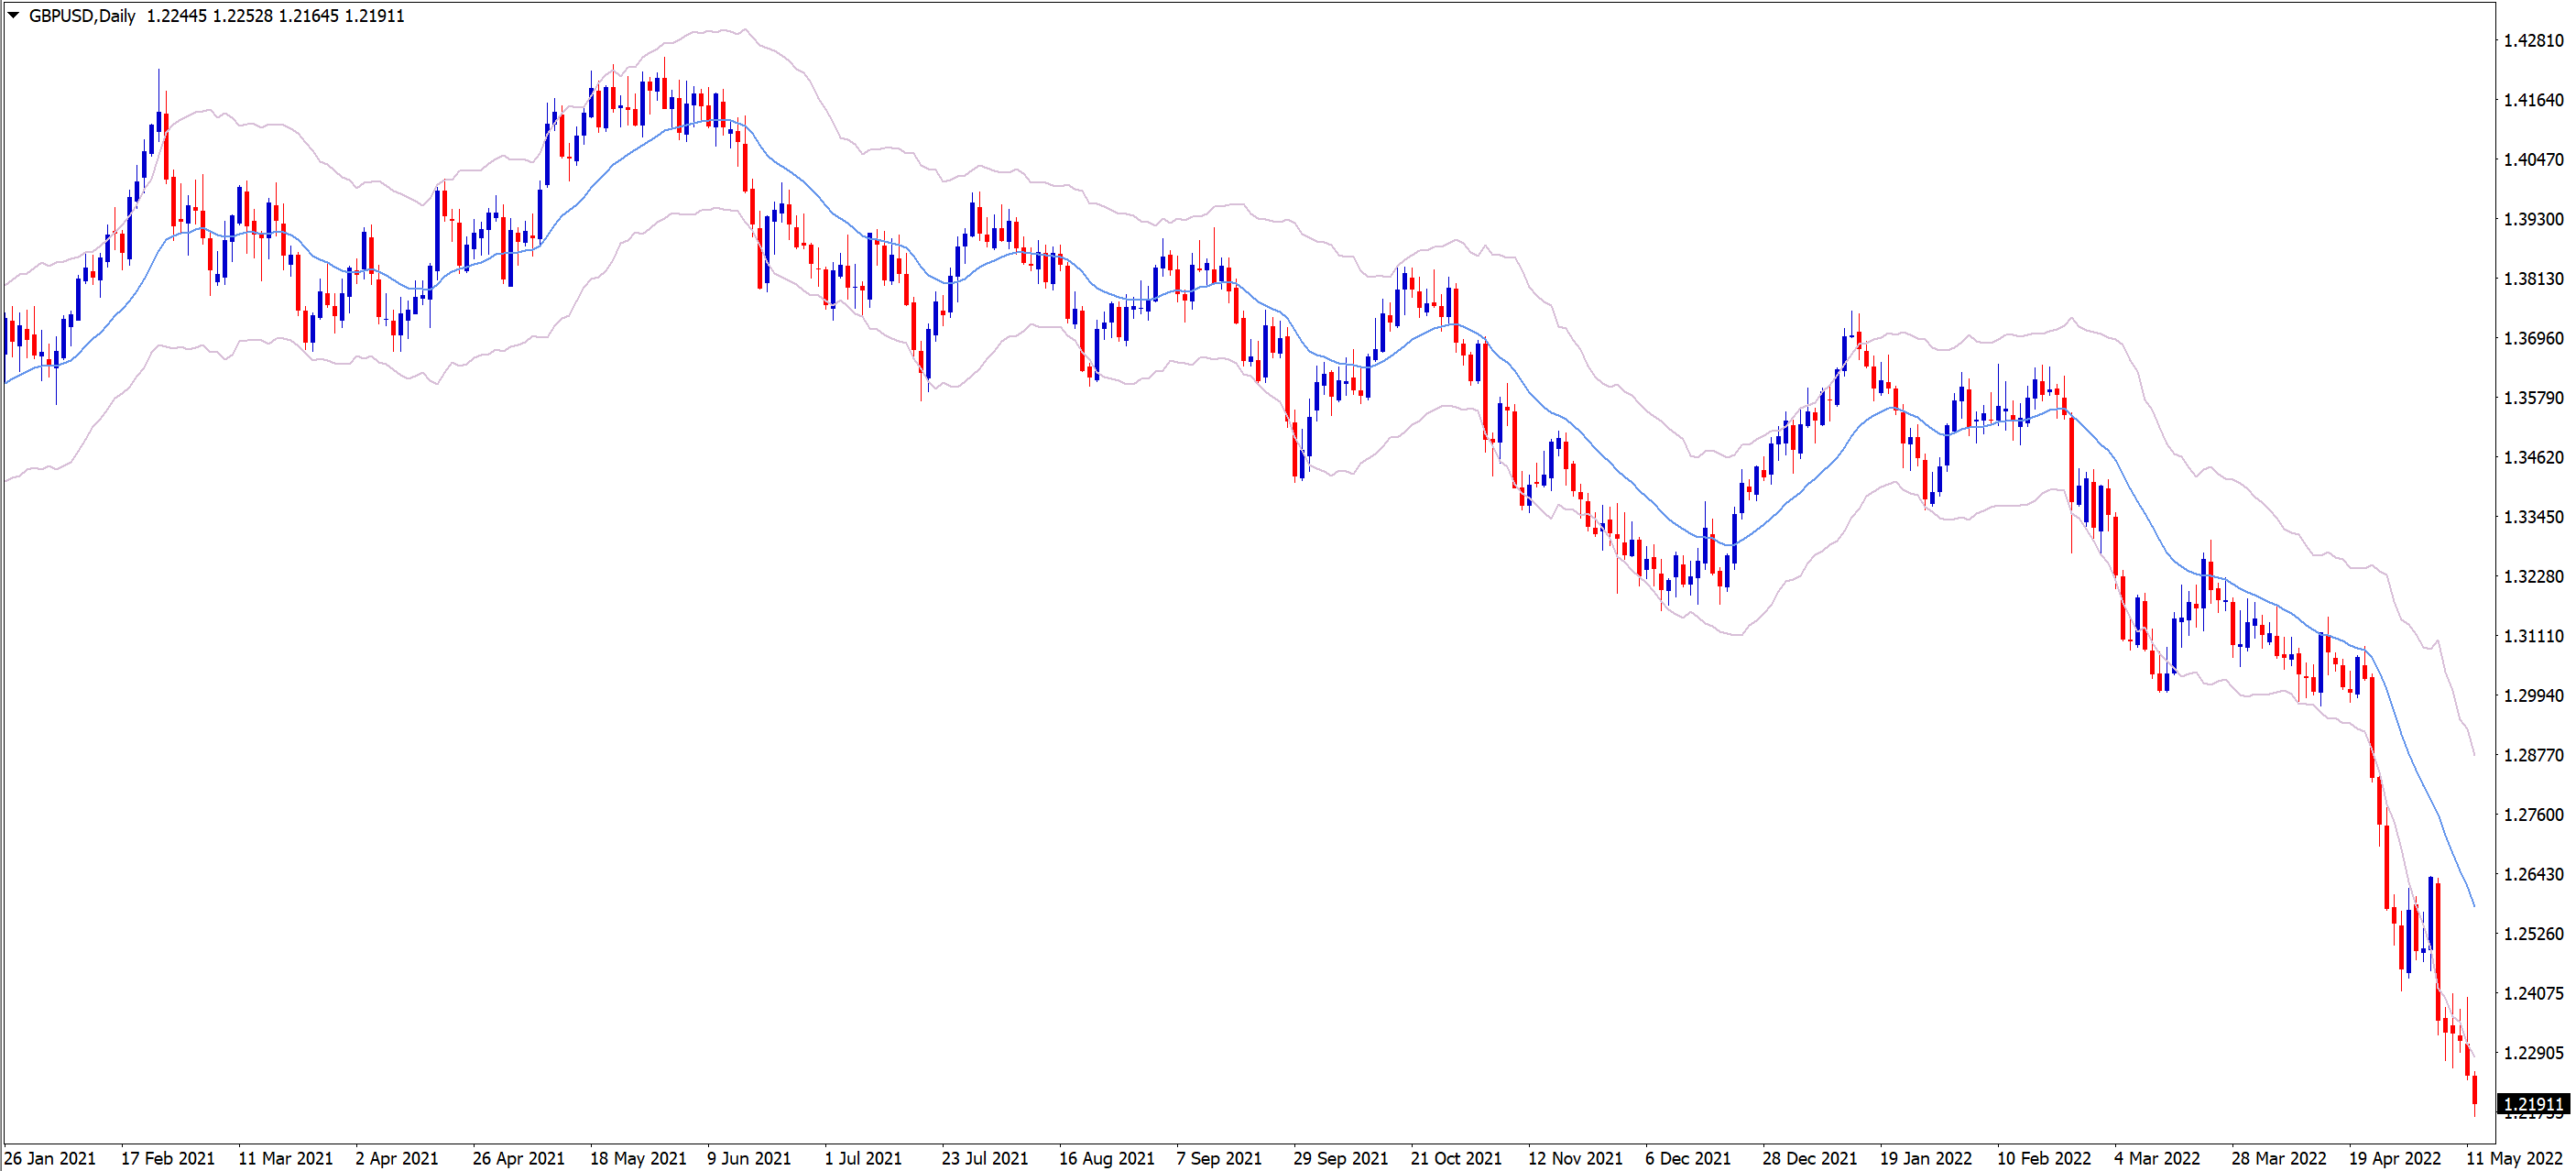
A Basic Keltner Channel Trading System
Breakout strategies generally use volatility channels as such - buy breakouts are above the upper volatility channel, while sell breakouts are below the lower volatility channel. The middle band is used as a stop-loss.
Profit targets can be defined using the Admiral Pivot, which should be set to an H1 or D1 time frame. In addition, breakouts are usually traded on an M15 timeframe.
Due to potential false breakouts, many traders use additional indicators as filters, such as the Stochastic Oscillator, the MACD, the CCI, or the RSI.
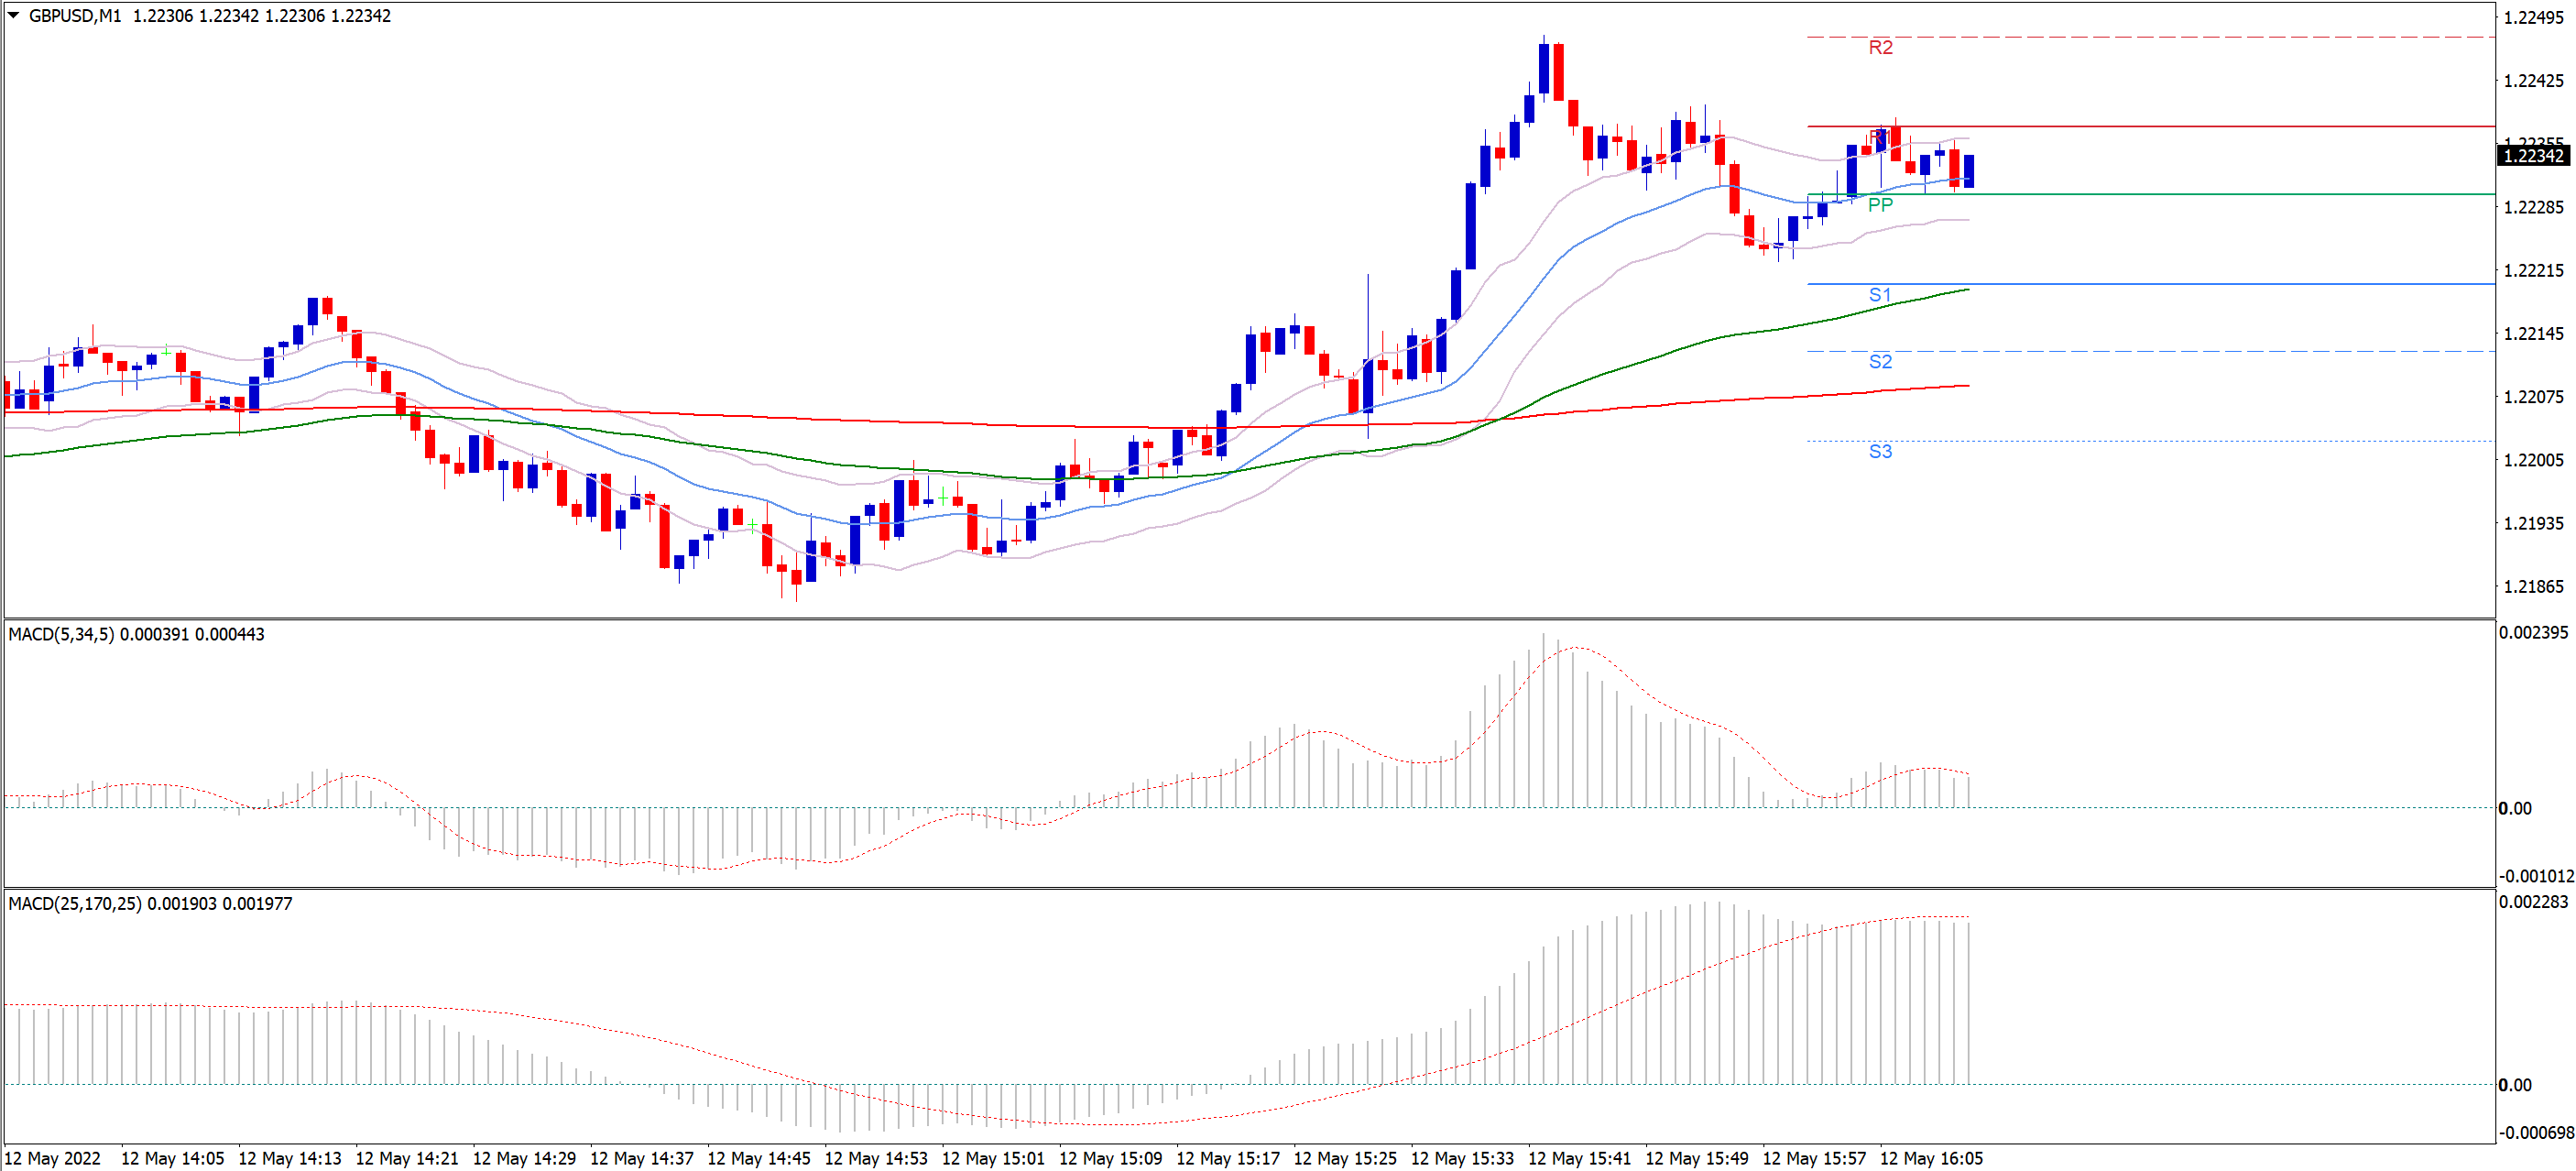
Keltner Channel Scalping Strategy
Now, let’s have a look at an advanced Keltner Channel scalping strategy traded on a 1-minute timeframe. This Keltner Channel strategy is only suitable for scalpers, who enjoy trading volatility on extremely short-time frames. Here are all the details you need:
Timeframe: M1
Indicators:
- Admiral Keltner (22,10,1.0)
- Admiral Pivot (M15)
- EMA 445 set on close (Red)
- EMA 89 set on close (Green)
- MACD (5,34,5) and MACD (25,170,25)
Pairs to Trade:
- EUR/USD
- GBP/USD
- USD/CHF
- AUD/USD
- EUR/JPY
- GBP/JPY
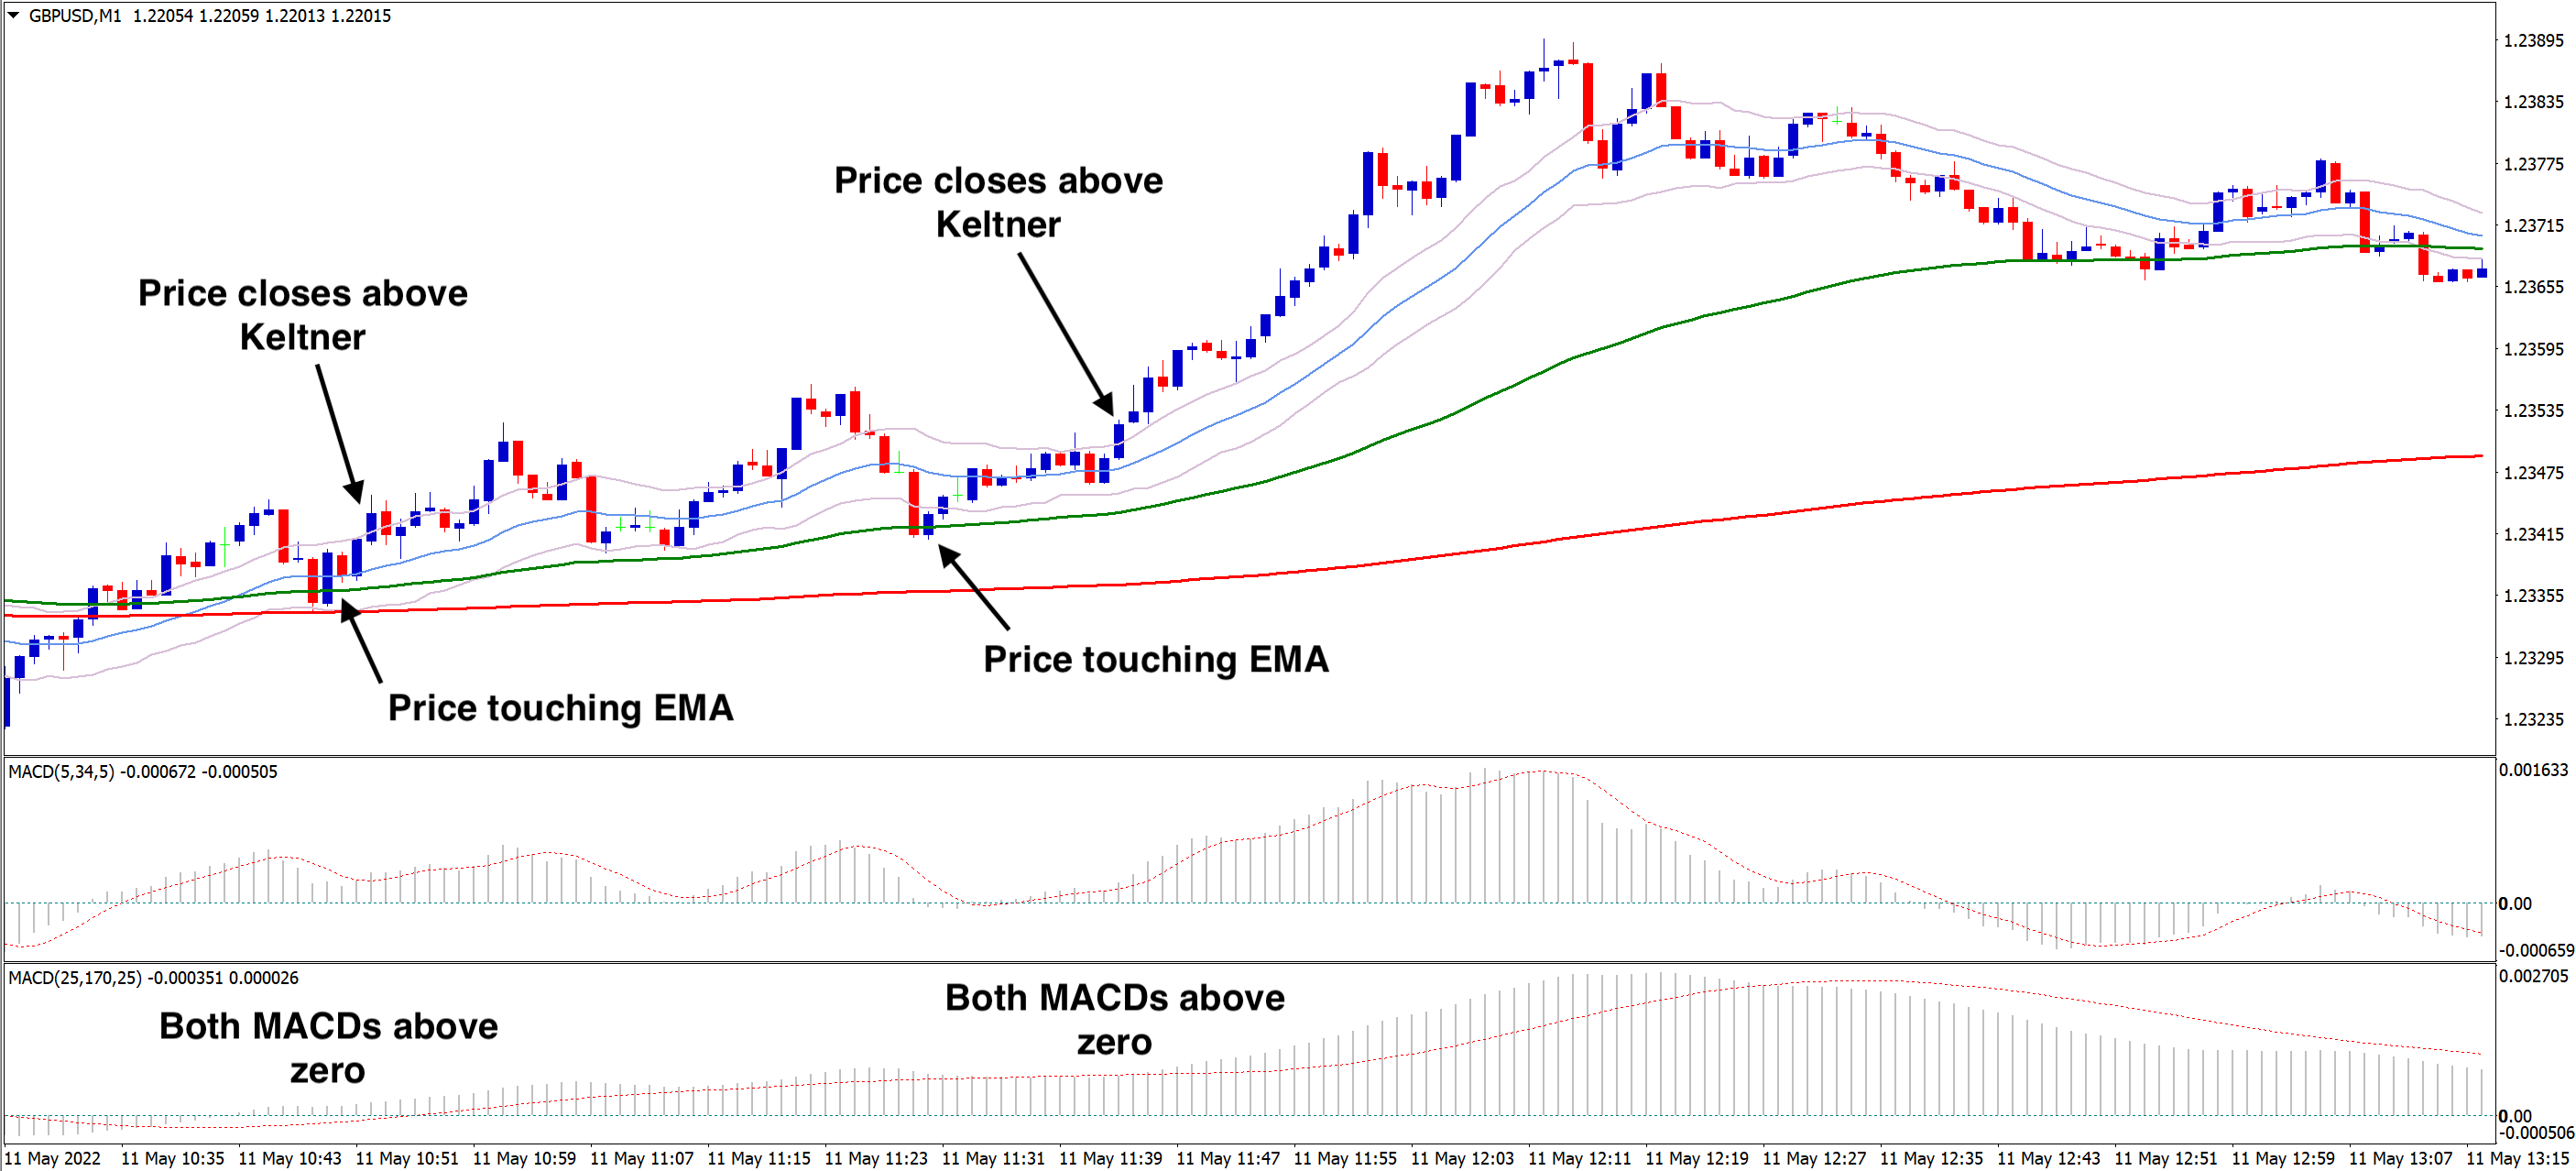
Buy Trade:
- Green EMA above the Red EMA
- Both MACDs above the 0 line (histograms are pointed up)
- The candle needs to touch or come very close to either the Green or the Red EMA, and then bounce
- The price needs to close above the Keltner Channel
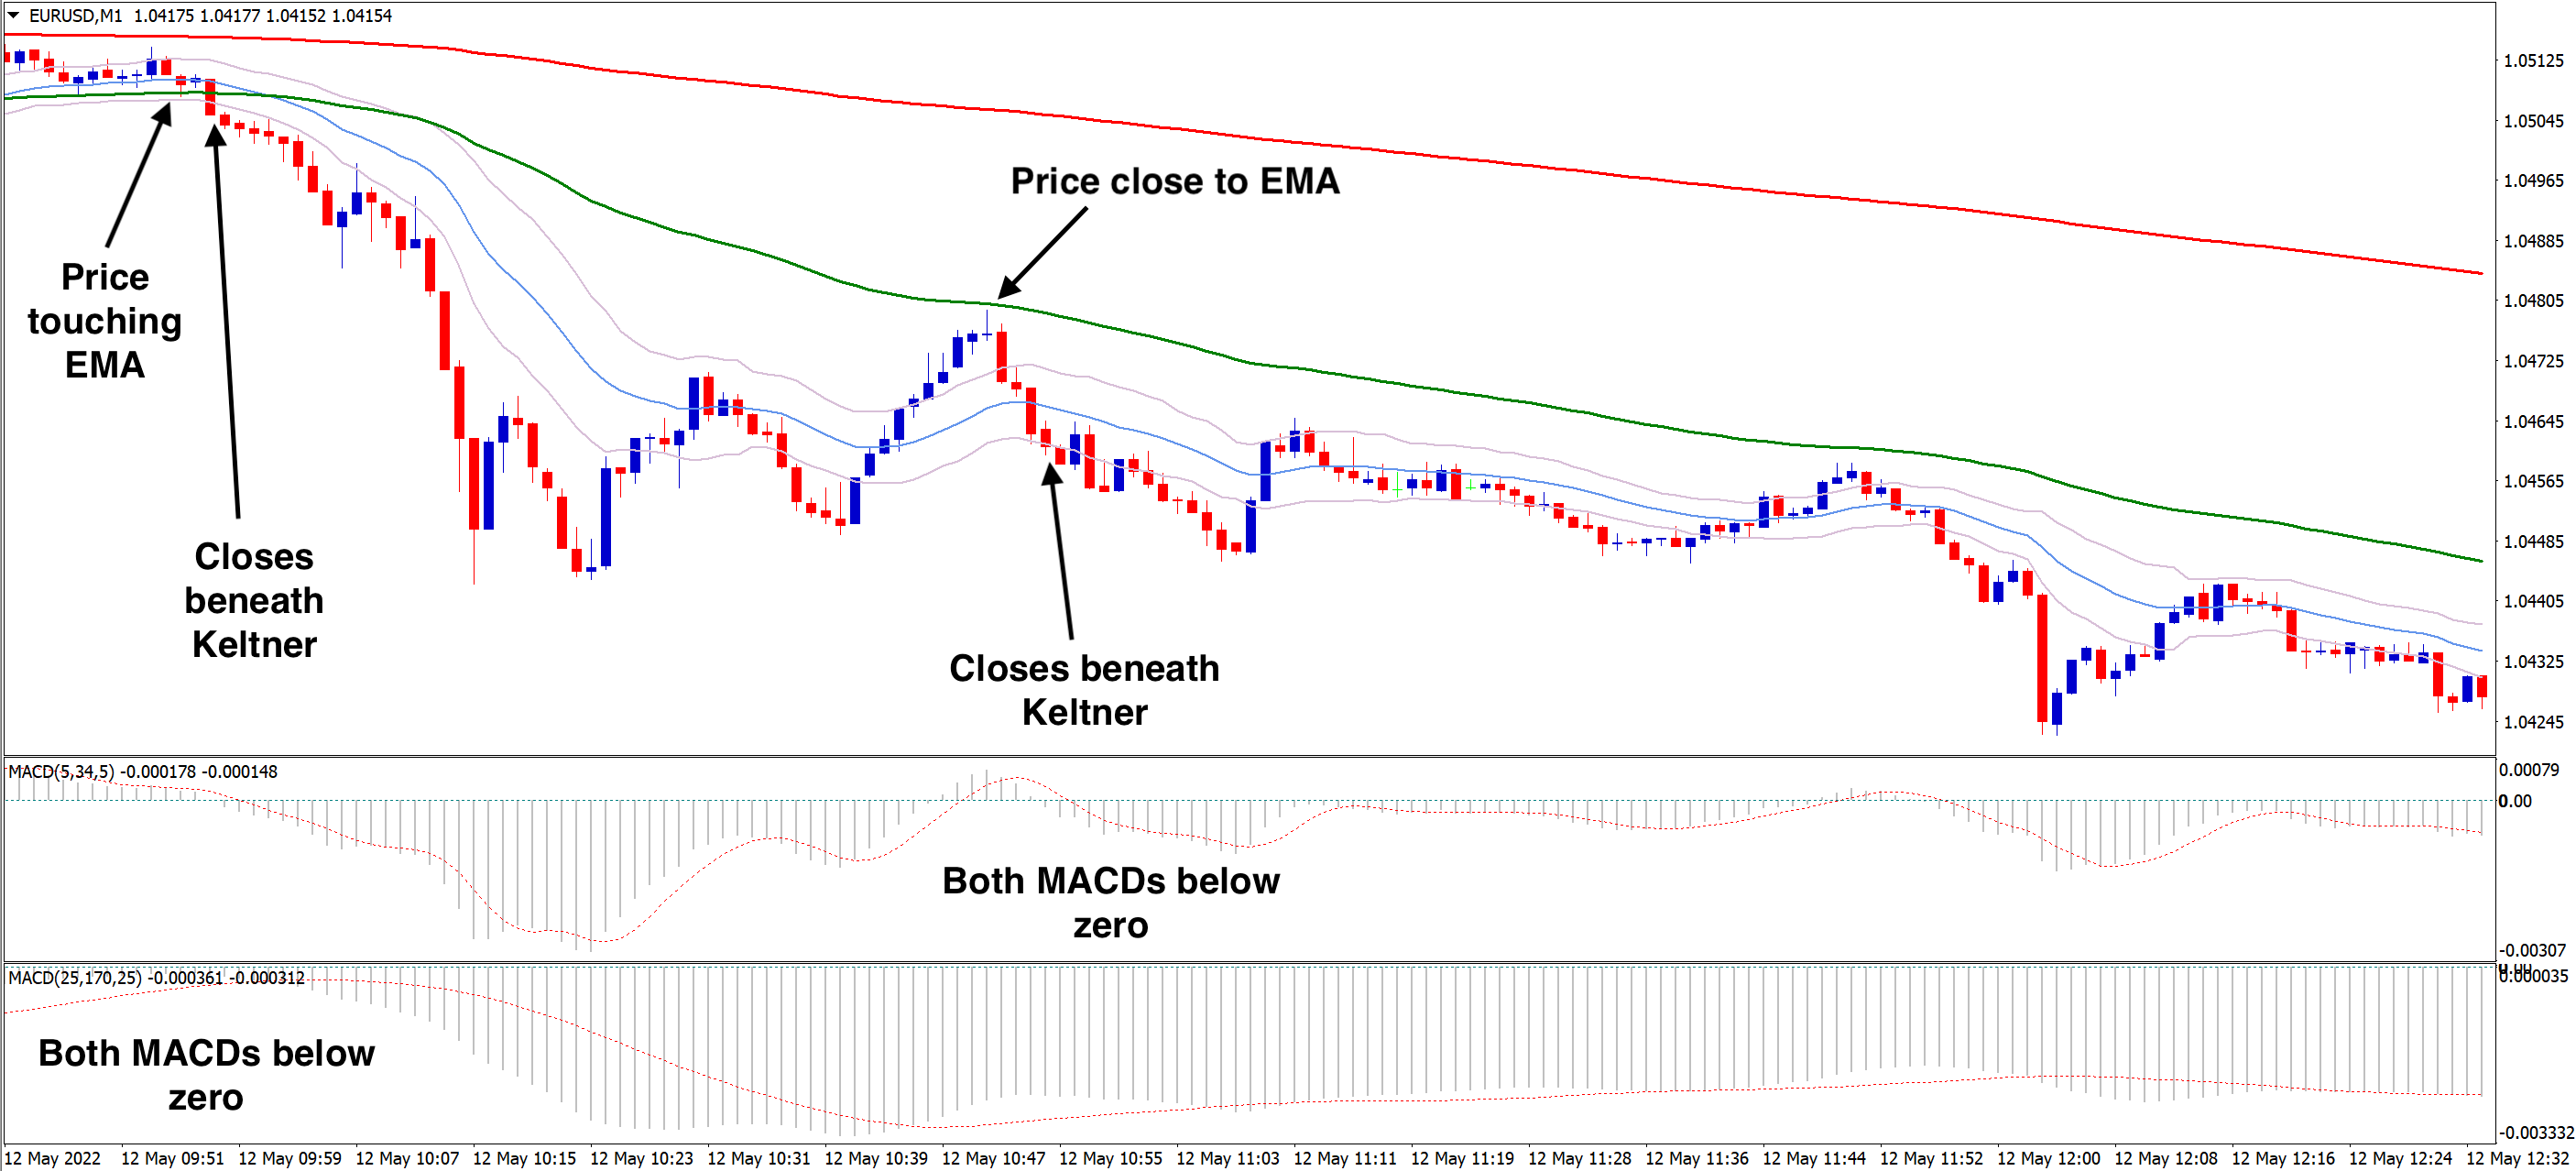
- Green EMA below the Red EMA
- Both MACDs below the 0 line (histograms are pointed down)
- The candle needs to touch or come very close to either the Green or the Red EMA, and then bounce
- The price needs to close below the Keltner Channel
Stop-Loss and Targets:
The stop-loss is placed 15 pips + the spread away from the entry price. The target is between 5-15 pips, and the Admiral Pivot should be set to M15.
Tips for Keltner Channel Trading
- Use a backup or confirming indicator in order to avoid false signals
- Use one leading indicator and one lagging indicator
- They should agree with each other no matter what
- Don't use Keltner Channels with another volatility breakout indicator, except for Bollinger Bands ®
- Start by experimenting with the combination and Keltner Channel settings that work best for you on a Demo Trading Account before risking capital on the live markets
If you would like to learn more about other Forex indicators that you can use in your trading, make sure to check out our article ‘Five Forex Indicators Every Trader Should Know’
Trade on a Risk-Free Demo Account
Traders that choose Admirals will be pleased to know that they can trade completely risk-free with a demo trading account. Instead of heading straight to the live markets and putting your capital at risk, practise your Keltner Channel strategy until you are ready to transition to the live markets! Click the banner below to open your free demo account today:

Frequently Asked Questions
What is the Keltner Channel MT4 indicator?
The Keltner Channel MT4 indicator is a volatility-based technical analysis tool. It consists of three bands – two upper and lower bands calculated using the average true range, and a middle band based on an exponential moving average. Traders use it to identify potential trend reversals, breakouts, and gauge market volatility effectively.
Which traders could use the Keltner Channel Indicator?
The Keltner Channel Indicator is suitable for traders seeking to assess market volatility and identify potential entry or exit points. Day traders, swing traders, and those interested in trend analysis find it particularly useful. By analyzing price movements relative to the indicator's bands, traders can make informed decisions on market trends and reversals.
About Admirals
Admirals is a multi-award winning, globally regulated Forex and CFD broker, offering trading on over 8,000 financial instruments via the world's most popular trading platforms: MetaTrader 4 and MetaTrader 5. Start trading today!
This material does not contain and should not be construed as containing investment advice, investment recommendations, an offer of or solicitation for any transactions in financial instruments. Please note that such trading analysis is not a reliable indicator for any current or future performance, as circumstances may change over time. Before making any investment decisions, you should seek advice from independent financial advisors to ensure you understand the risks.