How to Trade Forex Chart Patterns: List, Setups & Examples
In this guide, we explore trading forex using chart patterns, with a focus on context, confirmation, and risk management. We will also look at how to read forex chart patterns in a way that supports your trading journey.
Let’s begin.
The information in this article is provided for educational purposes only and does not constitute financial advice. Consult a financial advisor before making investment decisions.
Table of Contents
- What are Chart Patterns in Forex?
- How to Trade Forex Chart Patterns (Step-by-Step):
- List of Forex Chart Patterns
- 6 Top Forex Chart Patterns Explained with Examples
- How to Read Forex Chart Patterns
- When Should You Use Forex Chart Patterns?
- Bottom Line on Forex Chart Patterns
- Frequently Asked Questions on Forex Chart Patterns
What are Chart Patterns in Forex?
Chart patterns in forex are recurring formations on price charts that may reflect the ongoing battle between buyers and sellers. They do not guarantee what will happen next, but they may help traders interpret the balance between buyers and sellers at a given price level and, when read correctly, suggest who is more likely to control the next move.
However, chart patterns in forex trading do not carry meaning on their own; their value comes from how they align with the broader market structure, including trend, crucial levels, and overall market conditions.
Types of Chart Patterns in Forex
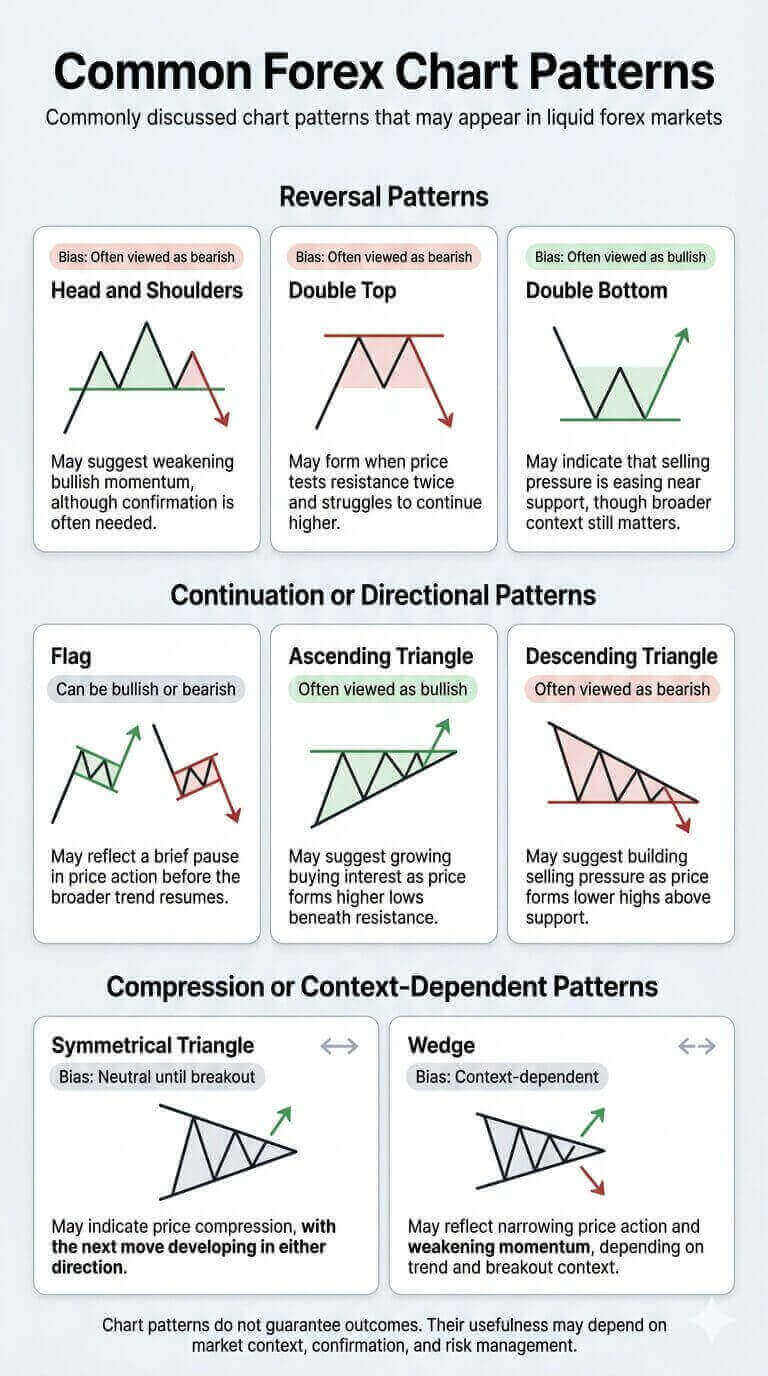
The types of chart patterns in forex trading are often divided into three broad categories: reversal, continuation, and bilateral. This classification helps traders compare different forex chart patterns based on how they behave within a trend.
- Forex reversal chart patterns signal exhaustion at the end of a trend. They form when the dominant side (bulls or bears) loses conviction, and the opposing side builds enough pressure to flip direction. Common reversal chart patterns forex traders watch include the double top forex pattern, the double bottom forex pattern, and the head and shoulders forex pattern.
- Forex continuation patterns form during trending momentum when the market temporarily consolidates before resuming in the same direction. Flags, pennants, and certain triangle structures fall into this category. These are among the popular forex chart patterns used by traders looking for continuation setups.
- Bilateral chart patterns, like symmetrical triangles, are directionally neutral. They compress price into a tightening range and can break either way. Their edge comes not from the pattern itself, but from the market context surrounding it.
How to Trade Forex Chart Patterns (Step-by-Step):
- Identify the pattern within a clear trend or range
- Confirm the pattern structure (key levels, symmetry, context)
- Wait for a breakout or confirmation signal
- Set entry after confirmation (not anticipation)
- Place stop loss beyond invalidation level
- Define profit target based on pattern projection
- Manage risk and position size accordingly
List of Forex Chart Patterns
Before looking at each setup in detail, let’s take a look at the forex chart patterns list which we have covered in this guide. This is not a complete catalogue of all forex chart patterns, but it does cover the most common patterns traders are likely to encounter in liquid forex markets.
Common Forex Chart Patterns:
- Head and Shoulders
- Inverse Head and Shoulders
- Double Top
- Double Bottom
- Flag
- Pennant
- Symmetrical Triangle
- Ascending Triangle
- Descending Triangle
- Wedge Pattern
The infographic below summarises these patterns to help you recognise them more easily on a chart.
6 Top Forex Chart Patterns Explained with Examples
Let’s look at the six popular forex chart patterns from the above list.
1. Head and Shoulders Forex Pattern
Among the more widely recognised forex bearish chart patterns, the head and shoulders forex pattern is often watched for signs to see if the bullish momentum is fading after an established uptrend.
It forms with three peaks: a left shoulder, a higher central peak called the head, and a right shoulder that usually develops near the height of the first shoulder. The neckline, drawn across the two pullback lows, is the key reference level.
.png)
The pattern’s value isn’t the shape itself, but the shift in behavior behind it. Buyers push prices higher, but struggle to maintain that strength. When the right shoulder shows weaker momentum and price breaks below the neckline, it may suggest sellers are taking control.
Stop losses are usually placed above the right shoulder or the nearby swing high. Profit targets are often based on the distance from the head to the neckline, projected downward from the breakout high. Profit targets are often based on the distance from the head to the neckline, projected downward from the breakout.
The inverse head and shoulders is the bullish counterpart and follows the same logic in reverse.
2. Double Bottom Forex Pattern
The double bottom forex pattern is a bullish reversal pattern that tends to form after an extended decline, particularly when the price is testing a crucial support zone.
After a downtrend, price forms a first low, rebounds into interim resistance, and then revisits the prior low. The second test matters more than the first. If sellers cannot extend the move and buyers begin to absorb supply around the original base, the structure may be signalling exhaustion. The pattern may become actionable once price reclaims and closes above the neckline. Entering too early often means jumping the gun before the market has proved that support is holding.
.png)
The above chart is one of the clearer forex chart pattern examples of a failed downside continuation pattern turning into a reversal. Stop losses are often placed below the second bottom or just below the crucial support zone. Take profits are often measured by taking the distance from the lows to the neckline and projecting it upwards from the breakout.
3. Double Top Forex Pattern
The double top forex pattern tends to work in the opposite way to the double bottom. Price pushes into resistance, pulls back, and then tests that region again. The repeated failure to move higher may suggest buying pressure is fading, but that alone does not always confirm a reversal until price breaks and closes below the neckline between the two peaks.
.png)
Compared with the head and shoulders forex pattern, a double top shows two comparable rejections rather than a three-peak distribution structure. The pattern becomes more useful when the second high forms on weaker momentum and shows signs of fatigue. This is a common setup that traders encounter when trading forex chart patterns.
Stop losses are often placed above the second peak or just beyond the resistance zone. Take-profits targets are often measured by taking the distance from the tops to the neckline and projecting that distance lower from the break.
4. Flag Forex Pattern
The flag forex pattern is a clear forex continuation pattern. It forms when a sharp, directional move (the pole) is followed by a brief, controlled pullback that forms a parallel channel counter to the trend. The breakout from that channel often reflects the momentum of the original move.
.png)
From a psychological perspective, the flag pattern may reflect profit-booking from traders already in the move while new participants wait for clearer confirmation. However, one thing to notice in flag patterns is volume. In many cases, volume tends to ease during the pullback and then pick up again on the breakout. That can suggest the pause is more of a temporary consolidation before the continuation of the trend.
In bullish flags, stop losses are often placed below the lower boundary of the flag or below the latest swing low inside the pullback. In bearish flags, they are often placed above the upper boundary. Profit targets are commonly estimated from the height of the pole, projected from the breakout point.
5. Triangle Patterns Forex Traders Watch
Triangle pattern forex setups form when price compresses between converging trendlines, building pressure for a directional break. Understanding forex triangle patterns requires distinguishing not just their shapes, but their structural implications.
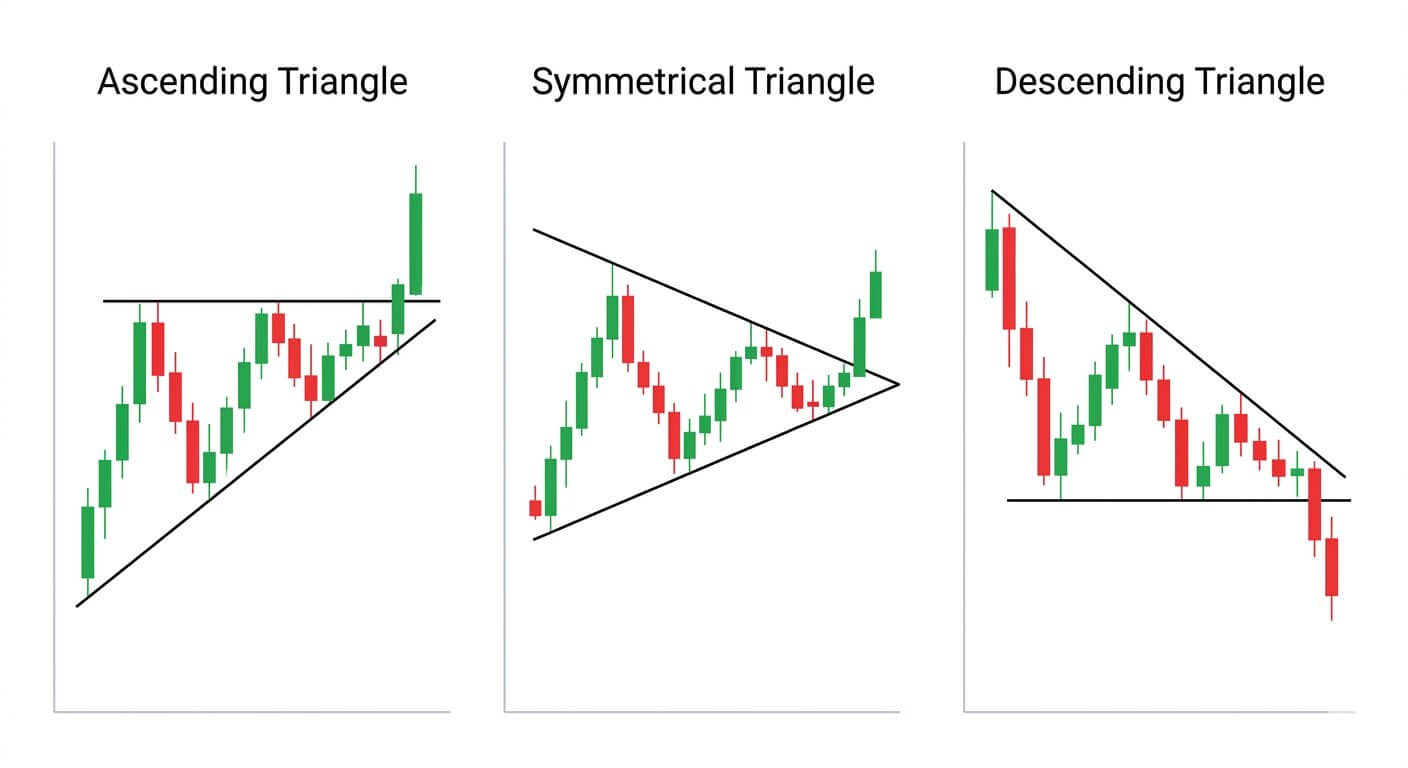
Symmetrical Triangle
The Symmetrical Triangle Pattern is the most neutral of the three. Price compresses between a descending resistance line and an ascending support line. It is usually seen as a neutral consolidation pattern, with neither bulls nor bears fully in control of the trend. Because of that, the breakout can develop in either direction.
Bilateral patterns like this require patience. Oftentimes, entering before the break is how traders get caught in false moves. That’s why many traders prefer to wait for a clear close outside the pattern before treating it as confirmation.
Ascending Triangle
The ascending triangle combines a flat resistance line with rising swing lows. It often suggests that buyers are becoming more aggressive by stepping in at progressively higher prices while resistance remains fixed. If interpreted correctly, this structure could be among the commonly used forex trend chart patterns.
Stop losses are often placed below the most recent higher low or beneath the rising trendline. Profit targets are often based on the height of the triangle projected above the breakout.
Descending Triangle
The descending triangle is the bearish counterpart, combining flat support with a sequence of lower highs. In effect, sellers continue to accept lower prices while buyers defend the same support level.
Stop losses are often placed above the most recent lower high or just above the descending trendline. Profit targets are often estimated from the height of the triangle projected down from the breakdown level.
6. Wedge Forex Pattern
A wedge forex pattern develops when price moves within two converging lines that both slope in the same direction.
In a rising wedge, the price may continue making higher highs and higher lows, but the move often loses momentum as the range narrows and vice versa. This can suggest that, although buyers are still pushing price upwards, each rally is becoming less convincing.
.png)
Compared with many other advanced forex chart patterns, wedges often require careful reading of slope, location on the chart, and breakout quality rather than shape alone.
How to Read Forex Chart Patterns
Reading forex chart patterns involves more than simply recognising shapes on a chart. Traders often consider the broader market context before acting on a pattern.
- Identify trend direction before the pattern forms
- Focus on key support and resistance levels
- Observe volume and momentum behaviour
- Wait for confirmation, such as a breakout and close beyond a level
- Avoid trading patterns in isolation without broader context
When Should You Use Forex Chart Patterns?
Forex chart patterns tend to be more effective when they are used in the right market conditions.
- During clear trending markets – Continuation patterns may work more reliably when there is an established directional bias.
- Near key support and resistance levels – Reversal patterns are often watched more closely in these areas.
- During active trading sessions – The London–New York session overlap often sees increased market participation, which may lead to stronger price moves, though volatility can also rise.
- Avoid during major news events or low volatility conditions – Sudden volatility or lack of participation may reduce pattern reliability.
Bottom Line on Forex Chart Patterns
Ultimately, chart patterns are far more than geometric shapes; they serve as a framework for organising raw price behaviour into recurring structures that reveal the underlying psychology of the market. A workable forex chart patterns strategy isn't built on finding as many patterns as possible, but rather on a disciplined process of selection, context, confirmation and risk management.
To deepen your understanding, explore related topics such as day trading patterns, candlestick formations, and fundamental analysis below:
- 4 Day Trading Patterns Every Day Trader Should Know
- 16 Candlestick Patterns To Know
- Forex Fundamental Analysis
Frequently Asked Questions on Forex Chart Patterns
What are the most common forex chart patterns?
The most common forex chart patterns are head and shoulders, double top, double bottom, flags, and triangle patterns. These patterns are often used to identify potential reversals or trend continuation setups.
Which forex chart pattern is good for beginners?
Forex chart patterns that are often considered suitable for beginners include the double top, double bottom, flag, and triangle patterns, as their structure is straightforward to identify.
What chart do most traders use?
Most traders use candlestick charts because they show the open, high, low, and close clearly within each period. Some traders also use line charts for a cleaner view of broader structure, but candlestick charts remain the standard for technical analysis.
About Admirals
Admirals is a multi-award-winning, regulated Forex and CFD broker, offering trading on over 8,000 financial instruments via the world's most popular trading platforms: MetaTrader 4 and MetaTrader 5.
INFORMATION ABOUT ANALYTICAL MATERIALS:
The given data provides additional information regarding all analysis, estimates, prognosis, forecasts, market reviews, weekly outlooks or other similar assessments or information (hereinafter “Analysis”) published on the websites of Admirals investment firms operating under the Admirals trademark (hereinafter “Admirals”) Before making any investment decisions please pay close attention to the following:
- This is a marketing communication. The content is published for informative purposes only and is in no way to be construed as investment advice or recommendation. It has not been prepared in accordance with legal requirements designed to promote the independence of investment research, and that it is not subject to any prohibition on dealing ahead of the dissemination of investment research.
- Any investment decision is made by each client alone whereas Admirals shall not be responsible for any loss or damage arising from any such decision, whether or not based on the content.
- With view to protecting the interests of our clients and the objectivity of the Analysis, Admirals has established relevant internal procedures for prevention and management of conflicts of interest.
- The Analysis is prepared by an analyst (hereinafter “Author”) with the assistance of AI tools. The Author Amrita Kundu is a contractor for Admirals. This content is a marketing communication and does not constitute independent financial research.
- Whilst every reasonable effort is taken to ensure that all sources of the content are reliable and that all information is presented, as much as possible, in an understandable, timely, precise and complete manner, Admirals does not guarantee the accuracy or completeness of any information contained within the Analysis.
- Any kind of past or modelled performance of financial instruments indicated within the content should not be construed as an express or implied promise, guarantee or implication by Admirals for any future performance. The value of the financial instrument may both increase and decrease and the preservation of the asset value is not guaranteed.
- Leveraged products (including contracts for difference) are speculative in nature and may result in losses or profit. Before you start trading, please ensure that you fully understand the risks involved.