An Introduction to Forex Technical Analysis
For new traders, the vast range of methods used to trade the financial markets may appear quite daunting. However, the reality is that the majority of these methods can be categorised as either fundamental analysis or technical analysis. While some traders use both, most traders these days focus mainly on technical analysis for some very important reasons, which you will discover in this article.
You will also learn how to perform technical analysis yourself, the best software for doing so and much more! The focus of this article will be on Forex technical analysis, however, we will also look at other financial markets, helping you on your way to becoming a master of technical analysis!
Table of Contents
- Technical Analysis: An Introduction
- Technical Analysis: Origins
- Fundamental Analysis vs Technical Analysis
- The Basics of Technical Analysis
- Best Technical Analysis Software: Which One?
- Technical Analysis Charts
- Forex Technical Analysis: Chart Patterns
- Forex Technical Analysis: Candlestick Patterns
- Technical Analysis Indicators
- Technical Analysis for Different Financial Markets
Technical Analysis: An Introduction
Technical analysis is the study of patterns in price of a particular asset, with the intention of identifying trends and making predictions about future price movements. There are many ways to identify patterns in the financial markets, but most technical analysts focus on the following:
-
Technical Analysis Chart Patterns
- In this study, technical analysts use drawing tools, such as horizontal lines, trend lines and Fibonacci levels, to identify well known chart patterns, such as symmetrical triangle formations and consolidation patterns. These patterns, once identified, give clarity to the strength and weakness of both buyers and sellers in the respective market.
-
Technical Analysis Candle Patterns
- In this study, traders use price charts, such as candle charts, which display the open, close, high and low price levels of a particular timeframe. They use these charts to attempt to identify clues on the behaviour of buyers and sellers in a short period of time.
-
Technical Analysis Indicators
- This is where traders use technical indicators to help in understanding the market condition. For example, many indicator provide signals on when the market is overbought or oversold. Other indicators can provide traders with clues on either rising or falling momentum.
There are indeed many ways to perform technical analysis of a security. In all cases, the technical analyst draws upon historical price data to identify recognisable and repeatable patterns. These patterns are then analysed to help traders identify the correct condition of the market, as well as possible points to enter and exit the market.

Technical Analysis: Origins
Technical analysis of the financial markets have existed for as long as there have been markets driven by supply and demand. The first known historical records are dated around the 17th century for Dutch merchants and the 18th century for Japanese rice traders. At the end of the 19th century, technical analysis began to take off, as it was propelled into the trading masses by the founder and editor of The Wall Street Journal, Charles Dow.
Among his contemporary compatriots were other technical pioneers, such as Ralph Nelson Elliot, the founder of the famous Elliot Wave Theory; William Delbert Gann, the founder of the Gann Angle Theory; and Richard Demille Wyckoff, who was possibly the first market psychologist who theorised that the market, with all the historical data recorded, is best considered as a single mind and his teachings are still taught at some of the top universities in the US.
For most of the 20th century, and throughout history, technical analysis was limited to charting, as statistical computation of vast amounts of historic data was not possible. That meant that no technical analysis indicators were available. It also means that now, the digital era, can possibly be considered as the golden age of technical analysis and the right time to learn more about it.
Fundamental Analysis vs Technical Analysis
Fundamental analysis is the study of economic data (such as retail sales figures, inflation reports, employment data, etc) or company news and earnings announcements to identify the trend of the market and possible turning points or changes in the direction of a particular market. While fundamental analysis is still useful in some markets, like the stock market, technical analysis is now much more common.
One of the reasons technical analysis can work, is because more and more people are using it to aid in their trading decisions, making it even more effective than ever before. However, most traders will use a combination of technical analysis and fundamental analysis, as if both fields of study point to the same market move it is generally considered a high probability trading opportunity.
Advantages of Technical Analysis:
- Forex technical analysis only requires a few basic tools which are free with the Admirals MetaTrader platform.
- Forex technical analysis can sometimes give high probability directional views and points of entry and exit from the market.
- There are a wide variety of technical analysis tools and indicators that can help with identifying possible trading setups.
Disadvantages of Technical Analysis:
- Because of its widespread use, Forex technical analysis can trigger very abrupt market movements in the event that many traders come to the same conclusions.
- In some markets, technical analysis should always be combined with fundamental analysis.
Advantages of Fundamental Analysis:
- Can help you to understand why a market is going up or down.
- When combined with technical analysis can lead to identification of long term trends.
Disadvantages of Fundamental Analysis:
- There are so many fundamental analysis tools to use there can be lots of conflicts with some indicators showing good data and some showing bad data. This can lead to confusion.
- Keeping track of all the different news announcements can be time consuming.
- Just because fundamental analysis says one thing doesn't mean the market will respond. For example, even if US economic data is weak it doesn't mean the US dollar will go down. If all the other currencies are weak - traders may choose to stick to the US dollar because, as the world's largest economy, its currency will most likely recover faster than others.
- It takes much longer to master the outcomes of different economic data such as inflation reports and company earnings announcements.
The Basics of Technical Analysis
In this section, we will look at some of the basic underlying principles of technical analysis which you should know.
Price Action Accounts for Everything
The logical framework of technical analysis derives itself from Dow theory, which claims that the current market price accurately reflects all the currently available relevant information. Therefore, any factor which has an impact on supply or demand will inevitably be reflected in the chart. Researching, or even being aware of, the events outside of price action, is, therefore, mostly rendered useless as they may provide unreliable data.
Price Moves in Trends
In another echo of Dow theory, proponents of technical analysis tend to favour the trend-like nature of the financial markets. Markets can move in uptrends, a bullish market that continuously creates higher highs and higher lows. The opposite market behaviour, characterised by lower lows and lower highs, constitute a downtrend, or a bearish market.
A horizontal trend is called a ranging market and is not a particularly desirable place for a trend-based trader to be. This is due to the fact that during ranging periods, there is hardly any way to be certain about what will happen next. A ranging market means that the bulls and the bears are more or less equal in power. Neither side is strong enough to dominate the other for long enough to create a trend. Markets tend to range the majority of the time, which makes identifying trends extremely important.
It is worth remembering that Forex technical analysis does not particularly concern itself with why things happen. For example, you may wonder 'why do trends occur?', however, to a technical trader, the answer is completely irrelevant. To them, the existence of trends is simply an empirically proven fact.
History Repeats Itself
Technical analysts agree that investors and traders, as a whole, operate in patterns. Because of this behaviour, technicians believe that they are able to accurately identify patterns and make trades with a higher probability. All they need is a small statistical advantage, multiplied by repetitions and leverage.
Whilst technical analysis of financial markets, such as Forex technical analysis, is popular in its own right, many traders use technical analysis in combination with fundamental analysis or sentiment analysis. Technicians may excel and identifying and confirming trends, but it is the fundamental shifts that provide conditions for those trends to develop.
Technical analysts use the method of Forex backtesting, also known as historical backtesting. This is a method utilised by traders that use historical data to test a trading strategy, which primarily relies on Forex technical analysis. As with all statistical findings in any area of human activity, past data does not guarantee that the pattern or the probability will last. It is only a tool. The most important thing is to get started and to learn by practice.
Best Technical Analysis Software: Which One?
As technical analysis is the study of price charts, the first step in getting started is finding the best technical analysis software. The MetaTrader suite of trading platforms is regarded by many as the best software the trading world has to offer.
With Admirals, both demo and live account holders, have free access to the following MetaTrader trading software:
- MetaTrader 4
- MetaTrader 5
- MetaTrader WebTrader
- MetaTrader Supreme Edition (A custom plugin for MetaTrader 4 and MetaTrader 5, created by Admirals with the help of professional trading experts)
Whilst users can access all this technical analysis software by opening a demo or live trading account, there are some differences between the different platforms.
For example, the MetaTrader 4 platform has been the go-to platform for Forex technical analysis traders for many years. The MetaTrader 5 platform offers traders the chance to use their technical analysis skills on a higher number of markets, such as stocks, indices and commodities. Both these platforms and WebTrader already have specific technical analysis tools in them, which we will cover in more detail later in the article.
In the following sections, we will look at the four different types of technical analysis tools you can use to your advantage. We will then learn how to apply technical analysis for different markets such as Forex, Stocks, Indices, Commodities and Cryptocurrencies. The four different types of technical analysis tools are:
- Charts
- Chart Patterns
- Candlestick Patterns
- Indicators
It is recommended you download your MetaTrader platform, so that you can follow through on the technical analysis examples below.
Technical Analysis Charts
The first consideration on your path to becoming a technical analyst, is to decide which chart type to perform your technical analysis on. Whether it is stock market or Forex technical analysis, the same chart type can be used across different markets.
Chart types include line, bar and candlestick. Once you've downloaded your MetaTrader technical analysis software, you can switch between these different chart types by right clicking on an open chart and selecting from the three different options.
Let's look at each chart type in more detail.
Line Charts
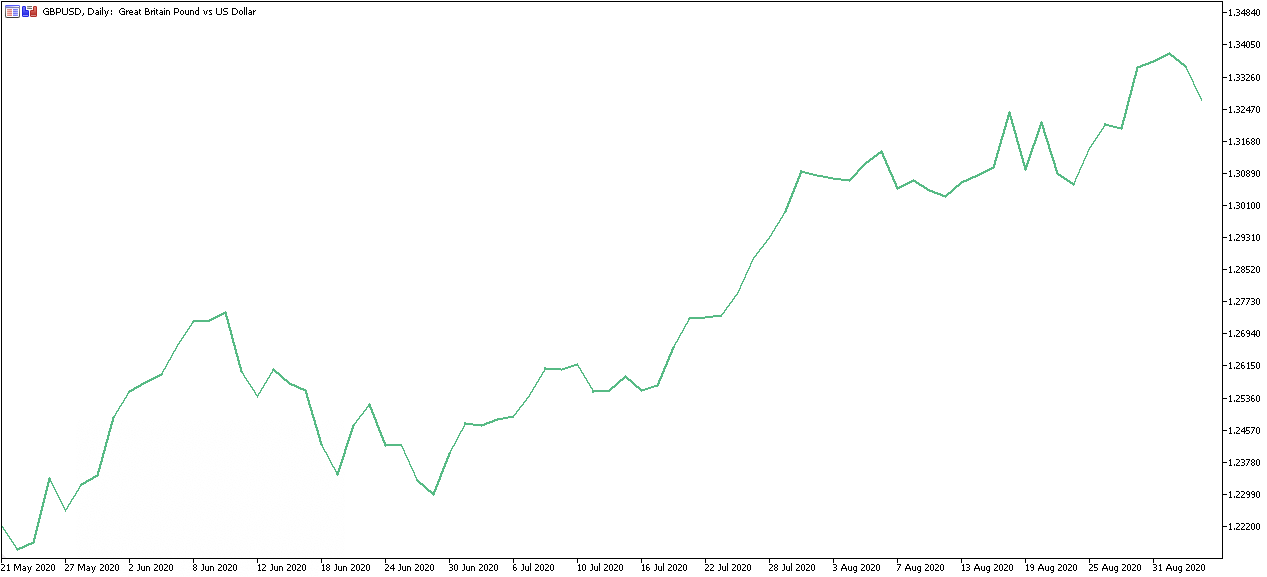
A line chart simply connects the closing prices of the timeframe you are viewing. For example, when viewing a daily chart the line will connect the closing price of each trading day. Whether you are employing stock market or Forex technical analysis, traders mainly use line charts to identify long-term trends as it is the most basic type of chart available.
OHLC (Bar Chart)
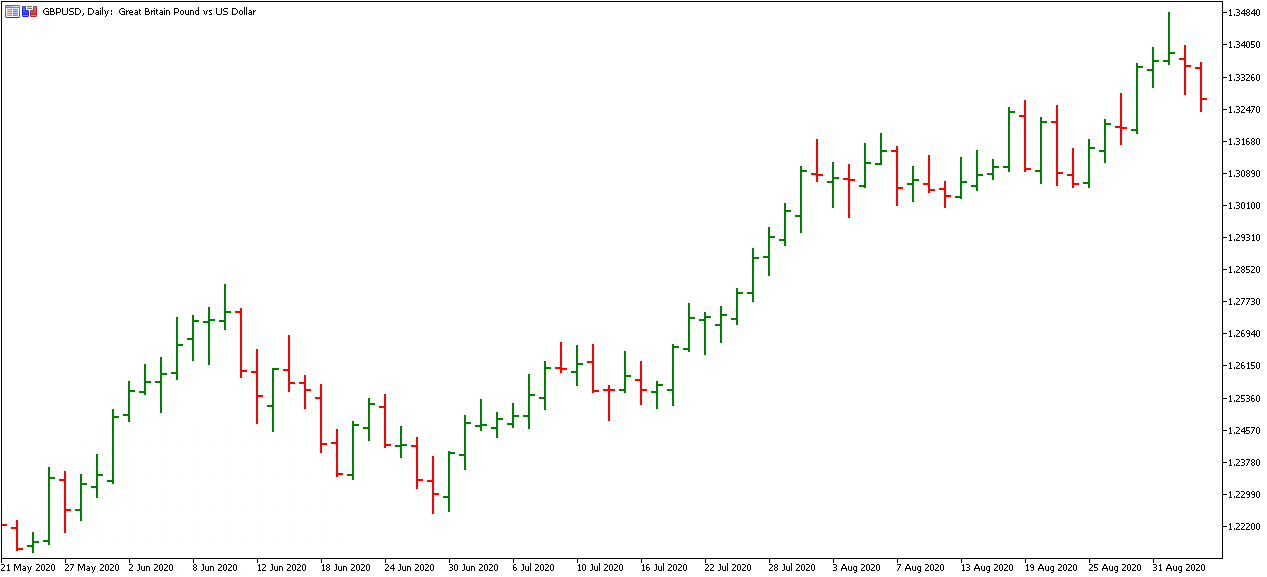
The OHLC (Open, High, Low, Close) bar chart shows a single vertical bar for each time period the trader is viewing. For example, when looking at the daily chart, each vertical bar represents one trading day. The bar chart presents much more information than the line chart. It shows us the open, high, low and close price values of the specific timeframe.
Here are some technical analysis chart basics for the OHLC bar chart:
- The dash on the left is the opening price.
- The dash on the right is the closing price.
- The high of the bar is the highest price the market traded during the time period selected.
- The low of the bar is the lowest price the market traded during the time period selected.
- The green bars indicate that the closing price is above the opening price, these are known as buyer bars.
- The red bars indicate that the closing price is below the opening price and are known as seller bars.
Charts such as the OHLC bar chart help technical analysts identify whether buyers or sellers are in control of the market.
Candlestick Charts
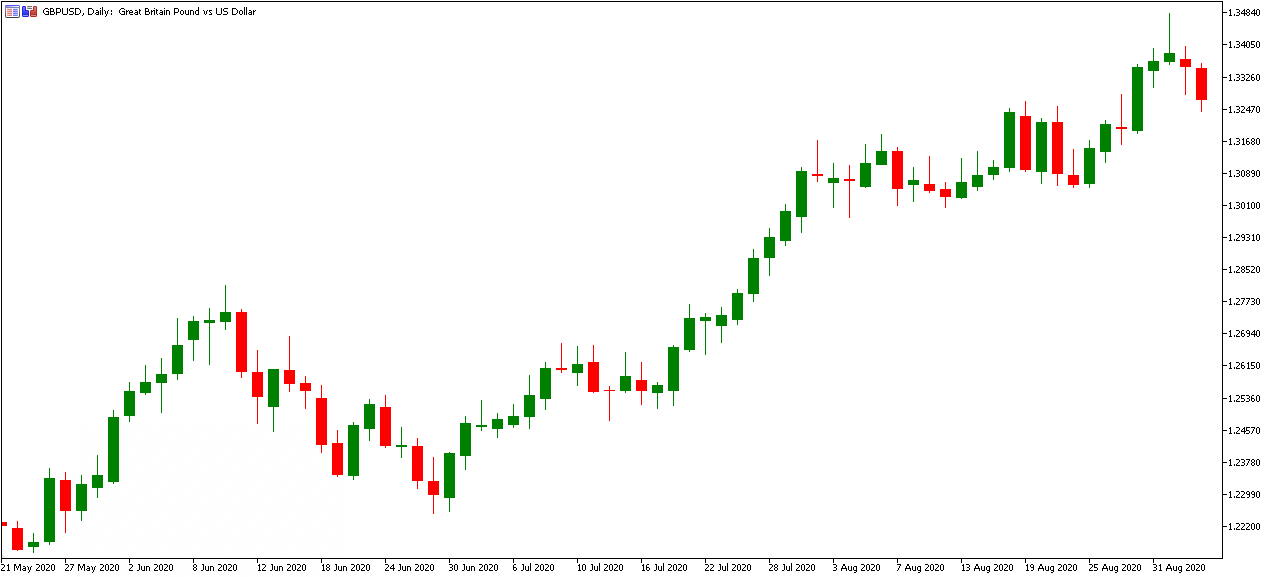
Candlestick charts were first used by Japanese rice traders in the 18th century and they are the most popular type of chart for Forex technical analysis. Similar to OHLC bars, candles also show the open, high, low and close values of a chosen time period.
The major difference is that the candles have a box between the open and close price values known as the 'body' of the candle which is coloured in, usually either red or green. Here, red indicates that the close price is lower than the open price, with green indicating the opposite.
Many traders find candlesticks charts the most visually appealing, which is one of the reasons they are so popular in Forex technical analysis.
Forex Technical Analysis: Chart Patterns
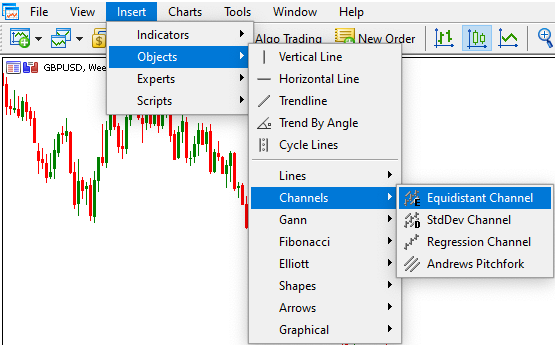
The MetaTrader trading software comes with a wide variety of technical analysis tools, that can be used to help identify chart patterns. They include drawing tools such as:
- Lines - Horizontal Lines, Trend Lines, Cycle Lines, Angle Lines.
- Channels - Equidistant Channel, Standard Deviation Channel, Regression Channel, Andrew's Pitchfork.
- Gann - Gann Line, Gann Fan, Gann Grid.
- Fibonacci - Fib Retracement, Fib Extensions, Fib Channel, Fib Time Zone, Fib Arc, etc.
- Elliott Wave - Motive Wave, Corrective Wave.
- And more.
These can be found by selecting 'Insert' in the top menu, then 'Objects'. For example, let's take the popular technical analysis tool, the Equidistant Channel, which can be accessed as shown below:
Once this tool is selected, the user simply needs to connect the swing highs, or swings lows, of a price to draw in their channel pattern. This can be done by:
- Left-click
- Hold down
- Release at another area on the chart.
In the example below, you can see an ascending channel pattern and a sideways channel pattern, highlighted using this technical analysis tool.

There are many types of different chart patterns used by traders in their technical analysis. Sometimes what is best depends on the market being traded, for example, some chart patterns work better with Forex technical analysis, whilst others may be preferable for stock market technical analysis. This will be covered in more detail later in the article.
Forex Technical Analysis: Candlestick Patterns
When it comes to candlestick charts, there are many different patterns which are used by traders in their technical analysis. Before we go through examples of patterns formed by candlesticks, let'e take a look at the two different types of candlestick.
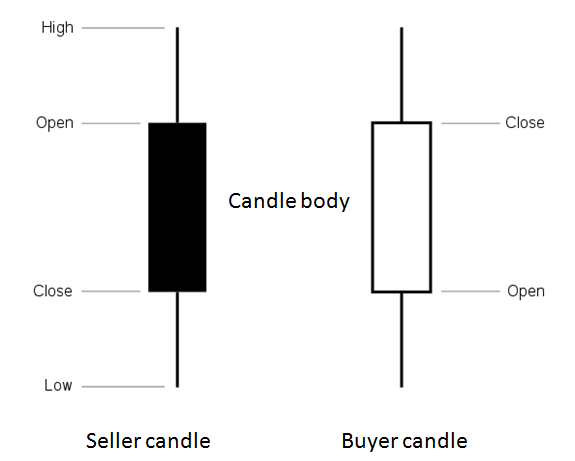
If you are viewing the daily timeframe in your price chart, then the above candles would each represent a full day's worth of trading and provides us with a lot of useful information, such as:
- The high and low prices of the trading day
- The seller (or bear) candle, usually shown by a black or red body, demonstrates that the sellers won the battle of the trading day. This is because the closing price level is lower than the opening price level.
- The buyer (or bull) candle, usually shown by a white or green body, informs the analyst that buyers won the battle of the trading. This is because the closing price level is higher than the opening price level.
This information can then be used, along with other technical analysis tools, to start building a picture of the market condition and the possible scenarios of what could happen next. For example:
- If after a seller candle, the next candle goes on to make a new low in price then it is a sign that the sellers are willing to keep on selling, or shorting, the market. This weakness will cause some traders to initiate short positions or hold on to the short positions they already have.
- If after a buyer candle, the next candle goes on to make a new high in price then it is a sign that buyers are willing to keep on buying the market. This strength will cause some traders to initiate long (buy) positions, or hold on to the long positions they already have.
There are a variety of different candle formations that are used in candlestick trading. One such pattern is called the Shooting Star:
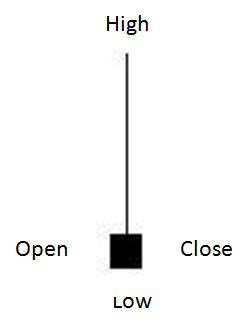
The Shooting Star pattern is a bearish signal which suggests a higher probability of the market moving lower than higher. In this pattern, the buyers push the market to a new high but fail to hold price there. Some buyers exit their long position, causing the market to fall lower, leading sellers to step into the market. Traditionally, the open and close of the candle body should be in the lower half of the candle.
Here are some examples of the Shooting Star candlestick pattern on the daily chart of GBP/USD:
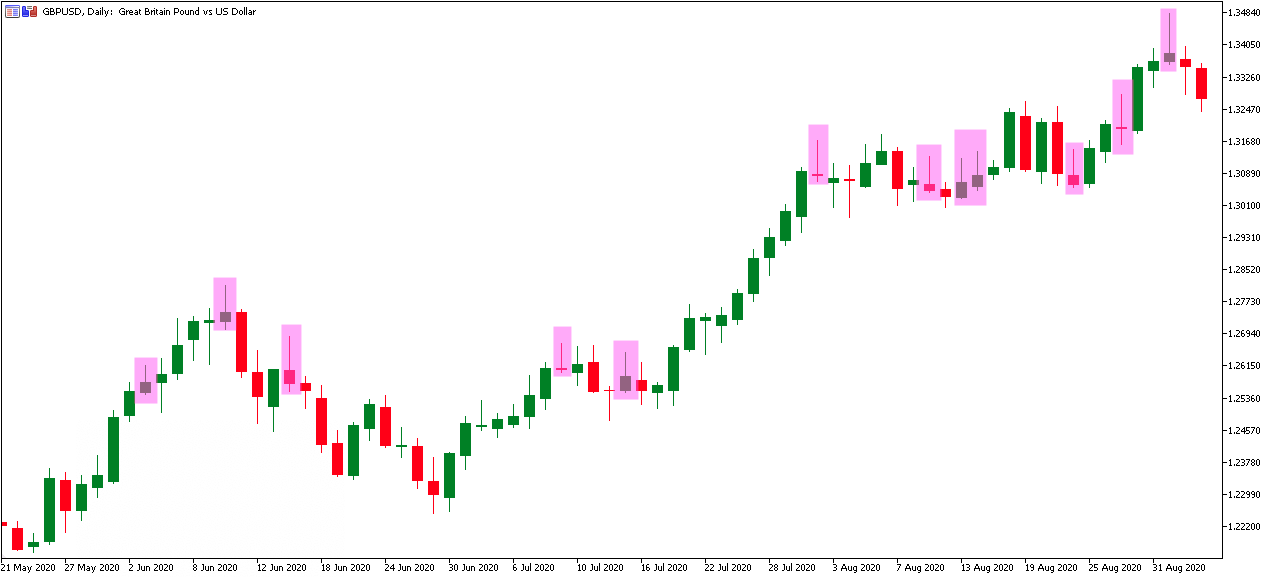
In the majority of cases above, the market did indeed go lower but in some cases, it went higher instead. A technical analyst would also draw upon other tools to build a complete picture on the market condition and identify possible areas to enter and exit.
Technical Analysis Indicators
Technical analysis indicators are programmed with different formulas using the open, high, low and close price values of a specific time period.
Generally speaking, there are four groups of indicators. The most popular ones are:
- Trend indicators:
- Momentum:
- Volatility:
- Volume:
While most indicators are particularly popular in Forex technical analysis, volume indicators are more suited to markets which trade on an exchange due to the trading volume being the primary source of data for those indicators. Studies of the total traded volume are helpful to financial traders in the stock market, the futures market and the commodity market as the buy and sell prices from these markets go through one central exchange like the London Stock Exchange or Chicago Mercantile Exchange.
The Forex spot market is traded OTC (Over-The-Counter) so the total volume will be different from broker to broker depending on which banks and hedge funds they get their pricing feed from. This means that, for the Forex market, the technical indicators which use volume are only using a portion of the total volume. How much of the data is representative is up for debate.
With such a wide variety of technical analysis indicators available, which ones to use may seem daunting at first. But don't worry! We will be exploring the most commonly used indicators for different markets later on in the article.
Technical Analysis for Different Financial Markets
Now that you know more about chart patterns, candle patterns and indicators, let's take a look at applying technical analysis on a range of different markets, all of which are available to trade on with Admirals.
Forex Technical Analysis
The high liquidity of the Forex market attracts all types of traders, from scalpers to swing traders. Forex technical analysis is widely used by many of these different participants in the market.
Let's have a look at one of the types of momentum indicators mentioned earlier and how it can be used in Forex technical analysis.
The Stochastic Oscillator is a very popular and widely used momentum indicator. It can be used to identify potential turning points in the market.
To add the Stochastic Oscillator to your MetaTrader price chart simply follow these steps:
- Open your MetaTrader 4 or MetaTrader 5 platform.
- In the top options select Insert - > Indicators.
- In the Indicators section select Oscillators -> Stochastic Oscillator.
- Press Ok.
So how is the Stochastic Oscillator used in Forex technical analysis? While there are many ways it can be utilised, the most common use is to identify overbought and oversold markets.
- When the Stochastic lines are above the 80 level it indicates the market could be overbought.
- When the Stochastic lines are below the 20 level it indicates the market could be oversold.
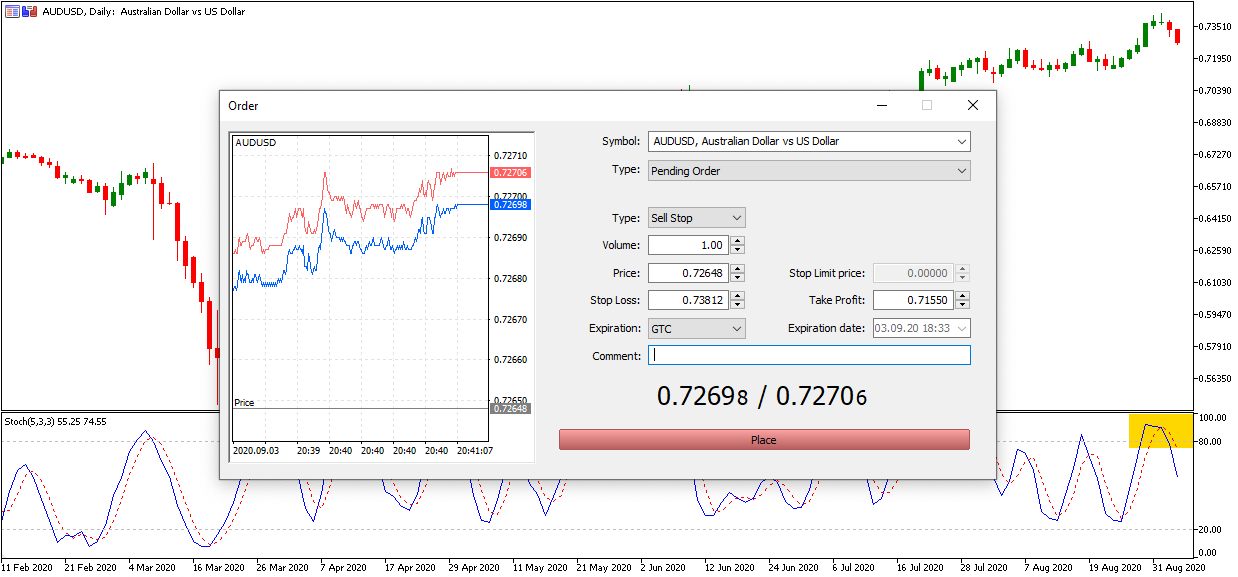
In the daily chart below of AUD/USD, the Stochastic lines were recently above the 80 level, signalling the market could be overbought and increasing the probability of a fall.

From this point, some traders may choose to wait for the lines to cross down below the 80 level and place an order to sell in anticipation the market will fall. To place an order to sell, traders can either:
- Right-click, select Trading and New Order
- Click F9 on their keyboard
- Click the New Order tab in the top window
Once the trading ticket opens, traders can then input their trade details such as the type of order, volume, entry price, stop-loss and so on. Typically, traders will use the previous bar high and low values for entry price levels and stop-loss levels.
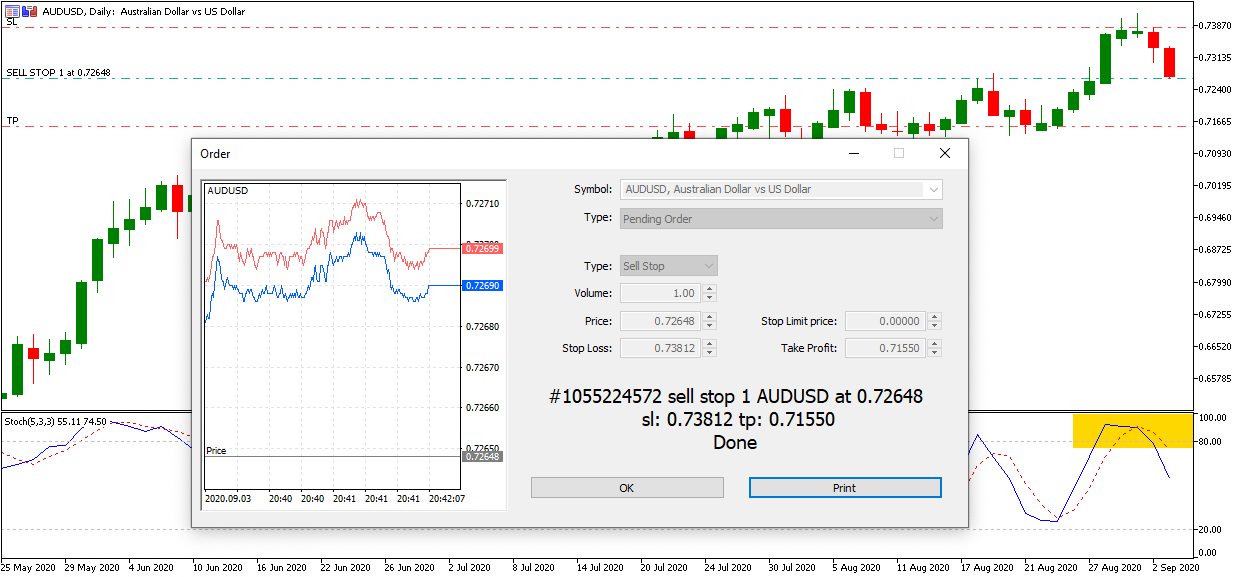
Once the trader is happy with their trade values, clicking the 'place' button will create a live order. The trading levels will now show as horizontal lines on the chart:
Cryptocurrency Technical Analysis
Cryptocurrencies such as Bitcoin and Ethereum are newer markets that are now widely available to trade on. In fact, with Admirals you can trade on cryptocurrencies against the Euro 24 hours a day, seven days a week!
While it is a newer market, cryptocurrency technical analysis still works well in the right market conditions. This is because chart patterns are still created from the buying and selling activity of traders in the market.
With cryptocurrency technical analysis, traders can use chart patterns, candlestick patterns or indicators. A popular indicator for cryptocurrencies, including for Litecoin technical analysis, is the Average True Range, or ATR indicator. This is because it is a volatility indicator and the cryptocurrency market is highly volatile.
To place the ATR indicator on your MetaTrader technical analysis software chart, follow these steps:
- Open your MetaTrader 4 or MetaTrader 4 platform.
- In the top options select Insert - > Indicators.
- In the Indicators section select Oscillators -> Average True Range.
- Press OK.

The blue line in the above chart shows the Average True Range of the daily chart price candles between July 2017 and July 2019 for BTC/USD. Cryptocurrency traders using technical analysis would use this to identify periods of high volatility and periods of low volatility to help with placing stop-loss levels and take-profit levels.
In times of high volatility, when the ATR is higher than usual or increasing, it means the daily bars are getting larger. Some traders may decide to go to the lower timeframes to capitalise on this volatility.
Conversely, in times of low volatility, when the ATR is lower than usual or falling, it means the daily bars are getting smaller. This in turn means traders may have to sit in trades for longer before they reach their target levels.
Stock Market Technical Analysis
Traditionally, stock market traders and investors have used fundamental analysis on whether to buy shares in a company. However, as the market now has a higher frequency of algorithmic traders using technical indicators and chart patterns, there are many more stock market traders using technical analysis than ever before.
It is common for stock market traders to also trade on stock market indices such as the S&P 500 or DAX 30 index. As the S&P 500 is one of the world's most recognisable stock market indices, using technical analysis to trade the S&P 500 can work very well in the right market conditions.
For example, many stock market traders like to see and trade on longer-term trends, often staying in moves for weeks or months. To do this, traders will often use the S&P 500 chart patterns, candle patterns and indicators to build a view on the overall health of the US stock market, as well as to trade the price action of the S&P 500 index chart.
The most commonly used tools are trend lines and horizontal lines which are forms of technical support and resistance. To access the free drawing tools in your MetaTrader platform simply click Insert from the top tabs in the platforms and then select Objects, Lines.
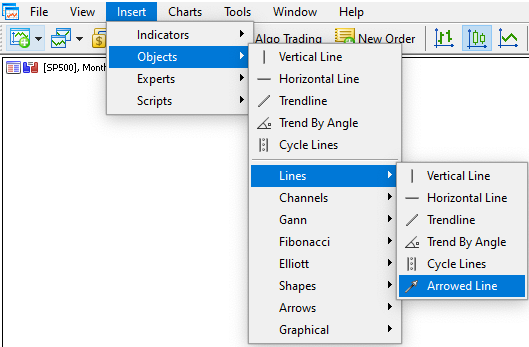
To draw a trendline on, traders can simply click the trendline option. The aim of a trendline in technical analysis is to connect the higher low cycles in an uptrend and the lower high cycles in a downtrend. Once the beginning points of these cycles have been determined, traders can left-click and hold down at the beginning of the first cycle and then, while holding down, drag the trendline to the next higher low cycle. This will then draw on a line to produce a trendline where multiple bounces could occur.
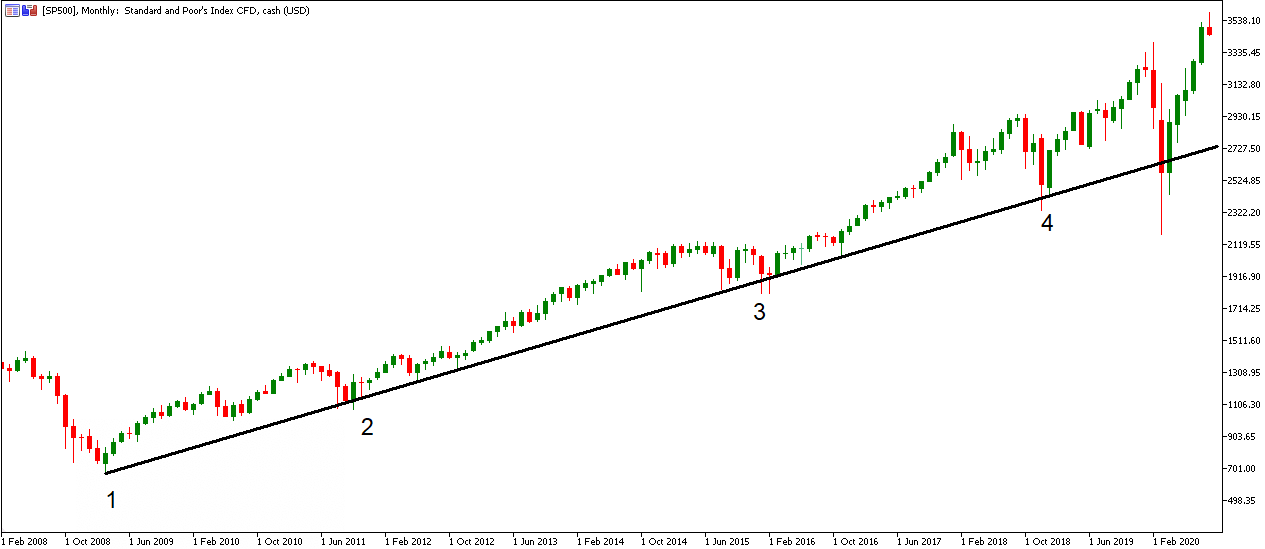
In the S&P 500 monthly chart above, the black line represents the trend line. It only takes points one and two to create the trend line and then traders may look for bounces off the next time it trades at the trend line as points three and four show.
Of course, at some point the price will break through the trend line, which is why successful traders also exercise sound risk management principles.
Technical Analysis of Commodities
Many traders use technical analysis when trading commodities, most commonly with key commodities such as gold and crude oil.
Two common candle patterns are the bullish and bearish engulfing candles. Engulfing candle patterns can often show key turning points in the market.
A bullish engulfing candle pattern occurs when a bear candle is followed by a bull candle and the body (open to close price) of the bull candle completely engulfs the body of the previous candle.
A bearish engulfing candle pattern is where a bull candle is followed by a bear candle and the body of the bear candle completely engulfs the body of the bull candle.
Let's have a look at some examples.
Gold Technical Analysis - Engulfing Candles
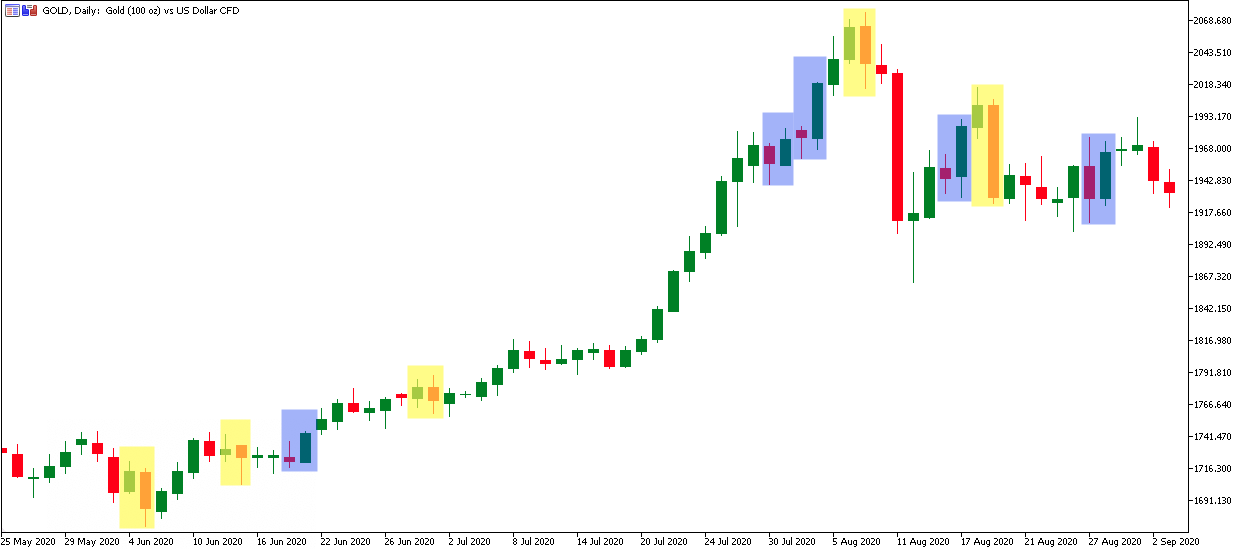
In the above gold price chart, the blue boxes highlight bullish engulfing candle patterns, whilst the yellow boxes highlight bearish engulfing candle patterns. In some cases, but not all, the market continued in the direction of the bullish or bearish engulfing candle. Gold traders using technical analysis will also look at other indicators and chart patterns, such as the MACD or Bollinger Bands to build a stronger picture of what could happen next.
Crude Oil Technical Analysis - Engulfing Candles
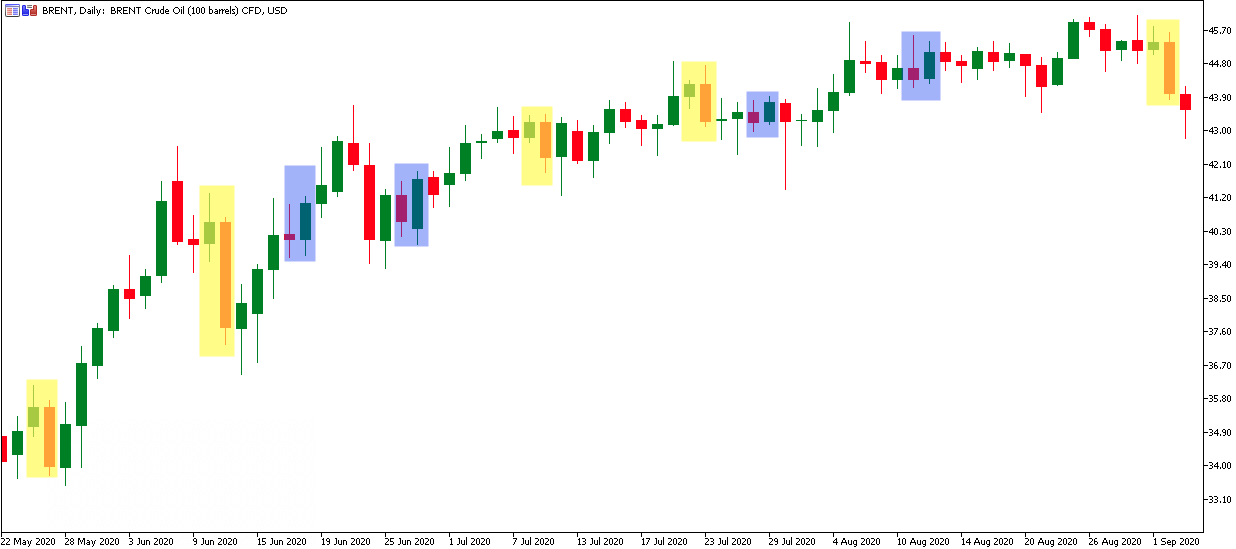
In the above crude price chart, the blue boxes highlight bullish engulfing candle patterns, whilst the yellow boxes highlight bearish engulfing candle patterns. As with the previous gold chart, in some cases, but not all, the market did continue in the direction of the bullish or bearish engulfing candle. Crude oil traders using technical analysis will also look at other indicators and chart patterns, such as trend lines and momentum indicators, as well as fundamentals to build a stronger picture of what could happen next.
Other articles that may interest you:
- Copy Trading With MetaTrader: How to
- Seasonal Patterns of Financial Markets: A complete guide
- What is Institutional Trading? The All You Need to Know Guide
Frequently Asked Questions
What is technical analysis?
Why is technical analysis important in forex trading?
Technical analysis is important in forex trading because it can help traders make informed decisions about when to buy or sell currencies. By analyzing price charts and patterns, traders can possibly identify potential entry and exit points, manage risk, and increase the likelihood of profitable trades.
What are some common technical analysis tools used in forex trading?
Common technical analysis tools in forex trading include moving averages, Relative Strength Index (RSI), Fibonacci retracement levels, candlestick patterns, and Bollinger Bands. These tools help traders assess market trends, momentum, and potential reversals to make better trading decisions.
INFORMATION ABOUT ANALYTICAL MATERIALS:
The given data provides additional information regarding all analysis, estimates, prognosis, forecasts, market reviews, weekly outlooks or other similar assessments or information (hereinafter “Analysis”) published on the websites of Admiral Markets investment firms operating under the Admiral Markets and Admirals trademarks (hereinafter “Admirals”). Before making any investment decisions please pay close attention to the following:
1. This is a marketing communication. The content is published for informative purposes only and is in no way to be construed as investment advice or recommendation. It has not been prepared in accordance with legal requirements designed to promote the independence of investment research, and that it is not subject to any prohibition on dealing ahead of the dissemination of investment research.
2. Any investment decision is made by each client alone whereas Admirals shall not be responsible for any loss or damage arising from any such decision, whether or not based on the content.
3. With view to protecting the interests of our clients and the objectivity of the Analysis, Admirals has established relevant internal procedures for prevention and management of conflicts of interest.
4. The Analysis is prepared by an independent analyst (hereinafter “Author”) based on the personal estimations of Alexandros Theophanopoulos (SEO and Content Specialist).
5. Whilst every reasonable effort is taken to ensure that all sources of the content are reliable and that all information is presented, as much as possible, in an understandable, timely, precise and complete manner, Admirals does not guarantee the accuracy or completeness of any information contained within the Analysis.
6. Any kind of past or modeled performance of financial instruments indicated within the content should not be construed as an express or implied promise, guarantee or implication by Admirals for any future performance. The value of the financial instrument may both increase and decrease and the preservation of the asset value is not guaranteed.
7. Leveraged products (including contracts for difference) are speculative in nature and may result in losses or profit. Before you start trading, please ensure that you fully understand the risks involved.