How To Use the Ichimoku Kinko Hyo Indicator in MetaTrader 4
Japanese candlesticks are extremely well known in the world of technical analysis. Did you know that there's another popular trading innovation from the same country? This is the Ichimoku Kinko Hyo indicator. This trend-following tool allows you to identify price action at a glance, even from large amounts of data, via multiple graphical elements. This article will explain the basics of the Ichimoku Kinko Hyo indicator and how to use it in MetaTrader 4 to augment trading Forex, as well as a look at a wide range of possible trading strategies you can use it with.

Table of Contents
- What is the Ichimoku Kinko Hyo Indicator?
- Components of the Ichimoku Kinko Hyo Indicator
- Advantages of the Ichimoku system
- Using Ichimoku Kinko Hyo Indicator in MT4
- Understanding the Ichimoku Indicator
- Ichimoku Chart in Real Conditions
- Ichimoku Forex Trading Strategies
- Ichimoku in Combination with Other Indicators
- Forex Ichimoku Kinko Hyo in Summary
- Find more interesting articles:
What is the Ichimoku Kinko Hyo Indicator?
The Ichimoku Kinko Hyo indicator was developed in the 1930s by Goichi Hosoda, a Japanese journalist. He spent 30 years perfecting his technique before making it public in the sixties.
The Ichimoku Cloud Indicator, also known as Ichimoku Kinko Hyo, is a versatile manual trading indicator that defines support levels and resistances, identifies the direction of the trend, measures momentum and provides trading signals in forex.
It is a trading system that works with all time frames, and with any instrument. This indicator gives traders a good understanding of the different markets and helps them discover a multitude of trading opportunities with a high probability, so that in a few seconds we will be able to determine if a trade with the current trend is positive or if you should wait for a better market setting in that particular pair.
Ichimoku can be used to show both uptrends or downtrends. This indicator should not be used when there is no clear trend.
Components of the Ichimoku Kinko Hyo Indicator
The Ichimoku Kinko Hyo indicator consists of a number of different graphical elements plotted on a single chart. The different elements are intended to help us identify where the support and resistance lies. They also allow us to work out if the market is trending, or if it's under consolidation. Here are the components that make up the Ichimoku indicator:
The Kumo, or Cloud
The cloud consists of the combination of the Senkou Span A + Senkou Span B lines.
The main function of the cloud is to identify trends.
- Signals:
- When the SSB is higher than the SSA, the trend is bearish
- When the SSA is higher than the SSB, the trend is bullish
- If the price oscillates in the cloud, we are in a lateral range or indecision zone
- If the cloud is thin, there is little volatility in the market
- If the cloud is wide, there is a lot of volatility in the market
The Tenkan, or Fast Line
The function of Tenkan is to inform about price volatility (being the closest median to the price).
Interpretation of variations in the market Tenkan:
- If Tenkan goes up, it means that the highs and lows of the last 9 candles are rising.
- If Tenkan goes down, it means that the highs and lows of the last 9 candles go down.
- If the market stops rising or falling, the Tenkan line remains flat.
- This is the most reactive line of the Ichimoku Kinko Hyo system. This average does not shift to the right or to the left, unlike the Chikou average.
The Kijun Sen, or Slow Line
Its function is to inform us about the long-term volatility of the price and directly reflects the price.
- Interpretation:
- If the Kijun goes up, it means that the highs and lows of the last 26 candles are increasing.
- If the Kijun goes down, it means that the highs and lows of the last 26 candles are decreasing.
- If the market stops rising or falling, the Kijun line stays flat.
The Chikou, or Delay Line
Chikou's function is to represent the price action for the last 26 periods. That is, it is the mirror image of the price, but shifted forwards 26 periods.
Thanks to this, we can compare the current price situation with that of 26 periods ago. Analysis of the Chikou relative to other levels of Ichimoku can confirm a new trend and its potential.
This is the only line of Ichimoku Kinko Hyo Forex that is not based on the Donchian Channel.
Although all of the constructions on one single chart may seem a little daunting, the ultimate aim of the indicator is simplicity. You also don't have to worry about specific calculations, as MetaTrader 4 will perform them for you. It's more important to understand the basics of what each line represents.
Advantages of the Ichimoku system
- It can be used in almost all trading markets, including the stock, futures and options markets, forex, indices, and precious metals (gold and silver), etc.
- Ichimoku allows you to quickly choose the configurations or trade preferences at a glance, including the immediate understanding of the direction of the price movement, the feeling, the momentum, and the strength of the trend.
- Ichimoku shows a very clear picture, as it displays a lot of data, which provides greater reliability in understanding the price action. This technique combines three indicators in a graph, which allows the trader to make a more informed decision.
- Ichimoku is a trend identification chart system. That means it works best in markets showing clear trends. It helps to find the direction of the price movement, so that the trader will have a good understanding of the trends in general.
- With Ichimoku it is possible to capture false price breaks, as this system helps you to capture the direction of the trend in the time frame of the trade.
Using Ichimoku Kinko Hyo Indicator in MT4
It's very easy to find and launch the Ichimoku Kinko Hyo indicator in MT4. You don't need to download the Ichimoku indicator separately, as it comes bundled with the core tools of the platform. All you need to do is look at the list of Indicators within the 'Navigator' tab. The image below shows that there are four subfolders of indicators with the MT4 Ichimoku indicator, contained within the 'Trend' subfolder:

Source: MetaTrader 4 - USD/JPY 1 Hour - Setting the colors for the Ichimoku Kinko Hyo indicator
Clicking on 'Ichimoku Kinko Hyo' opens a dialogue window, which lists the various graphical elements for the indicator. The default colours are shown in the image above. You can also easily configure other visual aspects via the dropdowns (e.g. line thickness, dotting, etc.) If you wish to set the periods, click on the 'Parameters' tab. The default values are as follows:
- Tenkan-sen: 9
- Kijun-sen: 26
- Senkou span B: 52
The image below shows the Ichimoku indicator with default values added to an hourly USD/JPY chart:

Depicted: MetaTrader 4 - USD/JPY 1 Hour Chart with a Ichimoku indicator applied - Disclaimer: Charts for financial instruments in this article are for illustrative purposes and does not constitute trading advice or a solicitation to buy or sell any financial instrument provided by Admirals (CFDs, ETFs, Shares). Past performance is not necessarily an indication of future performance.
Understanding the Ichimoku Indicator
Tenkan-sen (red line) represents short-term price movement. It is similar to a fast moving average. If the market price is above the Tenkan-sen line, it is a short-term bullish sign. If the price is below Tenkan-sen, it is a short-term bearish sign. One function of Tenkan-sen is to clue us in with regards to the character of the market.
This is because the direction of the Tenkan-sen line can suggest if the market is trending or not. A rising Tenkan-sen suggests an upward trend, and a falling line represents a downward one. As the line is calculated from price extremes, it will tend to flatten out when the market is not trending. Therefore, if Tenkan-sen is moving sideways, it suggests that the market is range-bound.
As Ichimoku is primarily a trend-following system, you should only trade using Ichimoku when you are in a trending market. Kijun-sen (dark orange line) represents medium-term price movement. Think of it as being a little like a slower moving average in comparison to Tenkan-sen. Once again, it can clue us into the trend, but over a longer time-frame.
The interaction of Tenkan-sen to Kijun-sen can give us trading signals, in a similar fashion to a moving average crossover. That is to say, if the fast-moving Tenkan-sen crosses above the slower-moving Kijun-sen, it can be a signal to buy. A crossover of Tenkan-sen below Kijun-sen can be a signal to sell.
Whether we follow these crossover signals is governed by the Chikou span (lime green line) that helps us see the big-picture trend of the market. Remember, the Chikou span plots the current closing price 26 periods back on the chart. If it is above the chart of price, it means that current prices are higher than previous ones.
This is bullish. When the price is above the Chikou span, the current prices are lower than previously, suggesting a bearish tenor. You should use the Chikou span as a trade filter, only placing trades that agree with the overall trend. For example, if the Tenkan-sen crosses below the Kijun-sen, you would only sell if the Chikou span indicated a bearish overall trend.
The kumo, or cloud, is the space bounded between the Senkou span A and the Senkou span B. If the price is above the cloud, it is a bullish sign. The top of the cloud acts as a first line of support, and the bottom of the cloud, as a second line. If the price is below the cloud, the reverse is true.
It is a bearish sign, and the bottom of the cloud acts as the first level of resistance. Logically, the top of the cloud is the second level of resistance. The wider the cloud, the stronger the expected support, or resistance. A thin cloud represents only weak support/resistance.
Ichimoku Chart in Real Conditions
Here are the 8 questions you should ask yourself when using the ichimoku indicator on a chart:
- Is the current price higher than that of the Ichimoku Kumo cloud or the neutral zone?
- If the market is trending, ask yourself where the price is compared to the Ichimoku cloud. This helps to know if the trend is bullish or bearish. If the price is in the Kumo cloud, it is a neutral zone. In this case, we must wait for a break.
- So, is there a Tenkan / Kijun crossing? If so, is it a strong or weak signal, as we defined earlier in this article?
- Is the cloud or Kumo bullish or bearish?
- Is the price higher or lower than that of Chikou?
- Where are the supports and resistances of Chikou?
- What is the range of volatility?
- Where is the price compared to the Tenkan and Kijun lines?
This combination of factors, complemented by an analysis of multiple time units, provides excellent results to find a general trend and main levels of support and resistance. So with these facts in mind, let's start discussing some of the most significant strategies you can use with Ichimoku indicator:
The Complete Guide to Ichimoku
Before covering some Ichimoku strategies let's explore an expert's view and take advantage of his hands-on experience in the subject. The below free webinar is hosted by expert trader - Paul Wallace.
Ichimoku Forex Trading Strategies
Using Ichimoku for Trend Confirmation with the Cloud (Kumo)

Source: EURUSD, Chart H1 , MT5 Admiral Markets. Data range: from September 19, 2019 to October 11, 2019. Held on October 14, 2019. Keep in mind that past performance is not a reliable indicator of future results.
Buy Signal
- When the price enters the cloud (kumo) from the bottom.
- While the price is or remains above the cloud, we understand that the currency pair is in an uptrend.
Sell Signal
- When the price enters the cloud (kumo) from the top.
- While the price is below the cloud, we understand that the currency pair is in a downtrend.
Ichimoku Strategy with Kijou and Tenkan
As with other trading systems based on crossing averages, in Ichimoku we will find our buy and sell signals when the Tenkan Sen lines (turn line) cross the Kijun Sen (standard line), and once we have well defined the current trend, we can trade based on this information.
As we have said before, the fast line is calculated on the basis of the last 9 data while the slow line is calculated based on the last 26. Therefore, when the price moves, the fast line moves faster. That slow line.
In the image below, the fast line is red and the slow line is blue. One of the simplest ways to locate the fast line is that when the market is in a lateral trend, the fast line is always closer to the price (the sail) than the slow line.

Source: EURUSD, Chart H1, MT5 Admiral Markets. Data range: from September 19, 2019 to October 11, 2019. Held on October 14, 2019. Keep in mind that past performance is not a reliable indicator of future results.
- Ichimoku will generate a buy signal when the fast line crosses up to the slow line
- Ichimoku will generate a sell signal when the fast line crosses down below the slow line
The strength of these signals will vary depending on some characteristics, so it will differentiate different types of buy signals. But in the case of sales signals, there isn't much variation.
- If the upward crossing of the fast line over the standard line occurs above the cloud and in addition the Chikou Span delay line is also above the cloud or Kumo, we will consider the buy signal as strong.
- If the crossing of both lines occurs within the cloud or Kumo, the signal obtained will be considered medium strength.
- However, if the upward crossing of the Tenkan or fast line with the Kijun or slow line passes below the cloud or kumo, but Chikou Span is above the cloud we will consider this buy signal as weak. This behavior can also be considered as the beginning of an uptrend, and the end of a bearish steak.
Ichimoku Strategy with Chikou Span
The Chikou span or delay line can be used to determine the strength of the buy or sell signal.
- The signal will be on the side of the sellers (bears) if the Chikou Span line is below the current price.
- The signal will be on the side of the buyers (bulls) if the Chikou Span line is above the current price.
This is a special line, since it confirms any current trends with greater reliability than when comparing the price with the cloud, like in the first strategy.
When functioning as an additional confirmation, some traders only trade when the delay line shows that there is an opportunity. They wait patiently for this strategy to confirm the signals.
As the image below shows, even when the Cloud strategy (price vs. cloud) is not supported, the latter strategy with the delay line is still valid.
- When the delay line is above the cloud, it is a buy signal
- When the delay line is below the cloud, it is a sell signal

Ichimoku Strategies - Exit and Stop Loss
Ichimoku can also protect your trades, since we can also use it to generate exit signals and to place stop-loss orders.
Ichimoku exit strategy
If we open a long trade using the line crossing strategy (described above), we will get an exit signal from this long position when these 2 lines cross once again, but in the opposite direction.
On the other hand, if we enter the market with a long position using the other two strategies above, we will obtain the exit signal when the price or the delay line crosses to the cloud in the opposite direction in which they crossed when He opened this position.
Ichimoku strategy to place Stop loss
We can use the Ichimoku to place a stop loss and to find several support and resistance points. Since the fast line, the slow line, or cloud can be used as possible support and resistance levels. Once these supports or resistances are broken, the price can have a boost, so you can move on to the next level of support or resistance. Thus, stop-loss orders can be placed:
- On the other side of the cloud
- On the other side of the fast line
- Or, on the other side of the slow line
Also, in long positions, we can place the stop-loss a few pips below the most recent low. In contrast in short positions, the stop-loss can be placed a few pips above the most recent high.

Ichimoku Scalping Strategy
This Ichimoku strategy is based on an analysis with several time frames, which are:
- 15 min for a medium-term long-term trend and key support levels and resistance
- 5 min for a short term trend
- 1 min to open and close positions.
The time units are used to identify the context of the Forex pair in question.
We all know that the supports and resistances identified in higher time frames will have a greater impact on the price action. Therefore, the Ichimoku M15 and M5 analysis is essential.
The Ichimoku M1 chart is used to take the position according to the signals described earlier in this article.
How can we filter scalping opportunities with Ichimoku?
It is advisable not to consider the crossings of the cloud (Kumo) if in 26 periods before, the price is within the cloud. Only when the price is out of the cloud.
The forex scalping method with Ichimoku is suitable for:
Any type of market and any type of instrument such as:
- Stock indexes with Ichimoku: CAC 40 CFD, Dow Jones CFD, S&P 500
- Forex with Ichimoku with Euro USD with EUR USD CFD or Ichimoku for the pound sterling with GBP USD CFD
- Raw materials with Ichimoku as gold with the GOLD CFD
- Cryptocurrencies with Ichimoku in Bitcoin BTC CFD, Ichimoku in Ethereum ETH USD CFD
Ichimoku strategy for Swing Trading
For this strategy, we will use the parabolic SAR indicator in addition to the Ichimoku indicator.
Buy Signals
This swing trading strategy tries to take advantage of the beginning of the cycle, that is, the momentum movement of the forex pairs. When Tenkan-sen crosses up to Kijun-sen, the forex market will tend to continue higher. The triggering of the parabolic SAR above the price marks a break and the last step necessary to take the position.
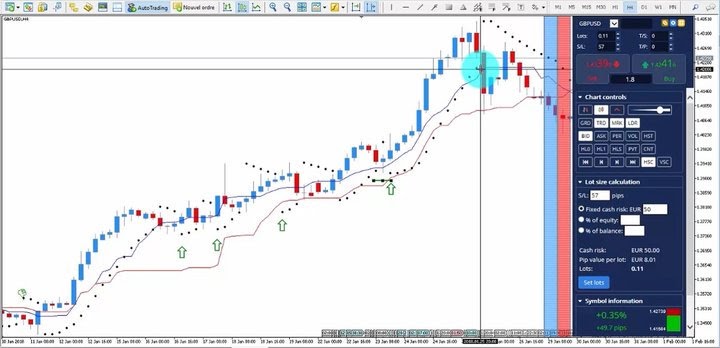
Source: GBP / USD CFD, H4, Admiral Markets, February 2018, MT5
- Tenkan-sen must be higher than Kijun-sen
- Tenkan-sen must have an upward slope (Forex Tip)
- The parabolic SAR indicator must be at the highest point
Sell Signal
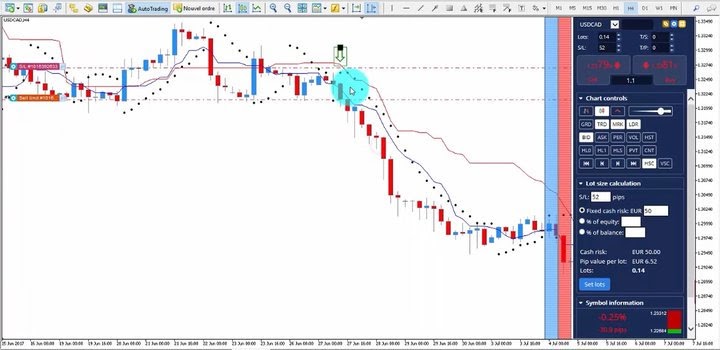
Source: USD / CAD CFD, H4, Admiral Markets, February 2018, MT5
- Tenkan-sen must be less than Kijun-sen
- Tenkan-sen must have a descending slope
- Sar Indicator at the lowest point
Similarly, when the Tenkan-sen is lower than the Kijun-sen, the Forex market will tend to decline, the downward slope of Tenkan-sen is another indication to open a short position. The activation of the parabolic SAR located below the price marks a break and the last criterion necessary to take the position.
Where to place the stop loss and take profit in this strategy with ichimoku?
Stop Loss
- Always behind the latest highs and lows, so the structure of the Forex market is respected.
- If the market turns around before our first objective, it means that the current trend may change, so it is not time to enter but limit the risk and try to seize the next opportunity.
Take Profit
- Whether it is a long or short position, the take profit has a 1:1 ratio.
Position Management
- A trailing stop intervenes as soon as it has reached the first take profit, which means that after a move in your favour of the same size as your stop loss, it's time to leave your position with gains.
- This trailing stop is activated with the SAR parabolic indicator. Once you reach your first goal, the trailing stop will move according to the SAR points on the Forex H4 chart based on:
- New SAR lows for a long position
- New SAR lows for a short position
Ichimoku in Combination with Other Indicators
It's a general truism that using more than one indicator tends to yield more reliable results. Even the Ichimoku indicator can benefit from some backup. Ideally, you would aim to use indicators that perform the same function, but arrive at that result via different methods. For example, you could compare the support and resistance levels indicated by the cloud with the levels shown by the Center of Gravity Indicator.
Similarly, you could compare the trend indications of the Chikou span with the information about the trend strength provided by the Momentum Indicator. Obviously, the wider the selection of tools available to you, the better positioned you will be to make these kinds of comparisons.
You'll surely find it useful to install the MetaTrader Supreme Edition plugin and substantially expand your armoury of trading tools. MTSE is a custom plugin for MetaTrader 4 and MetaTrader 5 that has been carefully put together by market professionals to provide a cutting-edge trading experience.
Forex Ichimoku Kinko Hyo in Summary
The Ichimoku trading system is an advanced indicator in that it plots more information compared to your average technical analysis tool. With a bit of practice, you can learn to readily absorb the data at a glance. After a while, you should be able to make better trading decisions on the back of its graphical summation of price action. Of course, the best place to practise is a demo trading account, where you can polish your skills without risking any money.
Find more interesting articles:
- Currency Strength Meter
- Using a Spread Indicator in MT4 to Sharpen Your Trading Decisions
- Using the Admirals Renko Indicator to Spot Significant Price Movements
This material does not contain and should not be construed as containing investment advice, investment recommendations, an offer of or solicitation for any transactions in financial instruments. Please note that such trading analysis is not a reliable indicator for any current or future performance, as circumstances may change over time. Before making any investment decisions, you should seek advice from independent financial advisors to ensure you understand the risks.