Center of Gravity Indicator, Explained
An excellent tool which you can use to determine support and resistance levels in your trading activity is the Center of Gravity indicator, also known as COG indicator. This article will provide traders with a greater understanding of the COG (Centre of Gravity) indicator. You will learn what the COG indicator is, how to use the COG indicator, how to download and implement the COG indicator in MetaTrader 4 (MT4), and more.
Table of Contents
What is the Centre of Gravity Indicator?
The Center of Gravity indicator, also known as the COG indicator, is a graphical tool that helps to identify support and resistance levels. The classic form of the indicator is as a oscillator, formed by means of a weighted moving average. It is reasonably new compared to many better-known indicators, but is increasing in popularity, as a method of trying to gain insights into future price swings.
As an oscillator, it offers two main benefits: a low lag in response to price (its creator reportedly claimed that there is zero lag) and clear turning points. As we will see, however, there are several different implementations of the root concept. Despite their differences, these all effectively aim to achieve the same thing: to identify where the outer limits of a trading range lie.
Leading and Lagging Trading Indicators
Indicators can be split into two broad categories: those that are leading, and those that are lagging. Leading indicators are predictive, attempting to give signals ahead of a move. Lagging indicators occur after a move, and are often used as a confirming tool. Lagging indicators are useful for trending markets. For example, it allows you to confirm that a trend has begun, and then enables you to jump on the back of it. In contrast, leading indicators attempt to signal a move before it occurs.
Often leading indicators take the form of oscillators, which means that their value swings up and down within a bounded range. An example of a well-known oscillator is the Relative Strength Index (RSI), which varies between 0 and 100. It attempts, within this range of values, to indicate whether a market is overbought or oversold. As stated earlier in the introduction to this article, the Center of Gravity indicator was originally conceived as an oscillator.
Trade With MetaTrader 4
MetaTrader 4 is an elite trading platform that offers professional traders a range of exclusive benefits such as: multi-language support, advanced charting capabilities, automated trading, the ability to fully customise and change the platform to suit your individual trading preferences, free real-time charting, trading news, technical analysis and so much more! Click the banner below to receive your FREE MetaTrader 4 download!
Origins of the Center of Gravity Oscillator
A Center of Gravity trading system was first proposed by technical analyst John Ehlers. He viewed weighted moving averages of price as analogous to the way that the weighted coordinates of a physical object's mass distribution, it terms of how it defines its center of gravity. He described the center of gravity for a given timeframe as the sum of the product of a position multiplied by price, which is then divided by the sum of prices. The position being the count of bars back from the current bar. In other words, this was the COG formula equation he came up with:
- COG = i=0N(xi+1) Priceii=0NPricei
Classic implementations of the center of gravity use this calculation to produce an oscillator, and there is more than one version available for MT4.
COG Indicator with MT4
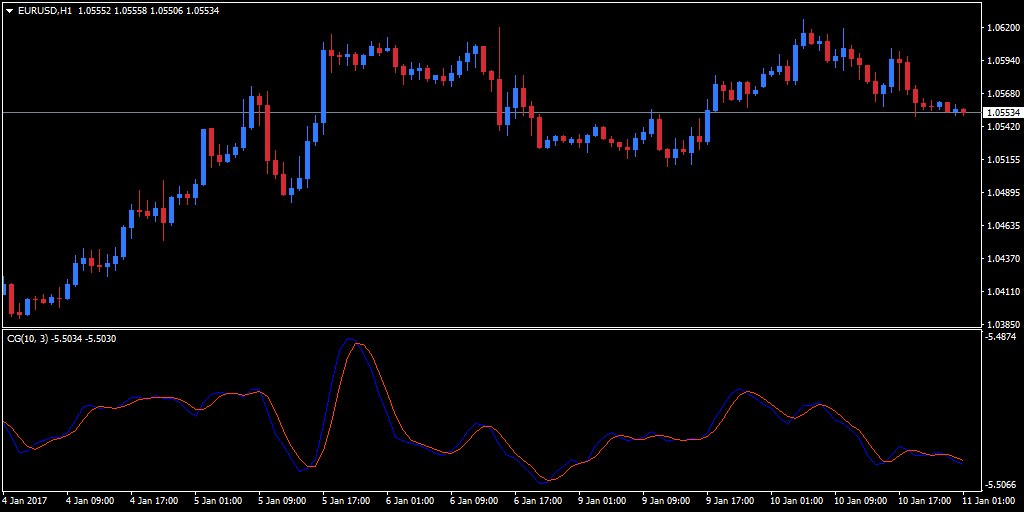
Depicted: MetaTrader 4 - EURUSD Hourly Chart - Disclaimer: Charts for financial instruments in this article are for illustrative purposes and does not constitute trading advice or a solicitation to buy or sell any financial instrument provided by Admirals (CFDs, ETFs, Shares). Past performance is not necessarily an indication of future performance.
The graph above displays a conventional oscillator version of the COG indicator downloaded for MT4. The Center of Gravity lines appear below the chart, shown as two very similar red and blue lines. The signal to trade is when the lines of the indicator cross. The direction of the trade should be in the direction of the cross. How this oscillator behaves is ultimately determined by what period of observation you choose, and it can yield variable results.
If you download a Center of Gravity indicator, you'll have a variety of choices, and the differences between them can be significant. Some traders plot a COG channel on the actual chart, while some plot an oscillator below the main chart (as shown in the graph above). MetaTrader 4 Supreme Edition uses the COG principles to offer a version that is incredibly simple to use and understand. So if you are looking for a really straightforward COG indicator, you may find that this is the best Center of Gravity indicator for you. It is a leading indicator that plots clear support and/or resistance lines to aid your decision making.
MetaTrader 4 Supreme Edition is a plugin that provides traders with a special, expanded version of MT4. When you download MT4SE, you don't just receive a MT4 Center of Gravity indicator in isolation. Instead, you get a whole tranche of tools and extra functionality that has been chosen and developed by trading professionals. Once you have downloaded MT4SE, you will see the indicator listed as 'Admiral Gravity' in the 'Navigator'. The hourly USD/CHF chart below shows the Admiral Gravity indicator in use:
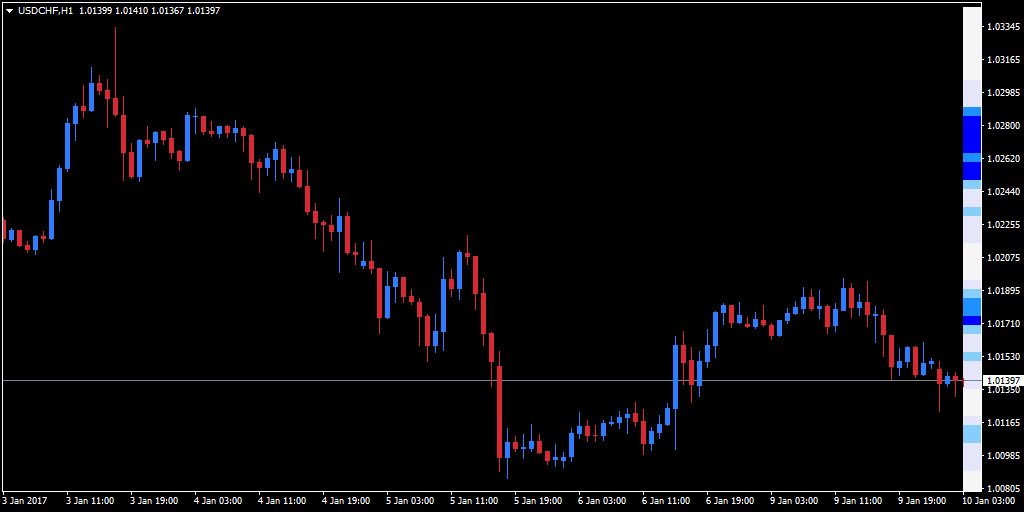
Depicted: MetaTrader 4 - USDCHF Hourly Chart - Disclaimer: Charts for financial instruments in this article are for illustrative purposes and does not constitute trading advice or a solicitation to buy or sell any financial instrument provided by Admirals (CFDs, ETFs, Shares). Past performance is not necessarily an indication of future performance.
The indicator looks back at historical data, applies a weighting in favour of newer prices, and then calculates zones of resistance and support. The Admiral Gravity indicator displays these zones as coloured bands (as you can see on the right hand side of the chart above). The darker the blue you see, the stronger the indicated support or resistance is. In keeping with conventional theory of price action, the price is likely to rebound from these bands of support or resistance. Should the price clearly break through the darkest blue band, it may indicate the formation of a new trend.
Blue is the default colour for the bands, but can easily be configured to any colour of your choosing. Another aspect you can change is the time period, with a choice between a normal calculation, or a shortened version for smaller durations. It's also possible to alter the area of reference. To do this, you simply need to draw a vertical line on the chart, and then edit the line and change the 'Name' field to 'GStart' . Notice how it drags the bars across the chart to wherever you have chosen to place the vertical line.
The hourly AUD/USD chart below shows this in action:
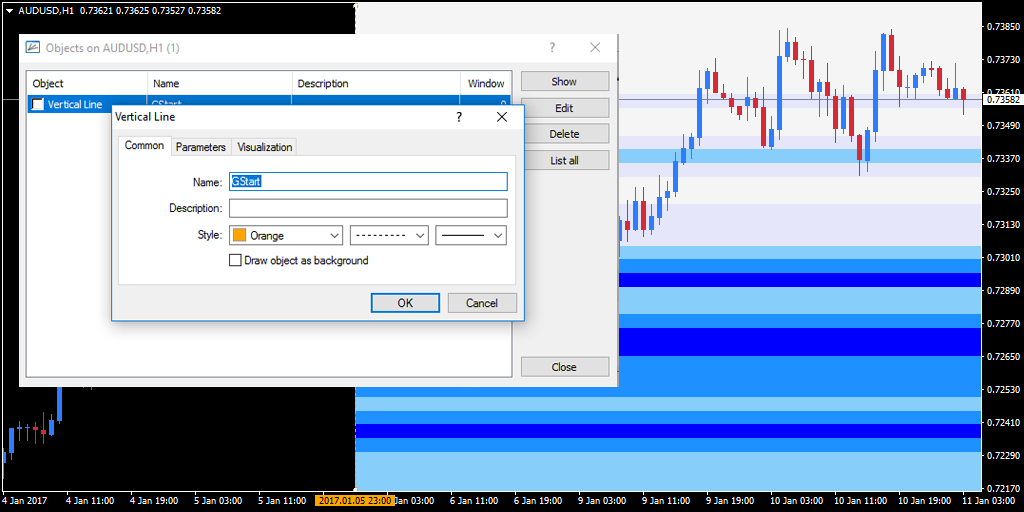
Source: MetaTrader 4 - AUDUSD Hourly Chart - Changing Time Periods - Disclaimer: Charts for financial instruments in this article are for illustrative purposes and does not constitute trading advice or a solicitation to buy or sell any financial instrument provided by Admirals (CFDs, ETFs, Shares). Past performance is not necessarily an indication of future performance.
Center of Gravity Indicator: When to Use It
As we stated in the introduction, the COG is a leading indicator. Leading indicators tend to be useful in range-bound markets, and can be used to identify where the upper and lower bounds of the range are likely to be. This aids in trading turning points in the price. The Center of Gravity system is ill-suited to a trending market,, as trying to trade these inflexion points in such circumstances can be risky. It's important, therefore, to first identify a range-bound market.
We want a market that is fluctuating regularly up and down, but with no clear overall net movement. You might find that another indicator, or a combination of other indicators will aid you in identifying a sideways moving market.
It's a general piece of wisdom that the utility of a technical indicator can be enhanced by comparing its findings with that of another indicator. The best indicator in the world is going to be wrong a fair amount of the time. So it's a great idea to try and winnow out as many false signals as you can.
The Admiral Gravity indicator is great because it's so simple and easy to use, but it's more useful as a general guide to areas of support and resistance. You will probably want to use it in combination with another tool to firm up your trading signals. As an example, the screenshot below shows default-value Keltner Channels overlaid on an hourly AUD/USD chart:

Source: MetaTrader 4 - AUDUSD Hourly Chart - Using Admiral Keltner Channels - Disclaimer: Charts for financial instruments in this article are for illustrative purposes and does not constitute trading advice or a solicitation to buy or sell any financial instrument provided by Admirals (CFDs, ETFs, Shares). Past performance is not necessarily an indication of future performance.
Can you see how the lower Keltner channel and the blue support zone tally up in a couple of places? Notice also how the market bounces off these points. The Keltner channel indicator is another one of the tools that come as part of the MetaTrader 4 Supreme Edition add-on.
Center of Gravity Indicator Strategy: The Final Word
As we discussed earlier, there are a number of different types of MT4 COG indicators available to download. Whichever ones you choose to look into, make sure you try them out first without risking real money. Our free demo trading account offers an excellent environment for experimenting with different indicators and trading strategies. Doing so will allow you to determine which center of gravity Forex indicator is the best for you. We hope that you found this discussion of the Centre of Gravity Forex indicator useful, and that it proves to be a profitable tool for your trading.
Trade Free With A Demo Account
Did you know that it's possible to trade with virtual currency, using real-time market data and insights from professional trading experts, without putting any of your capital at risk? That's right. With an Admirals' risk-free demo trading account, professional traders can test their strategies and perfect them without risking their money.
A demo account is the perfect place for a beginner trader to get comfortable with trading, or for seasoned traders to practice. Whatever the purpose may be, a demo account is a necessity for the modern trader. Open your FREE demo trading account today by clicking the banner below!
Other articles you may find interesting:
- How to Use the Parabolic SAR Indicator
- How to Trade with the DeMarker Indicator
- Hunting Key Levels With the Envelopes Indicator
This material does not contain and should not be construed as containing investment advice, investment recommendations, an offer of or solicitation for any transactions in financial instruments. Please note that such trading analysis is not a reliable indicator for any current or future performance, as circumstances may change over time. Before making any investment decisions, you should seek advice from independent financial advisors to ensure you understand the risks.