How to Trade with the DeMarker Indicator
This article will teach traders all about the Forex DeMarker trading indicator. We will examine how to find price reversals with the DeMarker oscillator, how to use DeMarker indicator in MetaTrader 5, a DeMarker indicator strategy and much more!

Table of Contents
What Is the DeMarker Indicator?
The DeMarker indicator is an oscillator that derives its values by comparing the maximum and minimum prices achieved in the current time period, with the equivalent prices achieved in the previous period. From this comparison, the DeMarker indicator attempts to assess the directional bias of the market. At the same time, it indicates overbought and oversold conditions, and from these, attempts to identify points of trend exhaustion.
The indicator is broadly based on principles espoused by technical analyst Tom DeMark, though the original indicator used no smoothing. The version available in both MetaTrader 4 and MetaTrader 5 uses Simple Moving Averages (SMAs) to smooth component values, as we shall see later on.
Though the DeMarker oscillator was originally devised with daily price bars in mind, it can be used on any time frame you are interested in, since it is based on relative price data.
The DeMarker Indicator Formula
Unlike the Relative Strength Index — perhaps the most well-known oscillator — the Forex DeMarker oscillator does not concern itself with closing levels. Instead, it focuses on intra-period highs and lows. The DeMarker oscillator looks at the high and low of the current bar on a chart and how they compare to those of the previous bar. If the current bar has more extreme levels, a value is stored.
If the magnitude of the high and low is less extreme than in the previous bar, a value of zero is recorded. These values are used over a 'look-back' period (customarily 14 bars) to give us a numerator and denominator. Finally, the DeMarker value is calculated by dividing the numerator by the denominator. Let's break the DeMarker indicator formula down into its component steps.
First, we want to look at the high values. Over the number of periods, 'N', the high of each bar is compared to the previous high. If the current high is lower than the previous high, a value of 0 is recorded. If it is greater than the previous high, the difference between the two is recorded as the value. These values are called 'DeMMAX'. The numerator is a simple moving average of the DeMMAX values over the period 'N'.
Now, we look at the low values, by looking at each bar and seeing how the low compares to the previous low. If the current low is higher than the previous low, a value of 0 is recorded. If the current low is lower than the previous low, the difference between the two is recorded as the value.
These values are called 'DeMMIN' and take a simple moving average of them over the period 'N'. This is then added to the numerator to give us the denominator. This can be summarised with the DeMarker indicator formula, which is as follows:
The equation yields values bounded between 0 and 1. Values of the indicator above 0.7 are considered overbought territory. Values of the indicator below 0.3 are considered oversold territory. Let's take a look at how to use DeMarker indicator in MT5 (the process is the same as using the indicator in MT4).
How to Use DeMarker Indicator in MetaTrader 5
When you download MT4 or MT5, the DeMarker oscillator is included as one of the indicators that come as standard with the platform. You will find it in the 'Oscillators' folder when you look in MT5's 'Navigator', as you can see from the image below:
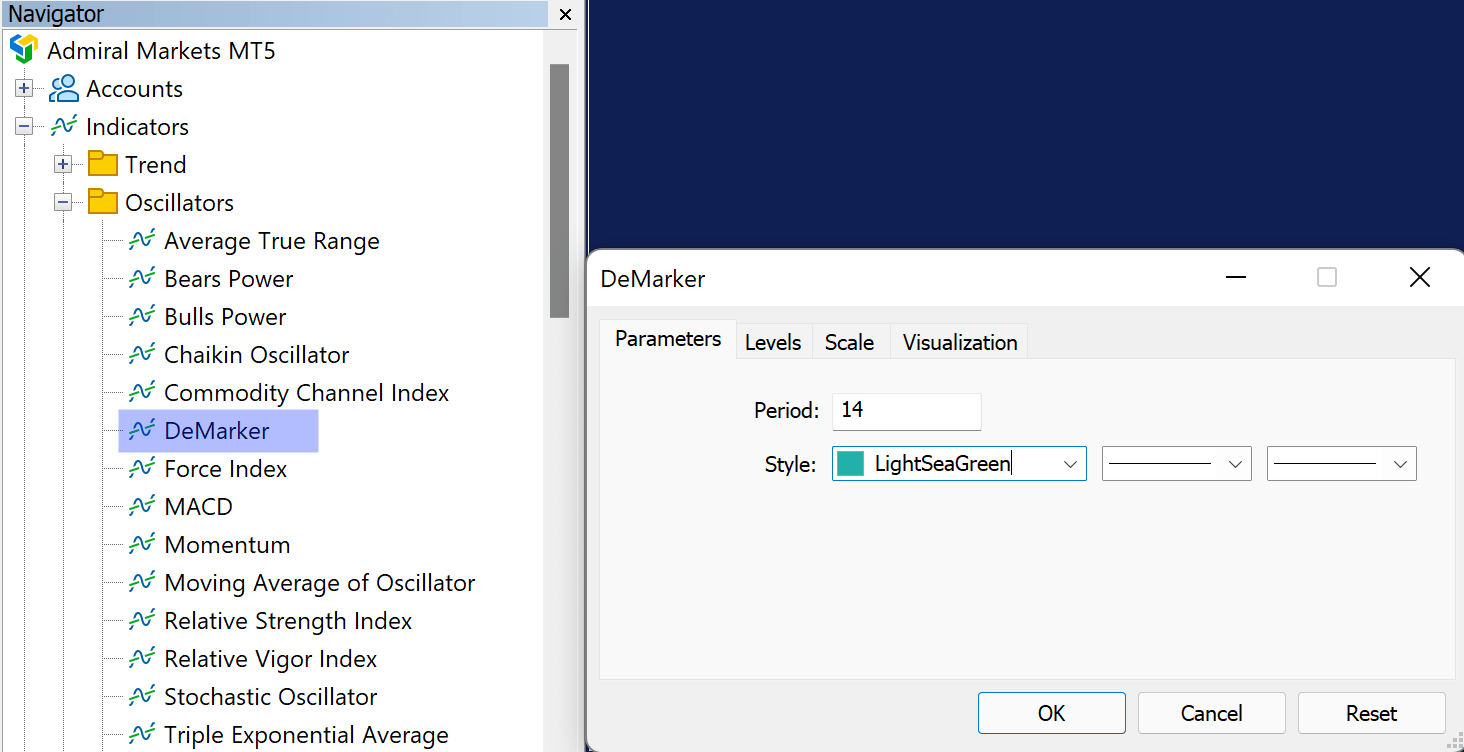
When you double-click on ‘DeMarker’, you are presented with the DeMarker Indicator setting window (as shown above). The key parameter value that you can set is the 'Period', which has a default value of 14 in both MT4 and MT5. In the image below, the DeMarker oscillator has been added to an hourly GBP/USD chart:

DeMarker Indicator Strategy
This DeMarker strategy seeks reversals in the price within a confirmed trend. Though the indicator marks overbought and oversold regions, these are not in themselves enough to predict a reversal.
Generally speaking, overbought and oversold simply mean unusually high and low prices judged by the sample data included in the look-back period. Rather than predicting a reversal, moving into these regions may in fact be a sign of the overall trend.
'Strongly overbought' tells us that there is buying pressure. 'Strongly oversold' tells us that there is selling pressure. So, how do we use the overbought and oversold indicators to help us better understand what is going on in the market?
First of all, traders need to look at how long the market remains in overbought or oversold regions, in order to make a judgement call on whether the market is merely ranging, in a mild trend or a strong trend.
The amount of time that the market spends in overbought or oversold territory provides insights as to whether the market is in a trend or not. If a market remains for an extended period in extreme overbought levels, it confirms that the market is in an uptrend, for example.
If a market stays at slight overbought levels — say, above 0.5, but below 0.7 — for an extended period, it suggests a modest uptrend. With the default value of 14 periods, one might say that levels above 0.7 are indicative of the market being in extreme overbought territory, and below 0.3 indicates that it is in extreme oversold territory.
As long as the DeMarker oscillator remains in these areas, traders should be wary in terms of taking a position. Ideally, traders should aim to buy into temporary drops in the price within an overall uptrend, or to sell into temporary spikes within an overall downtrend.
One way traders can identify these kinds of opportunities is by looking for the indicator to move out of extreme overbought or oversold regions. Take a look at the daily GBP/USD chart below:

The green dotted line on the main price chart is a 14-day SMA. This is to help us get a handle on the overall trend. When the price is below the SMA, it suggests a downtrend. When the price is above the line, it suggests an uptrend. The orange vertical lines show some circumstances when the DeMarker indicator has moved back out of extreme oversold or overbought regions.
As soon as the indicator rises above 0.3, traders can consider buying the market, provided that they can get in below 0.5. Bear in mind that you are looking for temporary reversals, and you need to move swiftly to take profit. A target level might be the next point the indicator breaks above 0.6 in such a circumstance.
DeMarker Indicator Setting
The larger the number of periods you use, the smoother the curve of the DeMarker Indicator. The smaller the number of periods, the more responsive the curve. For smaller periods, which give sharper oscillations, you might want to consider a higher boundary for overbought, and a lower boundary for oversold.
Similarly, with larger periods that yield shallower oscillations, you might want to consider a lower boundary for overbought, and a higher one for oversold.
Though the DeMarker indicator provides us with some useful information about a market, it's worth considering supplementary information from a secondary indicator to check what you're seeing. For example, as in our DeMarker Indicator strategy above, you might want to use a trend-confirming indicator, such as a moving average, to double-check the state of the market. Indicators don't always look at the same information, and different indicators can provide a different perspective of the same market data.
Naturally, the wider the selection available to you, the better choice of indicator you can make. Though MetaTrader 4 and MetaTrader 5 already come with a decent choice of standard indicators, you can easily provide yourself with a wider suite of tools by downloading MetaTrader Supreme Edition. MTSE is a custom plugin for MT4 and MT5, developed exclusively for Admirals by industry experts, that offers a cutting-edge selection of trading features.
Final Thoughts
As we have seen, the DeMarker Indicator is a momentum oscillator with more than one trick up its sleeve. You can use the indicator to confirm if a market is in a trending or non-trending state. If you have identified a trending market, the indicator will confirm the overall directional bias.
Most usefully of all, the indicator also gives us values for buying and selling pressure. With the help of these indications, traders can use the Forex DeMarker oscillator to signpost potential temporary reversals within a price trend.
Trade on a Risk-Free Demo Trading Account
Rather than taking the above information and heading straight to the live markets, it is better to take a more patient approach and determine what works best for you. This means experimentation using a risk-free demo account to practise your DeMarker strategy without risking your capital, which is something clients of Admirals can do for free! Click the banner below to open your FREE demo trading account today!
Other articles you may find interesting:
- Center of Gravity Indicator, Explained
- Various Applications of the ZigZag Indicator
- Heiken Ashi: How to Use the Heiken Ashi Formula
About Admirals
Admirals is a multi-award winning, globally regulated Forex and CFD broker, offering trading on over 8,000 financial instruments via the world's most popular trading platforms: MetaTrader 4 and MetaTrader 5. Start trading today!
This material does not contain and should not be construed as containing investment advice, investment recommendations, an offer of or solicitation for any transactions in financial instruments. Please note that such trading analysis is not a reliable indicator for any current or future performance, as circumstances may change over time. Before making any investment decisions, you should seek advice from independent financial advisors to ensure you understand the risks.