Accumulation Distribution Indicator Trading Guide
In this article, we will be taking a look at the Accumulation Distribution indicator, also referred to as the A/D indicator. As well as explaining what it is, we will examine how to use the Accumulation Distribution indicator in MetaTrader 4 (MT4) and MetaTrader 5 (MT5), how to apply what it tells us to an accumulation distribution strategy, and much more!

Table of Contents
What Is the Accumulation Distribution Indicator?
The Accumulation Distribution indicator is a volume indicator which, although originally designed for use on the stock market, has also found wider application as a leading indicator in other financial markets, including Forex.
The simplest way to answer the question “what is the Accumulation Distribution Indicator”, is to firstly look at what the words ‘accumulation’ and ‘distribution’ actually refer to.
In this context, ‘accumulation’ is referring to the act of buying, and ‘distribution’ to the act of selling.
The Accumulation Distribution technical indicator, therefore, assesses whether an asset is currently being accumulated or distributed in an attempt to convey possible future price movements. It does this by analysing both volume and price data, which we will look at in more detail in the following section.
The Accumulation Distribution Formula
As we covered in the previous section, the Accumulation Distribution oscillator attempts to display whether an asset is currently being accumulated or distributed. In order to achieve this, it assesses the flow of money into and out of the asset in question by looking at the trading range and the trading volume.
It should be noted here that, fortunately, traders need not concern themselves with actually calculating the Accumulation Distribution formula, as both MT4 and MT5 will take care of this for you instantly. However, in order to fully appreciate how to use the A/D indicator in your trading, it is beneficial to understand how it is calculated.
There are three steps involved in the Accumulation Distribution calculation, the first of which calculates the Close Location Value (CLV). The CLV compares the closing price for a given period with the trading range over that period. It will provide a value between -1 and 1, and is calculated as follows:
Once we have found the CLV, we need to establish the Money Flow, by multiplying the CLV by the volume. A negative money flow implies money is flowing out of an asset, whilst a positive money flow implies money is flowing in.
The Accumulation Distribution technical indicator is a cumulative measure, meaning that, when plotting the Accumulation Distribution line, the current value is derived from the previous value.
The first A/D value is equal to the Money Flow for that period. All subsequent values are the sum of the previous A/D value and the current Money Flow value:
Therefore, the Accumulation Distribution line consists of a running total of money flow into, and out of, an asset.
How to Use the Accumulation Distribution Indicator MT4 & MT5
In both MT4 and MT5, the Accumulation Distribution indicator can be found in the ‘Volumes’ folder within the ‘Indicators’ section of the ‘Navigator’ window, as shown below.
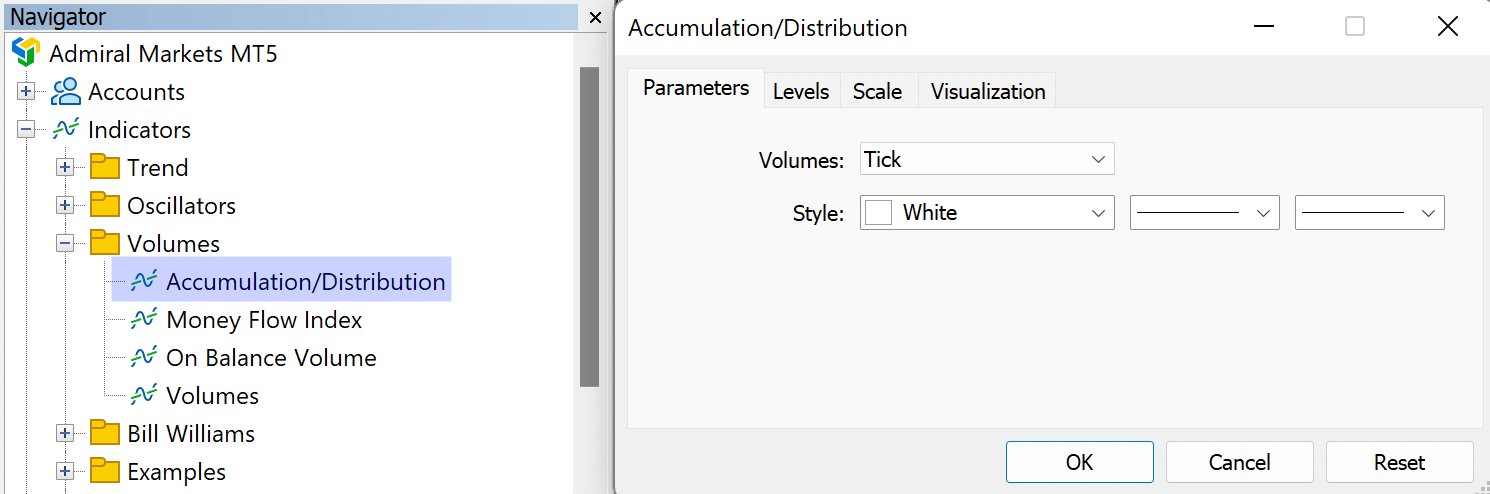
Adding the A/D indicator to your chart is straightforward. Simply drag it onto the chart from the Navigator window and, unlike most other indicators, there are no numerical parameters to fill out in the settings, just click ‘OK’ and the Accumulation Distribution line will appear under your chart.
Below is an hourly GBP/USD chart with the Accumulation Distribution indicator added

How to Read Accumulation Distribution Indicator
The A/D indicator provides us with a representation of an asset’s supply and demand. The direction in which the Accumulation Distribution line is moving tells us whether either buying pressure or selling pressure is more prevalent in the market.
If the Accumulation Distribution indicator is rising, it suggests that buyers are in the ascendancy. However, if the indicator is falling, it implies that sellers have taken the upper hand.
When the price and the Accumulation Distribution technical indicator are moving in the same direction, it suggests that the current trend will continue. However, perhaps more interesting are those times when the two are contradicting each other.
As with other indicators which attempt to measure the strength behind price moves, divergence is an important signal and can signify a potential reversal.
Accumulation Distribution Divergence
So, what exactly do we mean by accumulation distribution divergence?
If the price of an asset is falling, but the A/D indicator rises, a bullish divergence is taking place, indicating that the price may soon stop falling and start to rise. Conversely, if the price of an asset is rising, but the accumulation distribution line is falling, bearish divergence is taking place.
Take a look at the daily GBP/USD chart below, in particular the section between the two dotted red lines.

As we can see, during the period between the two lines, the price of GBP/USD is following an upward trend. For the most part, the Accumulation Distribution line is following the same trajectory; however, towards the end of the trend, the A/D indicator begins to fall, whilst the price continues to rise.
This is an example of bearish divergence, an indication that a reversal may be about to take place. In our example, this is indeed what happens, as, shortly after the divergence takes place, the price begins to fall for a number of sessions.
Improving Accumulation Distribution Technical Analysis
No indicator is correct all the time, and very few indicators are at their most effective when used on their own.
It is nearly always a good idea to use other technical indicators in conjunction with the Accumulation Distribution indicator, in order to enhance its effectiveness. For example, you might use a Pivot Point Indicator to check where nearby support and resistance levels might be.
Furthermore, effectively recognising those times of true divergence between price and the Accumulation Distribution oscillator requires both practise and patience. Using a secondary indicator can help you filter out any false signals in your Accumulation Distribution strategy, and better identify instances where a reversal is more likely to happen.
Final Thoughts
You should now be familiar with the Accumulation Distribution technical indicator, its calculation and how to use and read it.
One drawback of trading with the A/D indicator, which you may notice in practise, is that there is very often positive correlation between the Accumulation Distribution line and the price of an asset.
This means that, when looking for Accumulation Distribution divergence, you must remain patient for those infrequent instances when it takes place and when a change in trend may be about to occur.
Trade on a Risk-Free Demo Account
Before implementing an Accumulation Distribution strategy on the live markets, it is always a good idea to practise beforehand, and a risk-free demo account is the perfect place to do this! With a demo account, you can practise trading with virtual currency in real-market conditions, allowing you to become comfortable before making the transition to the live markets. Click the banner below your free demo account today:
About Admirals
Admirals is a multi-award winning, globally regulated Forex and CFD broker, offering trading on over 8,000 financial instruments via the world's most popular trading platforms: MetaTrader 4 and MetaTrader 5. Start trading today!
This material does not contain and should not be construed as containing investment advice, investment recommendations, an offer of or solicitation for any transactions in financial instruments. Please note that such trading analysis is not a reliable indicator for any current or future performance, as circumstances may change over time. Before making any investment decisions, you should seek advice from independent financial advisors to ensure you understand the risks.