How to Trade with the Moving Average Indicator
A moving average looks at an asset's price over a set number of periods, finds the average and recalculates that average as each new period takes place. The result is a smoothed line that filters out the day-to-day noise from price action, making the underlying trend easier to read.
The moving average is one of the most widely used technical indicators, which can be used by traders across different trading styles and timeframes. In this article, we look at what a moving average is, how it's calculated and how the indicator is used by traders.
The information in this article is provided for educational purposes only and does not constitute financial advice. Consult a financial advisor before making investment decisions.
Table of Contents
Key Takeaways
- A moving average smooths price data by calculating a continuously updating average over a set number of periods
- The two most widely used types are the simple moving average (SMA) and the exponential moving average (EMA), the latter of which weights recent prices more heavily
- Short-term moving averages (typically 5 to 20 periods) react quickly to price changes, whilst long-term moving averages (50 to 200 periods) filter out more noise to show broader trends
- Moving averages can help identify trend direction, function as dynamic support and resistance, and signal potential shifts through crossovers
What Is a Moving Average?
A moving average (MA) represents the average price of an asset over a specified number of periods, recalculated continuously as new price data comes in.
The "moving" part of the name comes from how the calculation works. Each time a new period closes, the oldest data point drops out from the calculation, and the newest one gets added. So, a 20-day moving average isn't a fixed number, it's a line that adjusts every day, always reflecting the most recent 20 days of price data available.
Price moves up and down constantly, and a lot of that movement tends to be short-term noise. Moving averages smooth this out, helping to provide a clearer view of the general direction in which price has been moving.
This smoothing effect means that moving averages can be particularly useful for trend-following approaches to trading. A rising moving average generally reflects an upward trend, whilst a falling one reflects a downward trend.
Types of Moving Average Indicator
There's more than one type of moving average. The two most common are the simple moving average and the exponential moving average, and each treats price data differently.
Simple Moving Average
A simple moving average (SMA) adds up the closing prices over a set number of periods and divides that total by the number of periods. Every price in the calculation carries equal weight, regardless of how recent it is.
Simple Moving Average Formula
SMA = (Sum of Closing Prices for n Periods) ÷ n
For example, let's say you want a 5-day SMA for a stock, and the last five closing prices were: $49.84, $49.77, $50.69, $51.23 and $50.55.
- Add the five closing prices together: $252.08
- Divide by the number of periods (5): $50.42
The following day, the oldest price ($49.84) drops out of the calculation, the latest closing price gets added, and the average is recalculated.
Exponential Moving Average
An exponential moving average (EMA) uses a similar principle but gives more weight to recent prices in the calculation. This means that the EMA reacts more quickly to new price data than the SMA, the downside of which is that it can make the EMA more vulnerable to short-term noise.
To calculate an EMA, the SMA is used as the starting point. Every subsequent value applies a smoothing multiplier to the new price, whilst weighting the previous EMA by the remainder, and adds the two together to arrive at the current value.
Exponential Moving Average Formula
EMA = (Current Closing Price × Multiplier) + (Previous EMA × [1 − Multiplier])
Where:
Multiplier = 2 ÷ (n + 1)
Weighted Moving Average
A weighted moving average (WMA) is a third variant of the moving average which, like the EMA, gives greater weighting to more recent prices.
However, the WMA applies weights that decrease in a straight line as prices get older, rather than the exponential method used by the EMA. It’s provided as an option on most trading platforms but is less commonly used than the SMA and the EMA.
Moving Average Indicator Settings
The main setting traders can adjust on a moving average indicator is the period over which the average is taken, where period refers to the number of candles on the chart.
So, a 20-period moving average on a daily chart would calculate the moving average over 20 days; on an hourly chart, it would calculate the moving average over 20 hours.
A shorter period reacts quickly to price but reflects less of the overall picture, whilst a longer period smooths out far more noise but takes longer to respond to shifts in direction.
Fast Moving Average
Short-term, or fast, moving averages typically use periods anywhere from 5 to 20. They track price closely, which can make them useful for gauging momentum and spotting emerging moves early.
However, they can generate more false signals during choppy or sideways price action, as they're sensitive enough to react to noise as well as genuine changes in trend.
Slow Moving Average
Long-term, or slow, moving averages typically use periods from 50 up to 200. These filter out far more short-term fluctuation, providing a clearer picture of the underlying trend.
Their limitation is essentially the opposite of a fast moving average. A long-term moving average is slower to reflect a genuine change in direction, since it's weighed down by a much larger range of historical data.
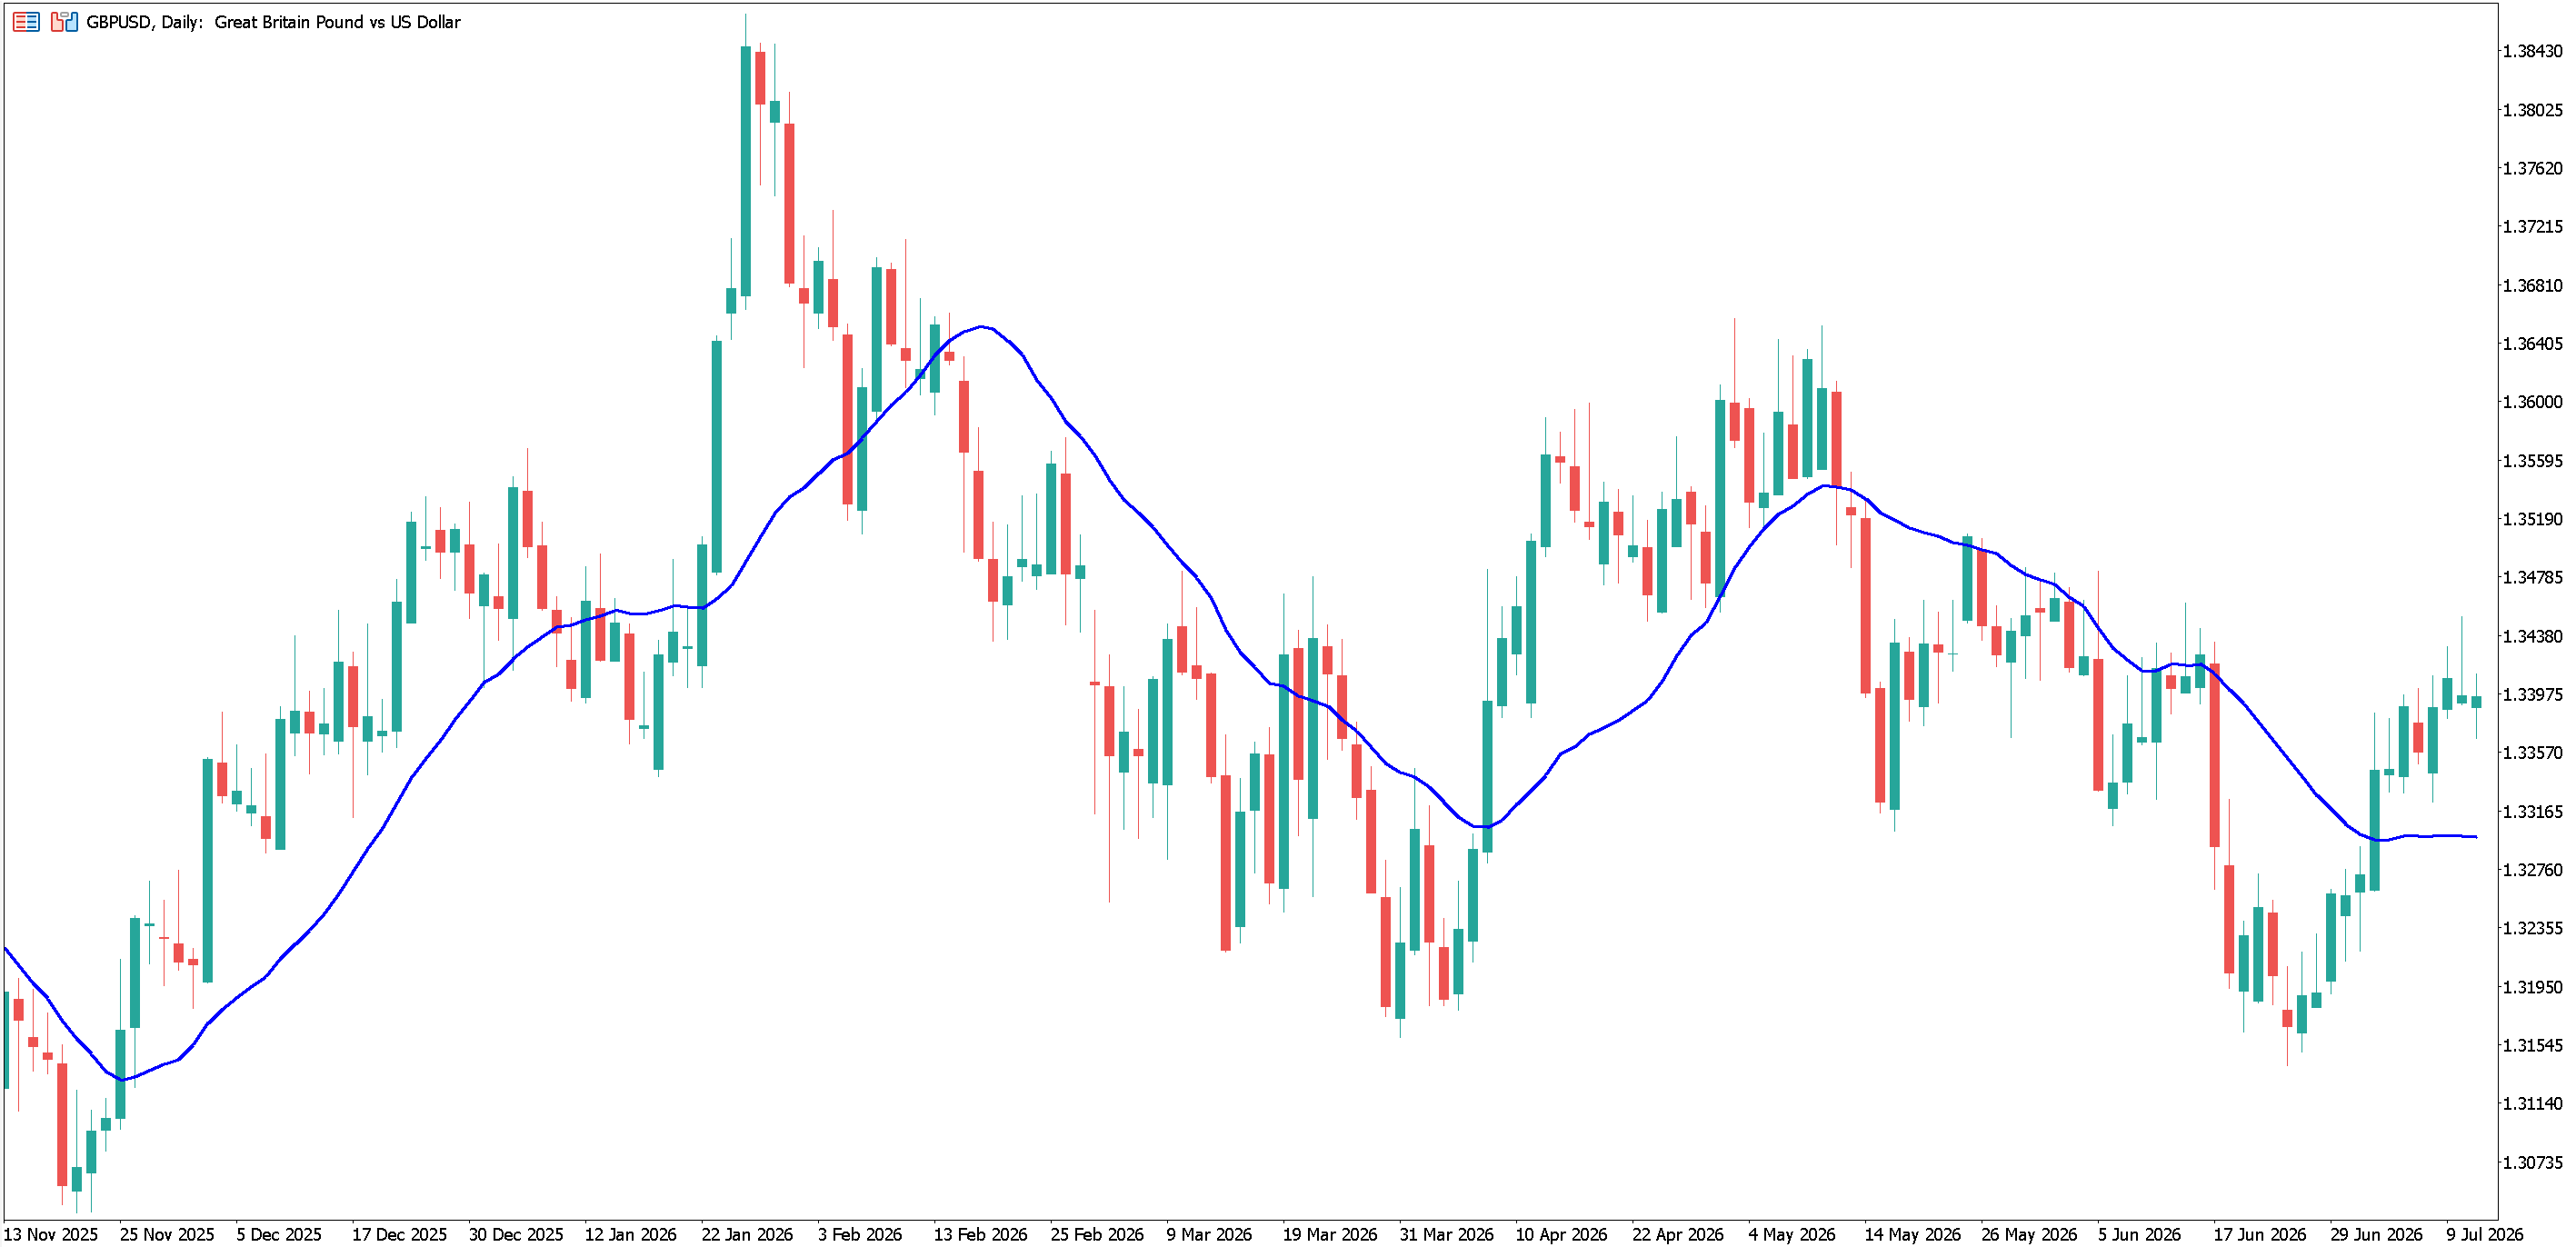
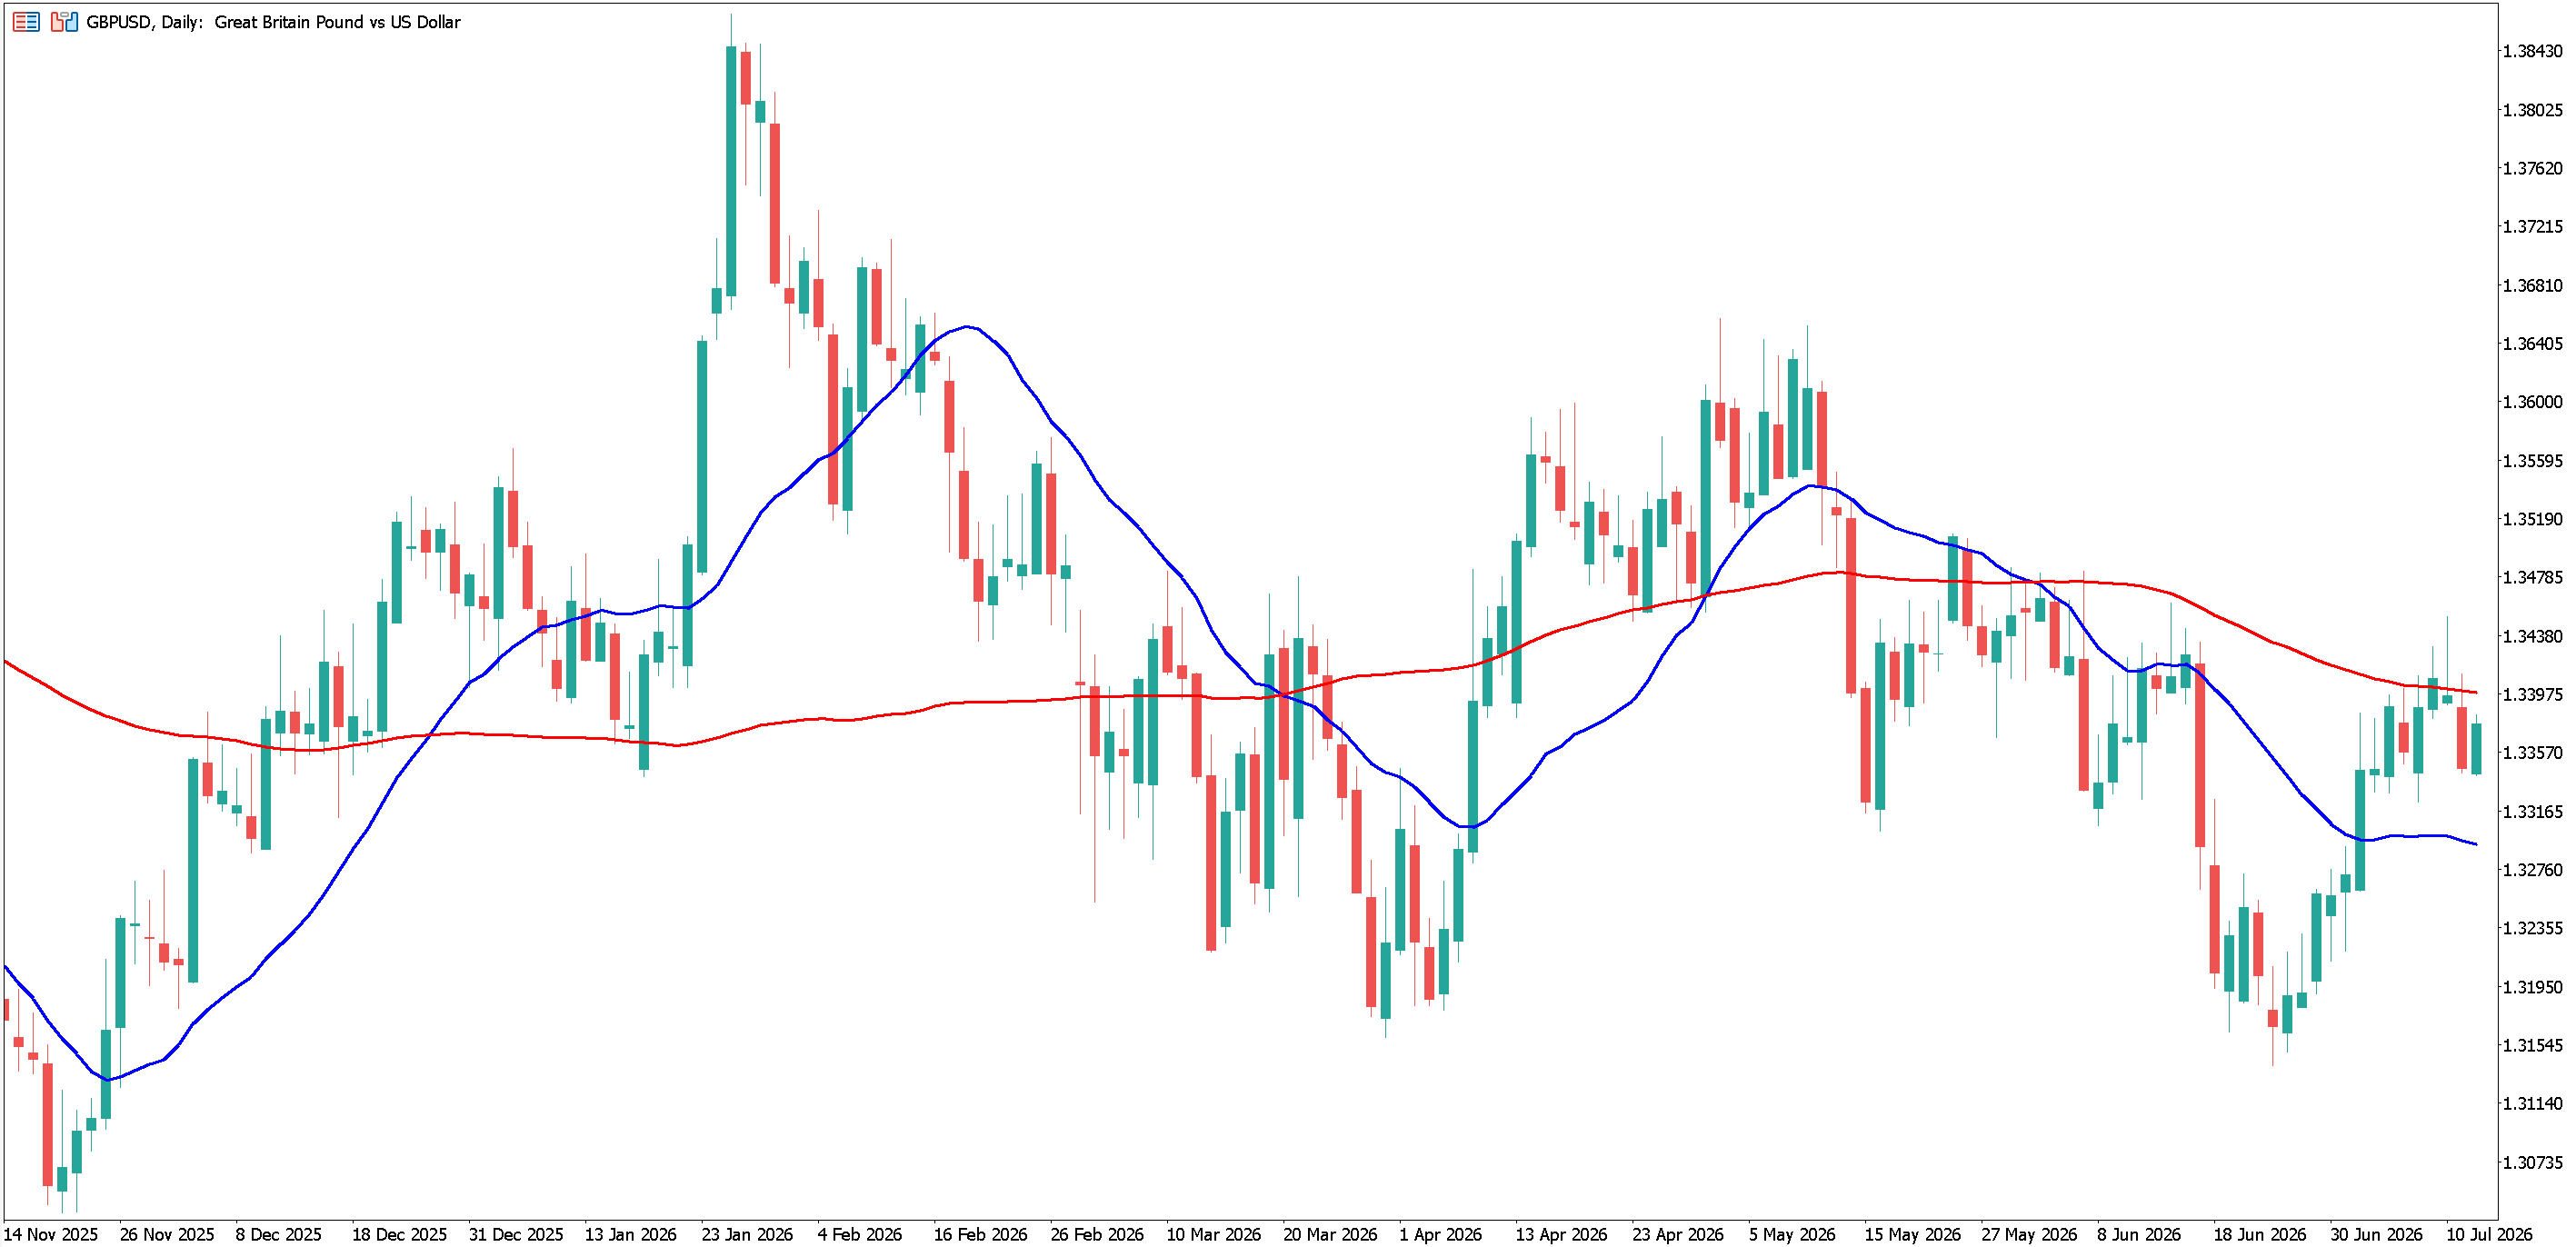
The daily chart of GBPUSD below has a 20-period SMA in blue and a 100-period SMA in red.
How to Use the Moving Average Indicator in Trading
Despite its simplicity, the moving average is a very versatile indicator, which can be used in a number of different ways. Three of its most common uses include:
- Reading trend direction
- Acting as dynamic support and resistance
- Identifying crossovers between two or more different moving averages
Identifying Trend Direction
The most basic application of a moving average is identifying where price currently is in relation to the indicator.
When price trades above a moving average, that's generally read as a sign the trend is pointing upward. Conversely, when price sits below it, that typically points to a downward trend.
Of course, the angle of the moving average itself provides more information. A moving average that's sloping upward reinforces an uptrend reading, whilst one sloping downward reinforces a downtrend. A moving average that's flattening out or moving sideways may signal that a trend is losing momentum, even before a reversal shows up in price itself.
Moving Averages as Dynamic Support and Resistance
Moving averages often behave as dynamic support and resistance levels. For example, in an uptrend, it’s common to see price pull back toward its moving average before continuing higher. Similarly, in a downtrend, the same phenomenon often happens in reverse, with price bouncing down off the moving average.
This tends to hold up more reliably whilst a market is clearly trending. During periods of consolidation, where price is moving sideways without a clear direction, a moving average is less likely to act as a meaningful support or resistance level.
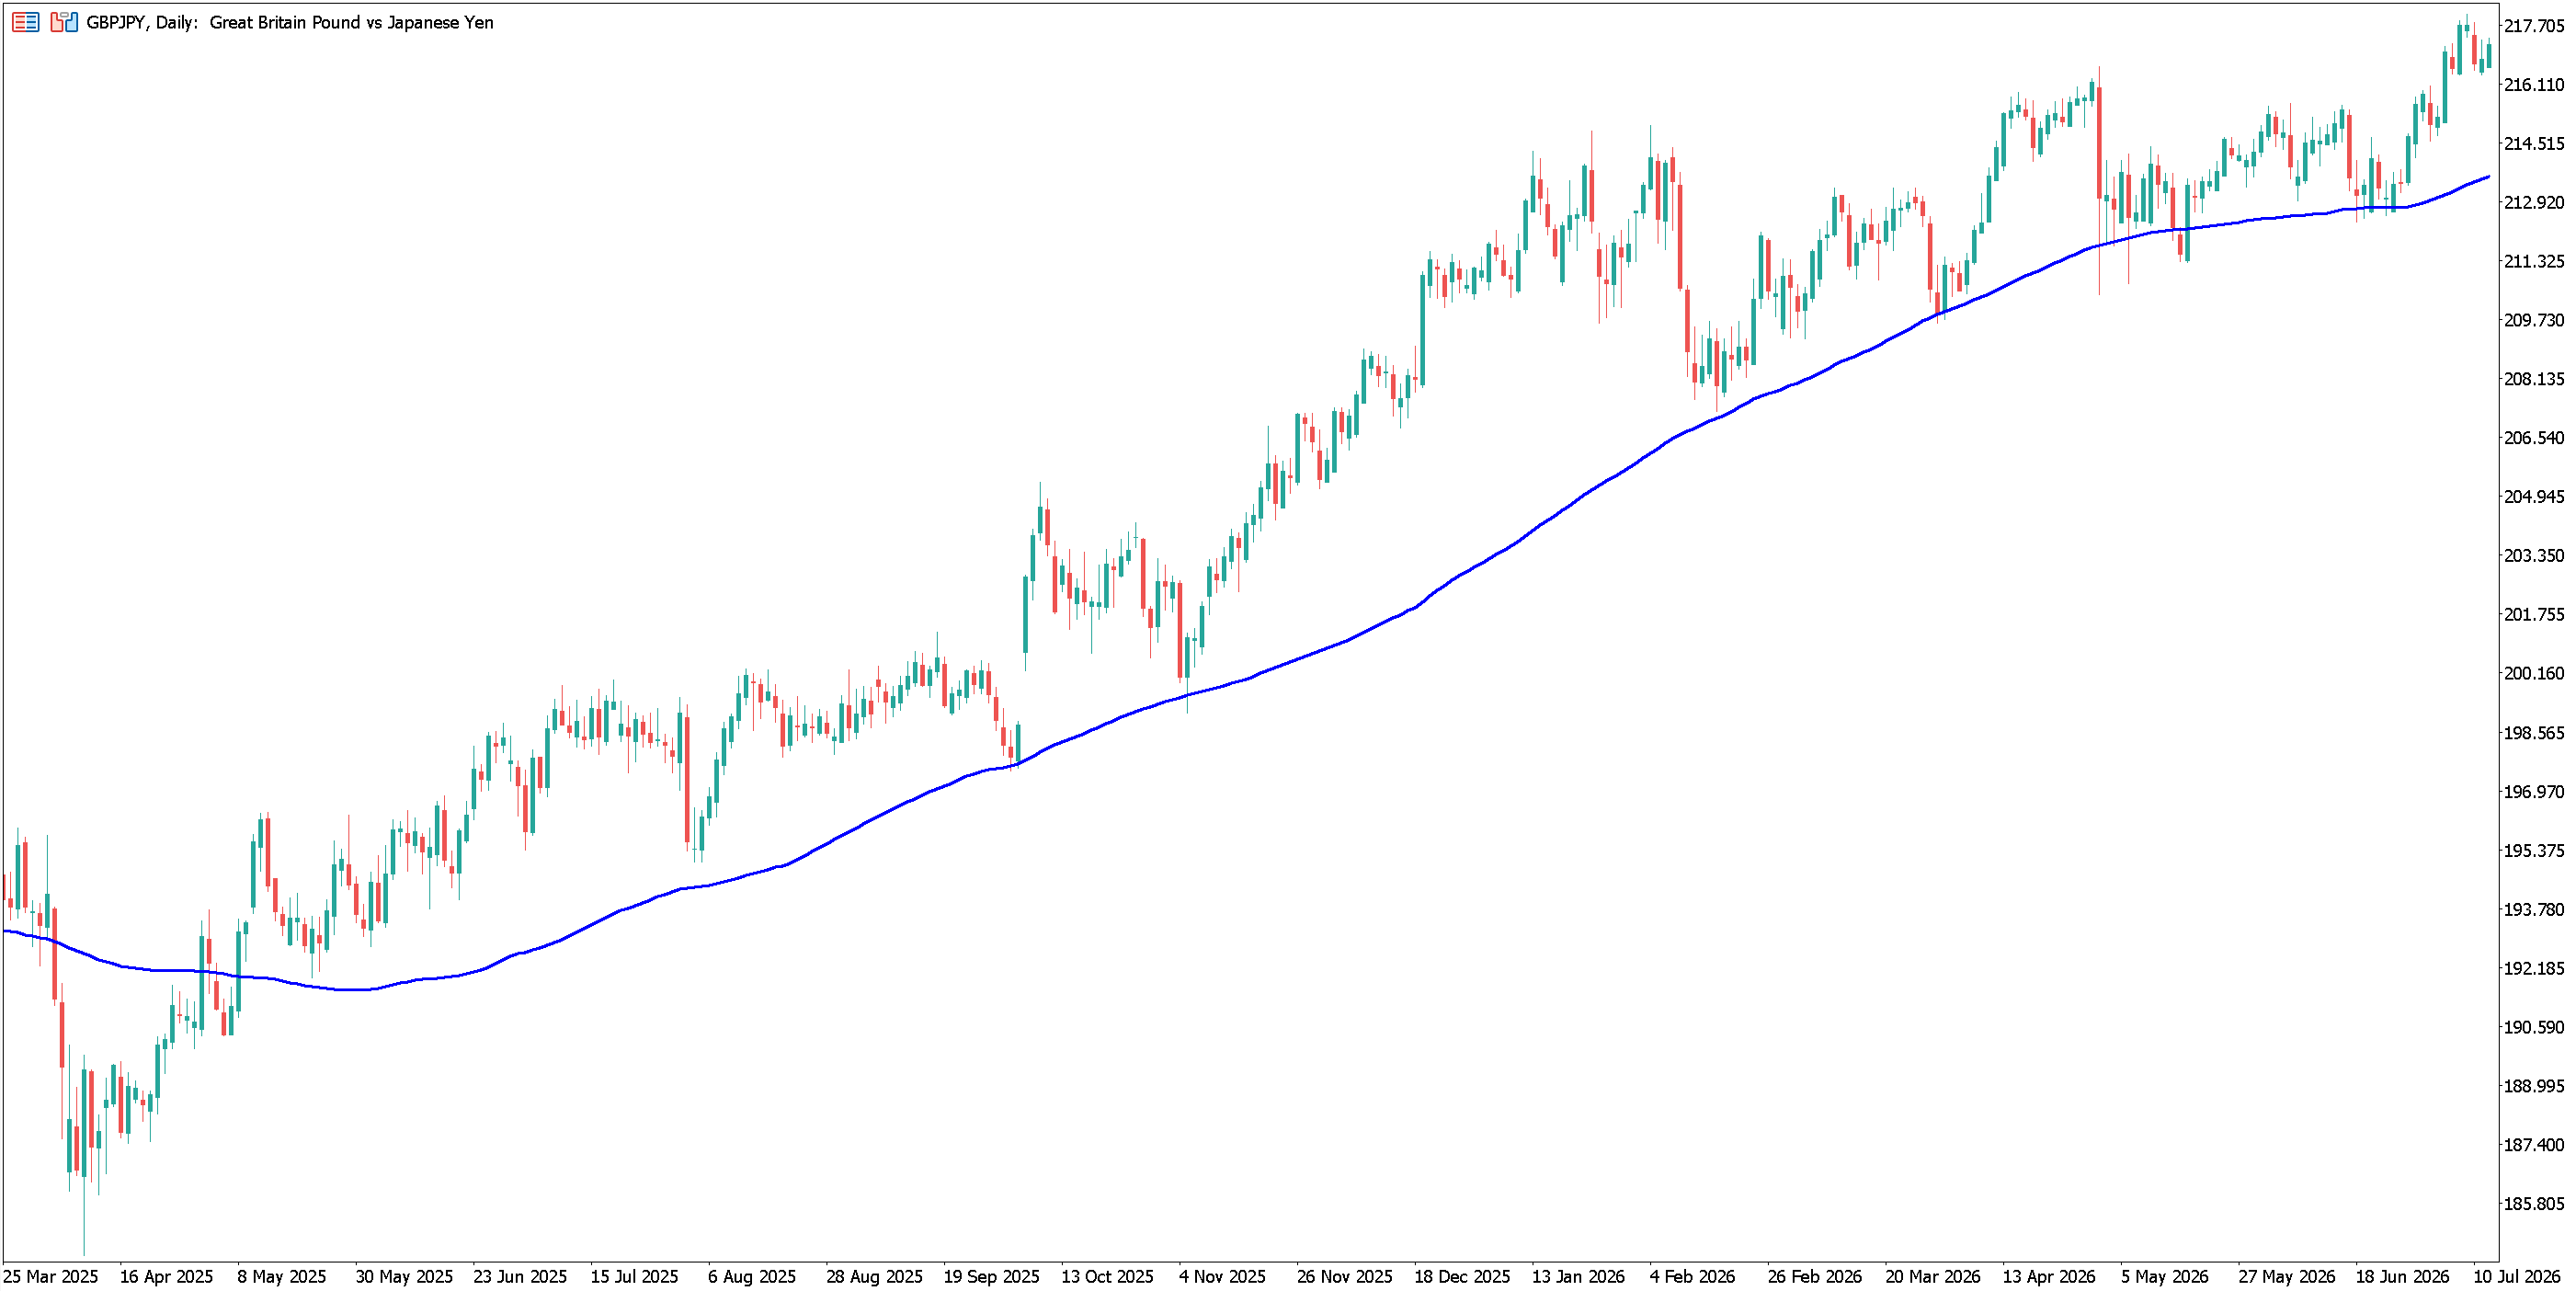
For example, take a look at the daily GBPJPY chart below, to which is added a 100-period moving average. The currency pair is following a clear uptrend during the period highlighted and, as price moves upwards, it appears to find support at its moving average on several occasions.
Moving Average Crossovers
A moving average crossover happens when two moving averages - one slow, one fast - cross over each other on the same chart. This is typically interpreted as a signal that momentum is shifting.
When the shorter of the two moving averages crosses above the longer moving average, this is read as a bullish signal, a sign that upward momentum may be building. On the other hand, when the shorter moving average crosses below the longer one, it’s seen as a bearish signal.
One of the most widely referenced versions of this moving average strategy is the crossover between a 50-period and a 200-period moving average. When the 50-period average crosses above the 200-period average, this is often referred to as a “golden cross”; the reverse, when it crosses below, is often called the “death cross”.
However, crossovers aren't limited to these two specific periods. Traders apply the same logic using other combinations of moving averages, sometimes even using more than two, and adjusting the periods to suit shorter or longer-term strategies.
As with any signal derived from moving averages, a crossover reflects data that's already happened, so it is typically used to confirm a shift in momentum rather than predict one. Furthermore, crossovers can occur more frequently in choppy or range-bound markets without a meaningful shift in momentum actually taking place.
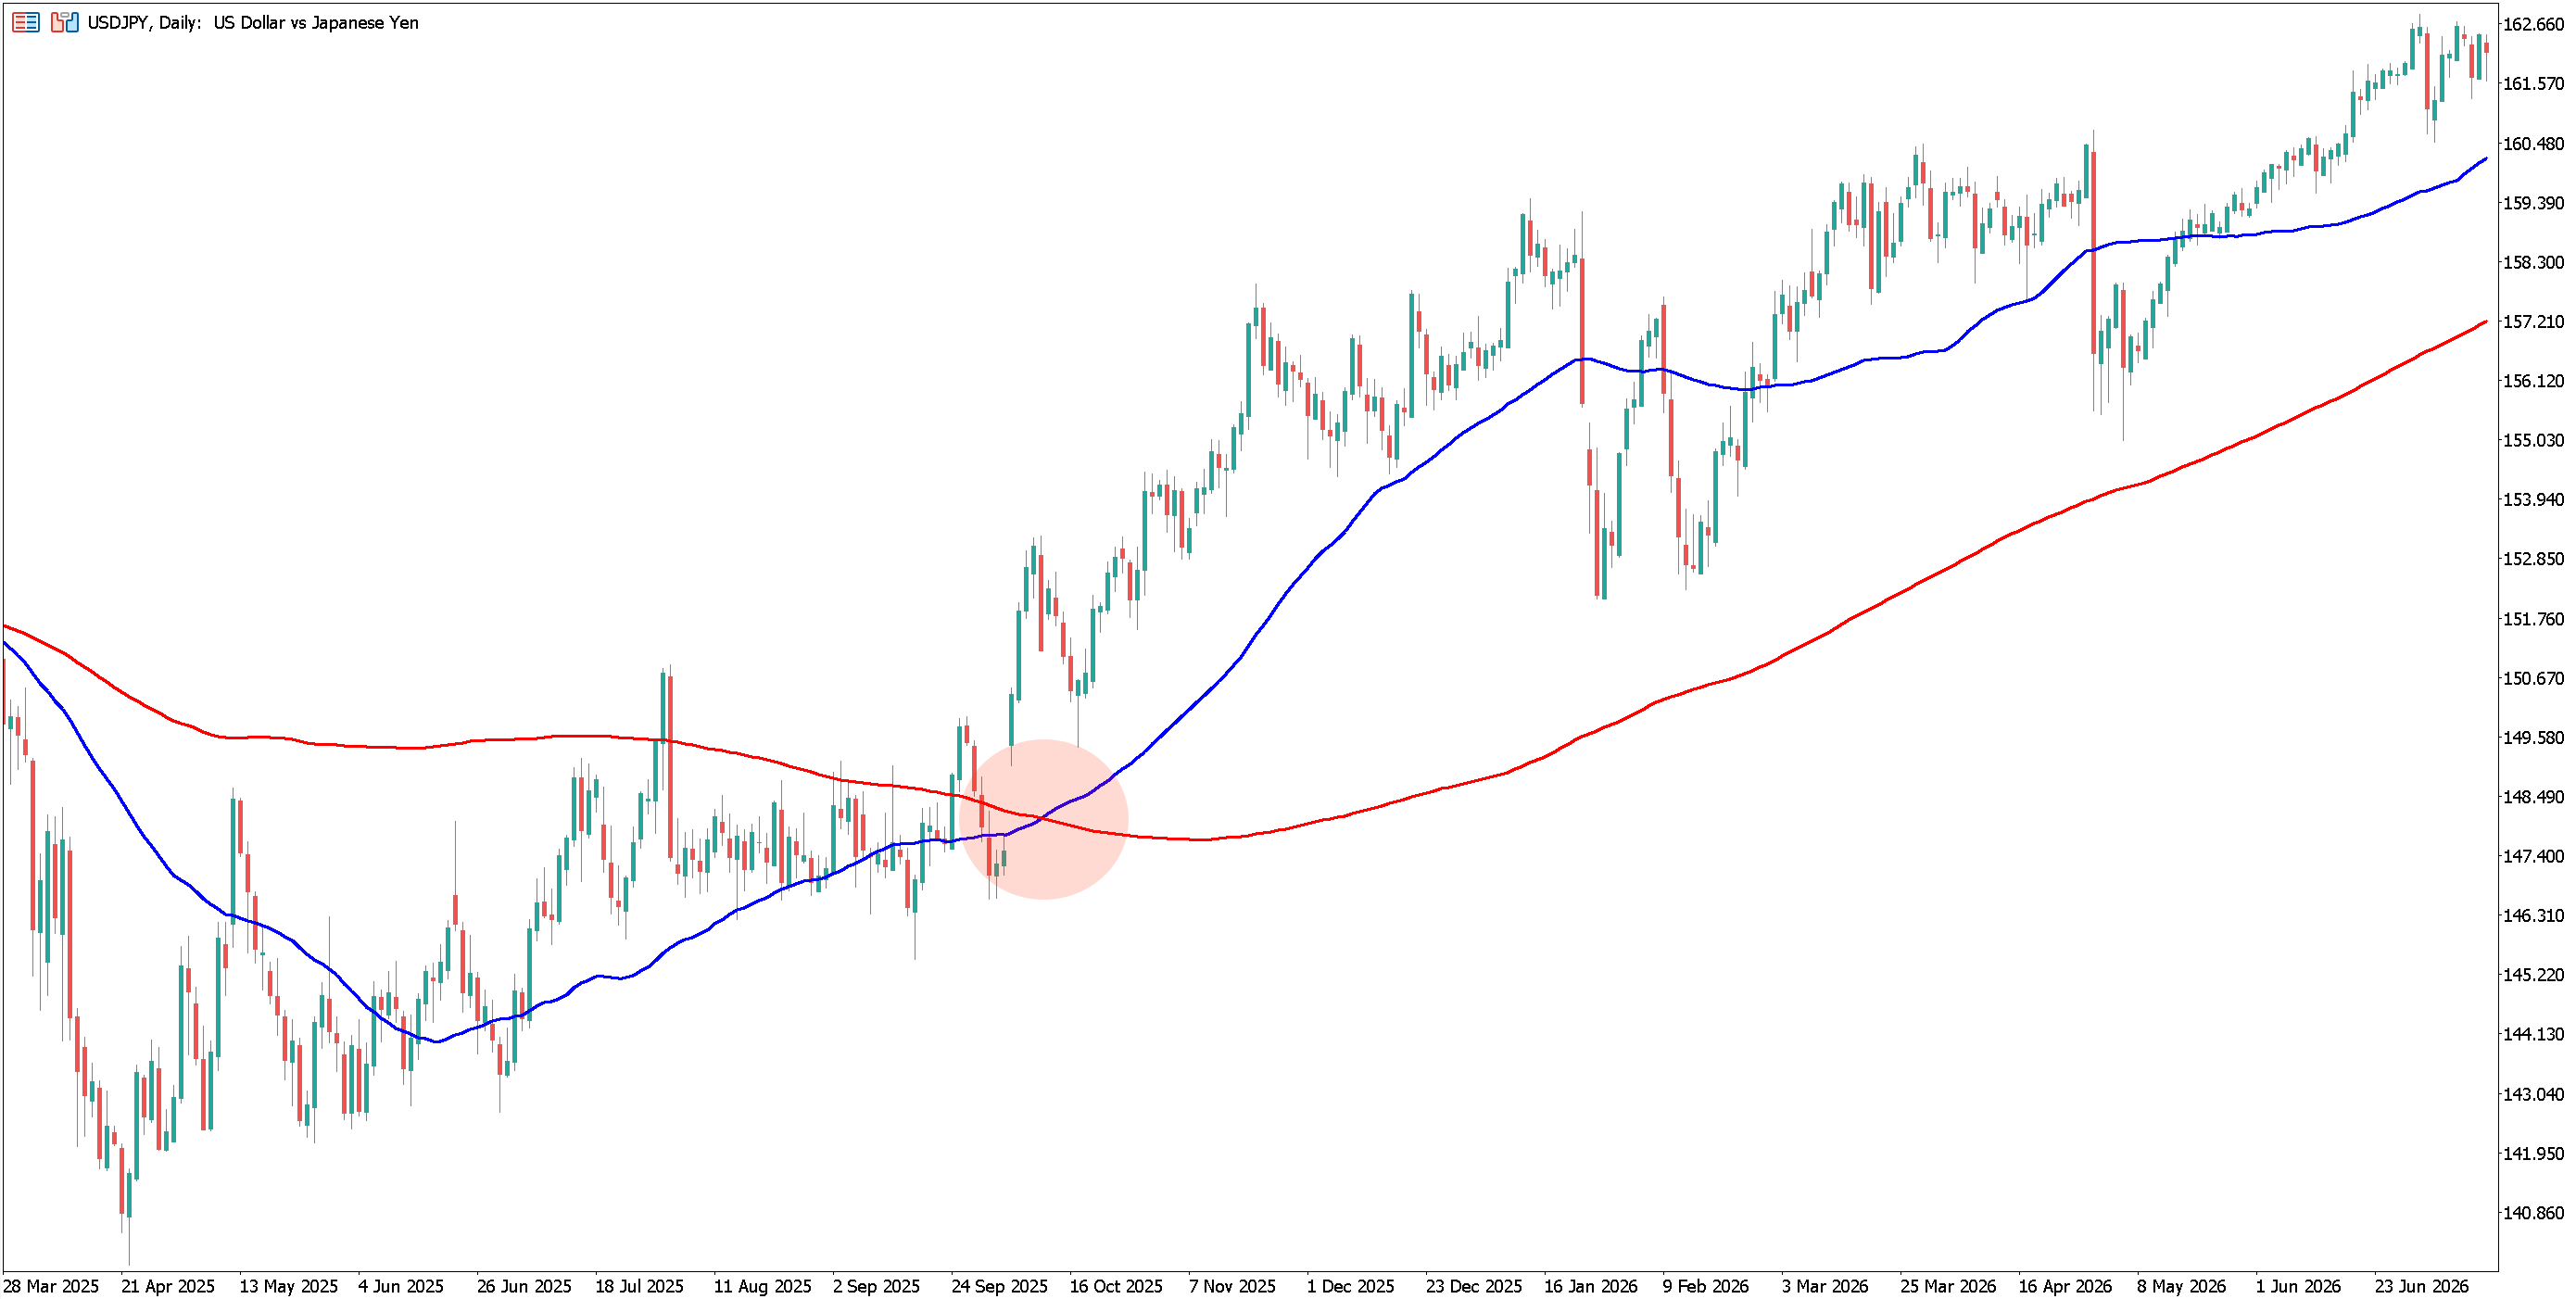
The daily chart of USDJPY below shows a blue, 50-period moving average crossing above a red, 200-period moving average.
Limitations of Moving Averages
The moving average indicator is both simple to understand and versatile. However, like any indicator, it also has its limitations:
- Moving averages are calculated using historical price data, meaning that they can only confirm a trend once it’s already started.
- Two moving averages of different time periods can show conflicting information on the same chart.
- Moving averages tend to work optimally in trending markets. In choppy or sideways moving markets, they can produce lots of false signals.
Frequently Asked Questions
How do you calculate a moving average?
The most common is the simple moving average, which adds up an asset’s closing prices over a set number of periods and divides that total by the number of periods used. As time moves forward, new periods are added and the oldest in the data set is removed. Other types of moving average, such as the exponential moving average, apply different weighting to recent prices during the calculation.
What is a good moving average setting for day trading?
Day trading tends to favour shorter periods, often between 5 and 20 periods, as these can react quickly enough to reflect intraday price swings. However, the right period will depend on the market in question and the strategy being implemented. Many traders choose to experiment with different settings on a demo account before transitioning to the live markets.
Which is better, SMA or EMA?
Neither is inherently better as they serve different purposes. An SMA weights all prices equally, meaning it can be more suited to spotting the wider trend. On the other hand, an EMA assigns a greater weighting to more recent prices, meaning it reacts more quickly to changes in price. Which is better comes down to whether a trader wants a moving average which is more responsive or one which is smoother.
Can moving averages be used together?
Yes, using two or more moving averages of different periods on the same chart is a common approach. This is the basis of moving average crossover strategies, in which a shorter-period moving average crossing a longer-period moving average is interpreted as a signal that momentum may be shifting.
Do moving averages work on all markets?
Moving averages can be applied to any market with historical price data, including Forex, stocks, commodities and indices. How reliably they behave as a trend or support/resistance indicator tends to depend more on how strongly a given market is trending at the time rather than on the asset class itself.
INFORMATION ABOUT ANALYTICAL MATERIALS:
The given data provides additional information regarding all analysis, estimates, prognosis, forecasts, market reviews, weekly outlooks or other similar assessments or information (hereinafter “Analysis”) published on the websites of Admirals investment firms operating under the Admirals trademark (hereinafter “Admirals”) Before making any investment decisions please pay close attention to the following:
- This is a marketing communication. The content is published for informative purposes only and is in no way to be construed as investment advice or recommendation. It has not been prepared in accordance with legal requirements designed to promote the independence of investment research, and that it is not subject to any prohibition on dealing ahead of the dissemination of investment research.
- Any investment decision is made by each client alone whereas Admirals shall not be responsible for any loss or damage arising from any such decision, whether or not based on the content.
- With view to protecting the interests of our clients and the objectivity of the Analysis, Admirals has established relevant internal procedures for prevention and management of conflicts of interest.
- The Analysis is prepared by an analyst (hereinafter “Author”), with the assistance of AI tools. The Author Roberto Rivero is a contractor for Admirals. This content is a marketing communication and does not constitute independent financial research.
- Whilst every reasonable effort is taken to ensure that all sources of the content are reliable and that all information is presented, as much as possible, in an understandable, timely, precise and complete manner, Admirals does not guarantee the accuracy or completeness of any information contained within the Analysis.
- Any kind of past or modelled performance of financial instruments indicated within the content should not be construed as an express or implied promise, guarantee or implication by Admirals for any future performance. The value of the financial instrument may both increase and decrease and the preservation of the asset value is not guaranteed.
- Leveraged products (including contracts for difference) are speculative in nature and may result in losses or profit. Before you start trading, please ensure that you fully understand the risks involved.