Price Action Trading: How to Understand Raw Market Movements
Every price chart tells a story long before you add a single indicator. Price is the foundation of that story, and every indicator is only a calculation drawn from it. This is where price action trading begins: reading the price directly, rather than waiting for a tool to interpret the market. In forex, the way the price moves shows how buyers and sellers are positioned in a currency pair, which is why many traders treat price action as the basis of their analysis.
In this guide, we’ll cover what price action trading is, how to read a forex chart, the key patterns, how to build a price action strategy, and how to manage risk.
The information in this article is provided for educational purposes only and does not constitute financial advice. Consult a financial advisor before making investment decisions.
.png)
Table of Contents
- What Is Price Action Trading?
- How Does Price Action Trading Work?
- How to Trade Price Action in Forex
- Price Action Trading Patterns
- Building a Price Action Trading Strategy
- Benefits and Risks of Price Action Trading
- The Bottom Line on Price Action Trading
- Frequently Asked Questions on Price Action Trading
What Is Price Action Trading?
How Does Price Action Trading Work?
Price action trading works by analysing raw price movements on a chart rather than relying primarily on indicators. Traders study market structure, support and resistance levels, candlestick signals and chart patterns to identify potential trading opportunities. The goal is to interpret buyer and seller behaviour directly from price movement and make decisions based on that information.
What Is Price Action in Forex Trading Specifically?
The idea behind what is price action in forex is the same as in any market, but currencies have features worth noting. Forex trades 24 hours a day across the Asian, London and New York sessions, and this affects how much weight a signal carries:
- Session timing matters: For example, a forex price action signal on GBPUSD during the London–New York overlap often carries more weight than one in quiet hours.
- Thin volume is less reliable: In quiet sessions, low volume can produce a move that does not hold.
How to Trade Price Action in Forex
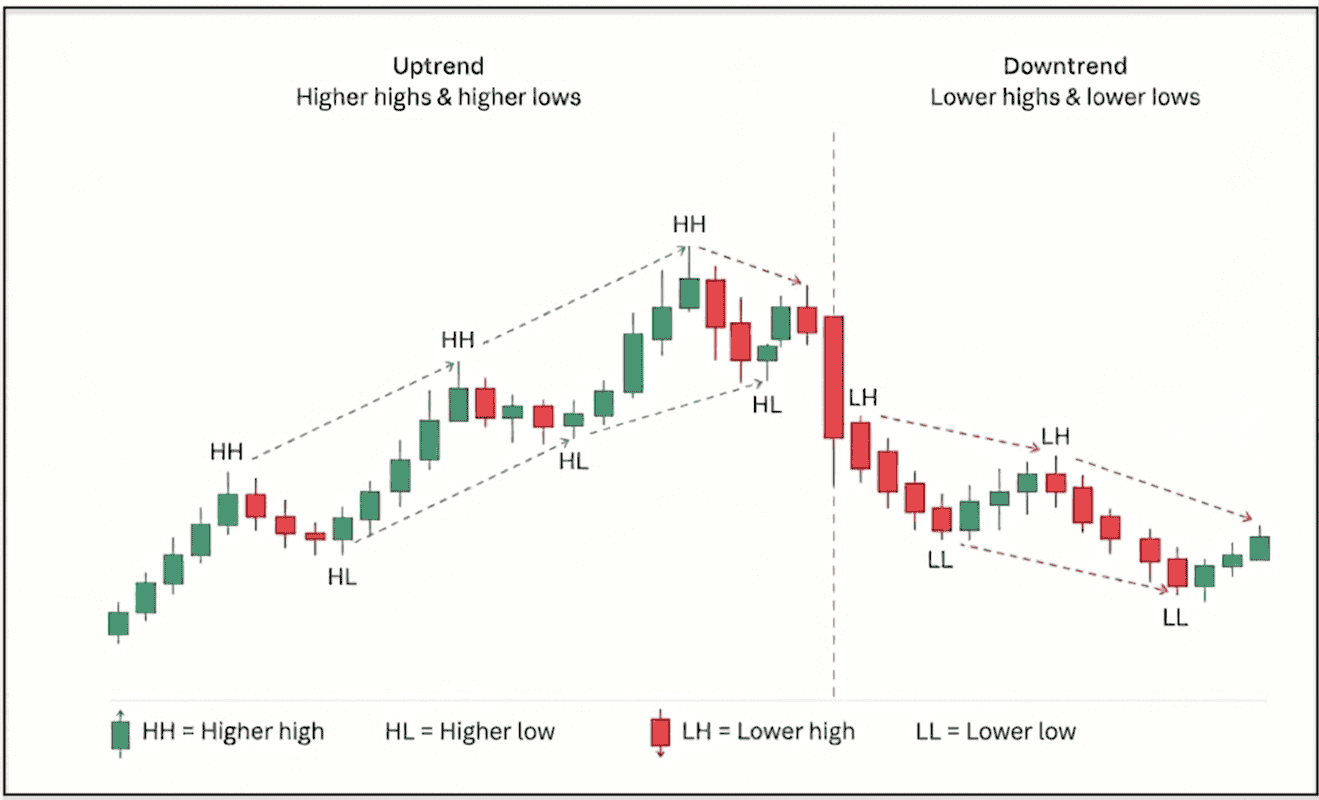
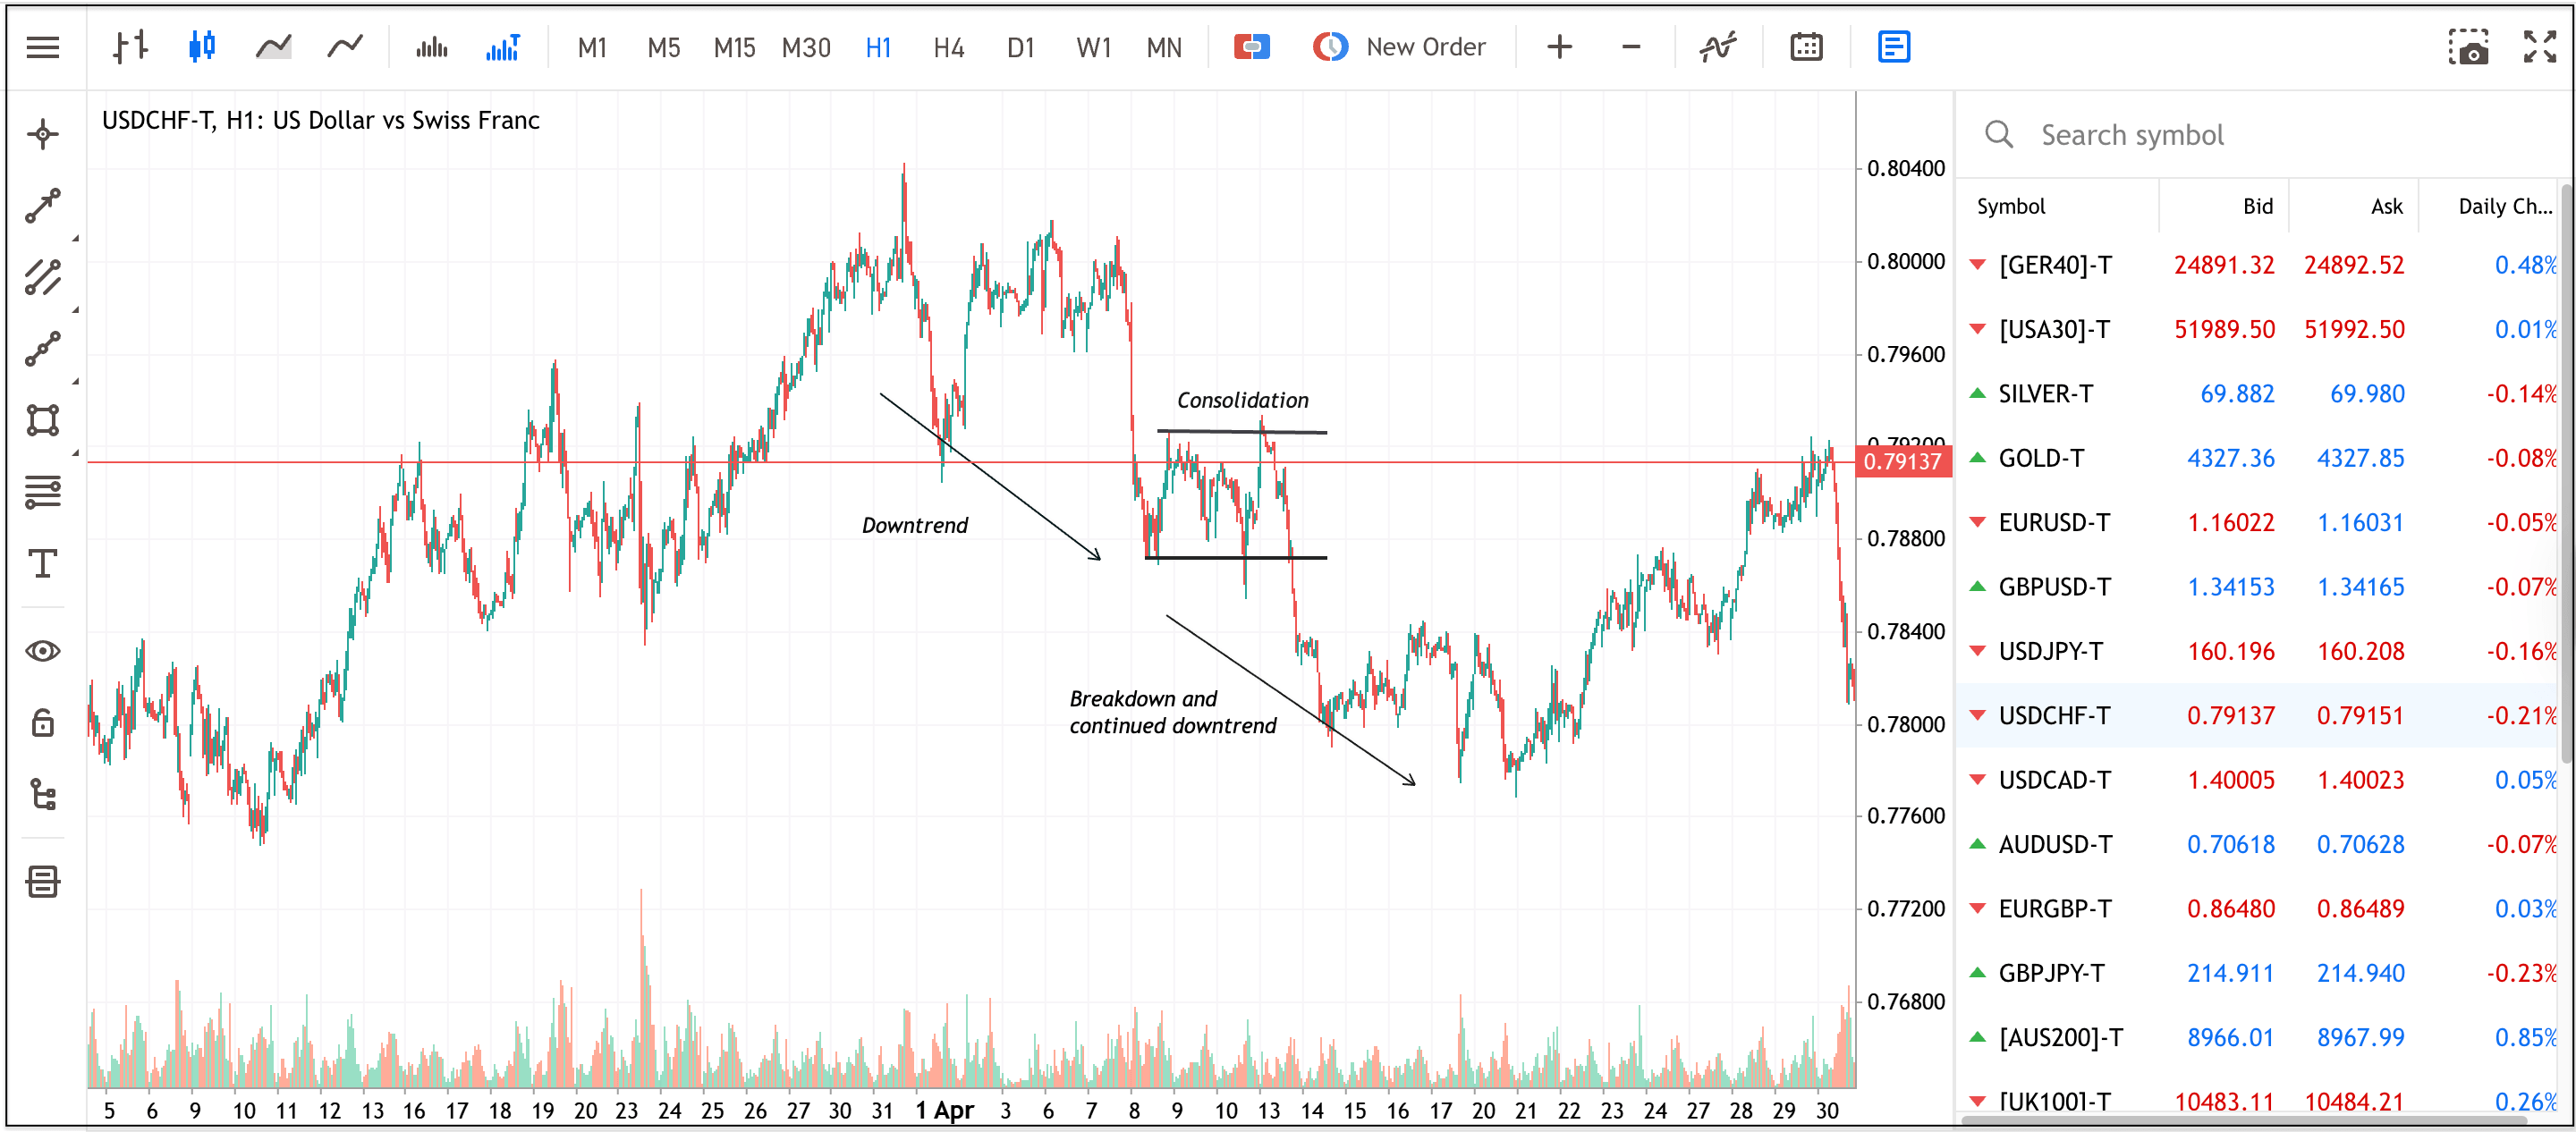
Price action starts with market structure. An uptrend is a series of higher highs and higher lows; a downtrend is a series of lower highs and lower lows. A large part of trading price action is spotting when that sequence breaks, as the chart below shows.
Price Action Trading Patterns
Most price action patterns forex traders watch fall into two groups: continuation patterns and reversal patterns.
_(1).png)
1. Continuation Patterns
Continuation patterns form during a trend and suggest it may resume after a brief pause, as the market rests before the dominant side regains control. Because the pause sits within an established trend, traders usually treat these price action candlestick patterns as a signal to trade with the trend rather than against it. Two are common in forex.
1. The Bullish Flag
The bullish flag forms after a sharp move higher, when price drifts lower in a narrow, flag-shaped channel, a shallow pullback that suggests sellers are weak and the uptrend may have further to run. Traders often wait for a break above the flag before entering, with a stop below its low; the same shape works in reverse as a bearish flag during a downtrend.
2. The Symmetrical Triangle
The symmetrical triangle forms as price makes lower highs and higher lows at once, coiling into a point as buyers and sellers reach a temporary balance. Within an existing trend, price may break out in the trend’s direction; traders typically wait for a clear candle close beyond the triangle.
2. Reversal Patterns
Reversal patterns form at the end of a trend and suggest that the current direction may be losing strength and could turn. They tend to carry more weight when they appear at a clear support or resistance level, where the trend is already meeting opposition. Because trading a reversal means trading against the prevailing move, these patterns generally call for more confirmation than continuation patterns, as a trend can pause and then continue rather than reverse.
Two examples are widely watched in forex.
1. The Double Top
The double top forms when price reaches a high, pulls back, then returns to a similar high but fails to break above it. Two failed attempts that suggest momentum is fading. It is usually considered confirmed only when price falls below the low between the peaks (the neckline), where traders may look for shorts with a stop above the second peak.
2. The Head and Shoulders
The head and shoulders pattern consists of three peaks, with the middle peak (the head) being higher than the two outer peaks (the shoulders). This formation typically signals that an existing uptrend is losing momentum and may be approaching a bearish reversal. It is generally confirmed when price breaks below the neckline drawn under the two intervening lows. An inverse head and shoulders points to a possible upward reversal in a downtrend.
Recommended read: Forex Chart Patterns: How to Spot Quality Trade Setups?
Building a Price Action Trading Strategy
A pattern on its own is not a strategy. Price action strategies are a repeatable process built around a pattern. It sets the conditions required before entering, where to enter, where to place the stop, and where to take potential profit.
Price Action Trading Strategy #1: The Flag Breakout Strategy
The flag breakout is a continuation strategy that aims to join an existing trend after a brief pause. It combines a flag pattern with indicator confirmation and is typically used in trending markets, not sideways conditions.
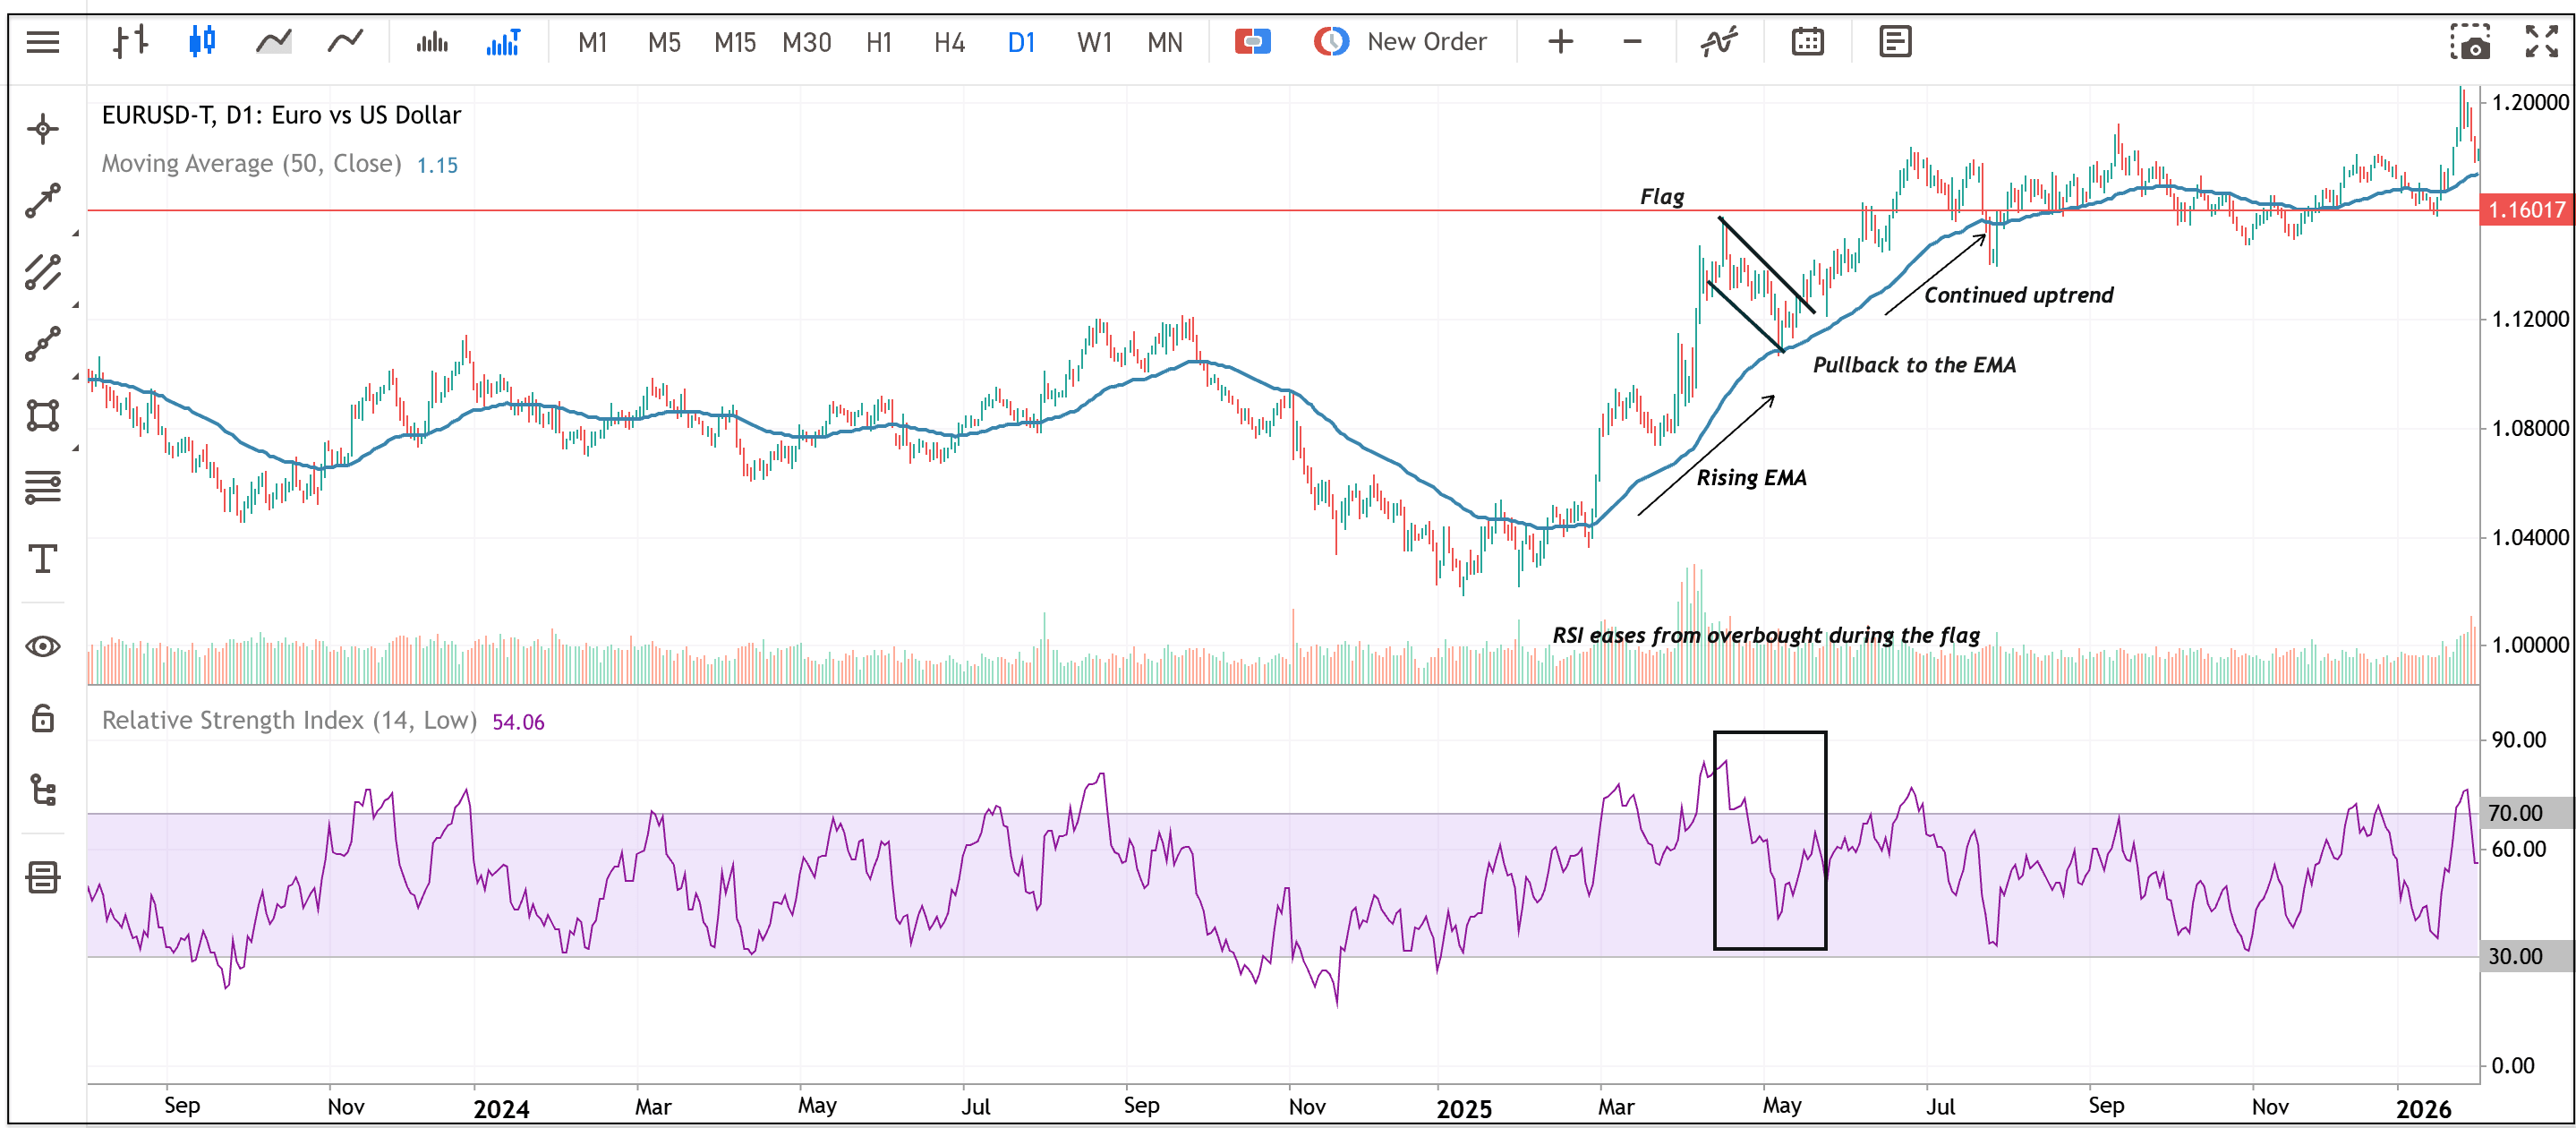
Although this example uses a flag, the same three-layer approach, trend, pattern, momentum, can be applied to other continuation patterns, such as a symmetrical triangle.
Price Action Trading Strategy #2: The Breakout from Consolidation
The second approach tends to suit traders looking to capture the release of energy after a period of consolidation, rather than a continuing trend. Markets often move between periods of expansion and contraction. After a strong move, price may form a tight range or an inside bar as participants wait for the next catalyst.
Recommended read: 5 Top Forex Trading Strategies Explained
Benefits and Risks of Price Action Trading
The Bottom Line on Price Action Trading
Price action trading comes down to reading the market directly – following structure, respecting support and resistance, and acting on signals only when they align with the broader context. The patterns and strategies covered here, from flags and triangles to double tops and head-and-shoulders, tend to carry more weight when paired with disciplined risk management and a clear trade plan, and the same principles can be applied across different currency pairs and timeframes. None of this removes risk, so traders often build the skill gradually over time.
With Admirals, you can study price action on demo forex charts in MetaTrader 5, draw your own support and resistance, and mark inside bars and other patterns before committing any capital.
Frequently Asked Questions on Price Action Trading
Is price action trading suitable for beginners?
Yes. Price action trading is often considered beginner-friendly because it focuses on reading price movements directly from a chart without requiring multiple indicators.
Do price action traders use any indicators at all?
Some traders use no price action indicator at all. Others keep one or two, such as moving average for trend direction or an RSI for added context. Price tends to come first and any indicator remains secondary.
What are the most common price action signals?
The most common price action signals include the pin bar, the engulfing candle and the inside bar, typically read at a support or resistance level and in the context of the broader trend. They indicate probability, not certainty.
Does price action trading work on all timeframes?
Yes. Price action trading can be applied to all timeframes, from short-term intraday charts to longer-term daily and weekly charts.
INFORMATION ABOUT ANALYTICAL MATERIALS:
- The given data provides additional information regarding all analysis, estimates, prognosis, forecasts, market reviews, weekly outlooks or other similar assessments or information (hereinafter “Analysis”) published on the websites of Admirals investment firms operating under the Admirals trademark (hereinafter “Admirals”) Before making any investment decisions please pay close attention to the following:
- This is a marketing communication. The content is published for informative purposes only and is in no way to be construed as investment advice or recommendation. It has not been prepared in accordance with legal requirements designed to promote the independence of investment research, and that it is not subject to any prohibition on dealing ahead of the dissemination of investment research.
-
Any investment decision is made by each client alone whereas Admirals shall not be responsible for any loss or damage arising from any such decision, whether or not based on the content.
With view to protecting the interests of our clients and the objectivity of the Analysis, Admirals has established relevant internal procedures for prevention and management of conflicts of interest. - The Analysis is prepared by an analyst (hereinafter “Author”) with the assistance of AI tools. The Author Amrita Kundu is a contractor for Admirals. This content is a marketing communication and does not constitute independent financial research.
- Whilst every reasonable effort is taken to ensure that all sources of the content are reliable and that all information is presented, as much as possible, in an understandable, timely, precise and complete manner, Admirals does not guarantee the accuracy or completeness of any information contained within the Analysis.
- Any kind of past or modelled performance of financial instruments indicated within the content should not be construed as an express or implied promise, guarantee or implication by Admirals for any future performance. The value of the financial instrument may both increase and decrease and the preservation of the asset value is not guaranteed.
- Leveraged products (including contracts for difference) are speculative in nature and may result in losses or profit. Before you start trading, please ensure that you fully understand the risks involved.