Top 3 Trend Trading Strategies
Trend trading strategies are probably the most popular strategy style among traders and investors. In fact, many fund managers choose to employ this type of method for its ability to provide high reward to risk ratio trading opportunities. Let's have a look at them in more detail.
Table of Contents
What are Trend Trading Strategies
Trend trading is the process of analysing the directional momentum of a market and finding a way to participate in the move. The key to the strategy is the fact that once a market starts to move in a certain direction, other market participants will also join in. This is known as 'herd mentality.'
Trends can develop in any time frame with traders using short-term trend trading strategies and investors using longer-term trend strategies. Most trend traders will have a longer holding period based on the time frame they are using as the key is to try and capitalise on the majority of the trend. Other traders such as momentum traders will typically trade in and out of a trend, rather than have one position to capitalise on the whole trend.
Different Types of Trend Trading Strategies
There are three main types of trend trading strategies.
- Long-term trend trading
- Short-term trend trading
- Day trading
You will typically find more long-term trend trading strategies employed in the stock market. This is because the aim of a publicly traded company is to try and grow the share price for its shareholders. It is also the asset class of choice for long-term pension and mutual fund managers.
There are traders that will trade short-term trends on the stock market and other asset classes such as forex, indices and commodities. These trend traders are typically known as swing traders who aim to identify and trade the swings that develop in a market but in line with the overall trend.
Finally, there are day traders. These are very short-term trends that try to identify intra-day trends that last for several minutes to hours. Day traders operate on multiple asset classes as they are only looking to trade very short-term movements in price.

Long-Term Trend Trading Strategies
Long-term trend traders typically trade on higher timeframes such as the monthly, weekly and daily charts. When using trend strategies on higher time frames, many traders will look towards the stock market. This is because if a publicly traded company is successful it will attract more people towards owning its stock, thereby providing the potential for a long-term trend following the chart.
For example, the monthly chart below of Apple's share price shows a strong long-term trend over many years.
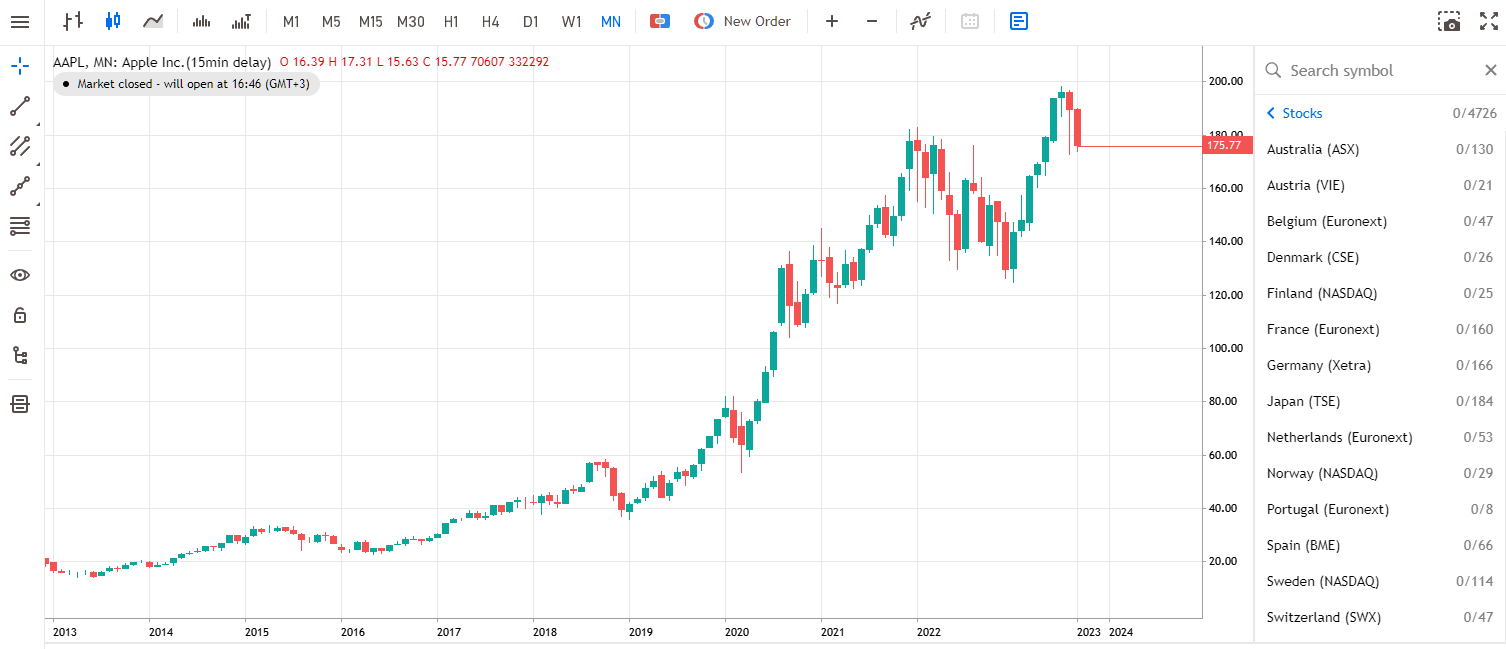
Long-term trend trading was popularised by hedge fund managers in the 70s who would use global macro trading strategies to participate in a long-term trend. The idea is to find a macroeconomic theme that could be a driving force behind a long-term, sustainable trend in a particular market and then build positions to capitalise on this movement. While some hedge fund managers did well from this, many others did not.
Day Trading Strategies
Day trading trend-following strategies are popular among day traders who look to profit from lower time frames such as 1 minute, 5 minute, 15 minute and 30 minute charts. In this type of style, traders would aim to find markets that are likely to trend throughout the day but capitalise on the cycles that typically develop on the lower time frames during such conditions.
A popular indicator used to find such conditions is moving averages. This type of indicator helps traders quickly identify the trend of a market by viewing its average price over different time periods. For example, a 5-period exponential moving average will show traders the average price over the last five periods, or bars on the chart. Day trading trend-following traders will often use multiple moving averages showing the average trend over different periods, as shown below:
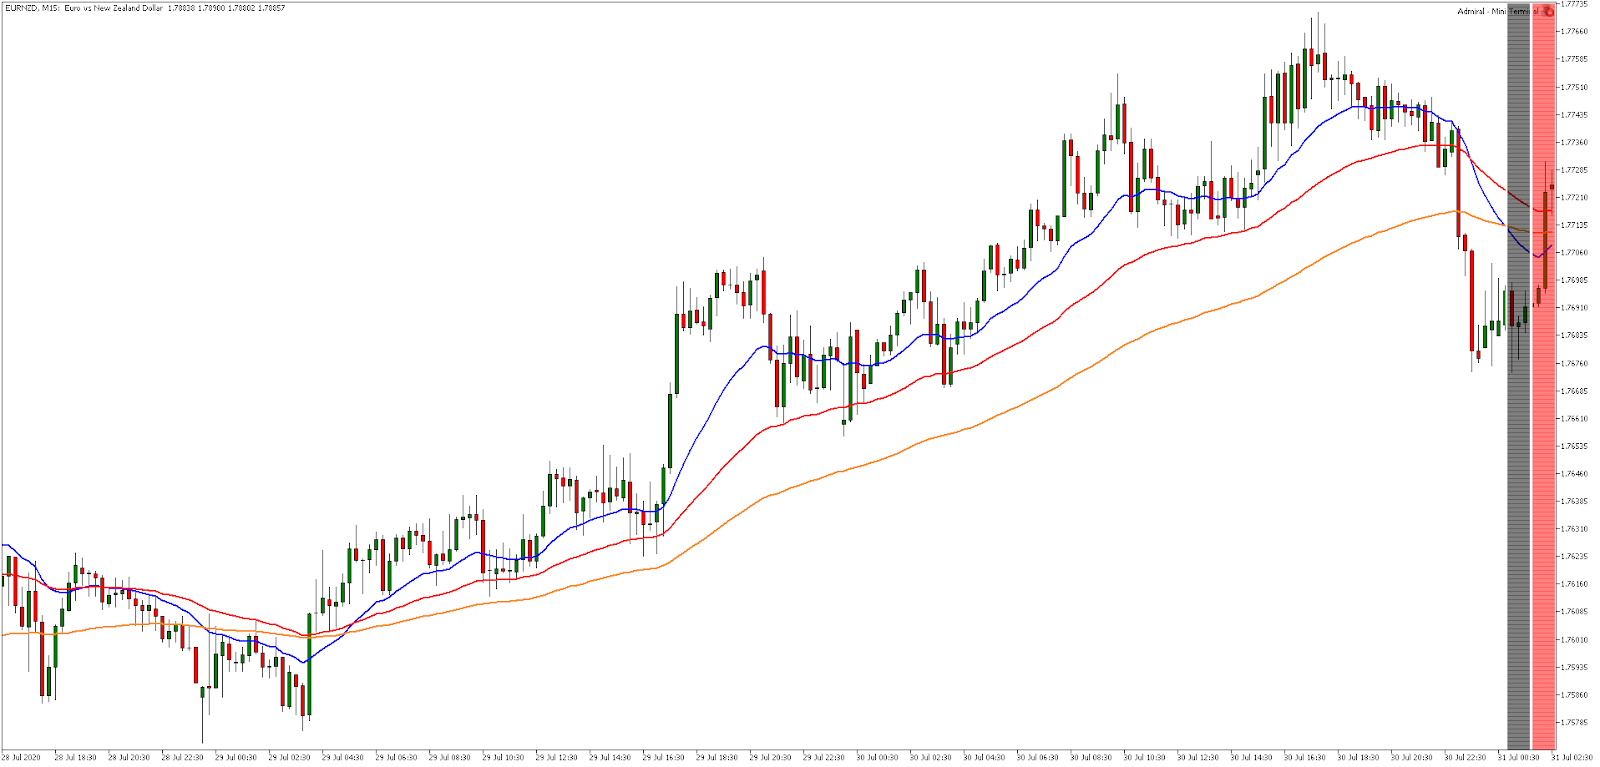
A chart of EURNZD showing the 20, 50 and 100-period exponential moving average taken from the MetaTrader 5 trading platform. Disclaimer: Charts for financial instruments in this article are for illustrative purposes and do not constitute trading advice or a solicitation to buy or sell any financial instrument provided by Admirals (CFDs, ETFs, Shares). Past performance is not necessarily an indication of future performance.
In the chart above each bar represents 15 minutes worth of trading, a time frame often used by day traders. Three different moving averages have been plotted against its price. These are the 20 (blue), 50 (red) and 100 (orange) exponential moving averages. Day traders will often wait for moving averages to angle in the direction of the trend and fan apart from each other to confirm the trend.
Technical indicators give a quick visual clue on the possibility of a trend and traders would often analyse price cycles as well.
- In up-trending markets, the price often exhibits a pattern of higher high and higher low cycle formations, as shown in the chart above.
- In down-trending markets, the price often exhibits a pattern of lower low and lower high cycle formations.
How to Build a Trend Trading Strategy
Here are some important factors to take into consideration when trend trading.
- Identify your style first. Will you focus on long-term or short-term trends?
- Pick the right market for your given style. Longer-term investors tend to focus on the stock market. Shorter-term traders can participate in multiple markets such as stocks, forex, indices and commodities.
- Choose the right account type. Longer-term trend followers may opt to purchase physical shares to also capitalise on dividends that a company may pay out. Shorter-term traders may use CFDs (contracts for difference) which allows traders to trade long and short and participate in long-term uptrends and downtrends.
- Define your strategy. It is important to have a defined set of rules to identify and trade the trend. Trading strategies are key to successful decision-making.
- Exercise proper risk management. All trends are easy to spot in hindsight. It is very different trying to forecast the future. Therefore, risk management is key in being able to manage the inevitable losing trades when the trend does not continue.
Conclusion
Trend trading can be done on a long-term and short-term basis. Identifying your style of trading the trend is important to then identify the right market to trade on. While longer-term investors may opt for the stock market, short-term traders can trade across multiple asset classes. With Admirals, you can use the Invest.MT5 account to invest in physical shares with competitive commissions and capitalise on dividend payouts. You can also use the Trade.MT5 accounts to trade CFDs on thousands of global markets and trade long and short.
A good way to get started is to practice your ideas and strategies in a virtual trading environment. With Admirals, you can open a free demo trading account and practice until you are ready for a live account.

Continue Reading:
FAQs on Trend Trading Strategies
Is trend trading a good strategy?
Trend trading can be a good strategy if you are able to identify the right markets which have the ability to sustain a long-term trend. Trends can typically provide a higher reward to risk but having a clearly defined strategy and exercising proper risk management is key to finding success in trading the trend.
What is a trend trading strategy?
A trend trading strategy is a list of rules or criteria that help you to identify a market which has a higher probability chance of moving in a given direction over a sustained period of time. The aim of the trend trader is to identify and trade in this direction.
About Admirals
Admirals is a multi-award winning, globally regulated Forex and CFD broker, offering trading on over 8,000 financial instruments via the world's most popular trading platforms: MetaTrader 4 and MetaTrader 5. Start trading today!
This material does not contain and should not be construed as containing investment advice, investment recommendations, an offer of or recommendation for any transactions in financial instruments. Please note that such trading analysis is not a reliable indicator for any current or future performance, as circumstances may change over time. Before making any investment decisions, you should seek advice from independent financial advisors to ensure you understand the risks.