What Is Market Volatility?
Market volatility measures how much an asset’s price swings over a given period. A highly volatile market is one where price swings are large, whereas a low-volatility market sees smaller, more contained movements.
In this article, we look at what volatility is, what causes it, how it’s measured, and what it means for traders and investors in practice.
The information in this article is provided for educational purposes only and does not constitute financial advice. Consult a financial advisor before making investment decisions.
Table of Contents
Key Takeaways
- Market volatility refers to the size and frequency of an asset's price movements over a given period.
- It tends to rise when uncertainty increases, such as around economic announcements, company earnings and geopolitical events.
- Common tools for measuring it include standard deviation, Average True Range, Bollinger Bands, beta and the VIX.
- Higher volatility can create more potential opportunities for short-term traders, whilst feeling like a bigger source of uncertainty for longer-term investors.
What Is Market Volatility?
Volatility measures the degree to which an asset's price swings over a given period. The wider the range of those movements, the higher the volatility.
It is a normal feature of how prices behave. In practice, some degree of volatility is present in almost every market, since real prices don't tend to move in a perfectly smooth or predictable way. The question is, how high is that volatility?
High Volatility vs Low Volatility
The difference between high and low volatility comes down to the size of price movements relative to what is normal for that market.
A highly volatile market is one where prices shift by large amounts over short periods; in low-volatility conditions, price changes are modest and incremental.
What counts as a significant swing varies from one asset to the next, with each one having different typical ranges of movement.
Neither state is strictly good or bad. For some traders, volatility creates the conditions they look for, with larger price swings creating more potential opportunities. For longer-term investors, periods of high volatility may be unsettling.
However, generally speaking, the higher the volatility, the riskier the asset. It’s a relationship we'll explore in more detail later.
The Different Types of Volatility
There are two main types of volatility:
- Historical Volatility: a backward-looking measure based on historical price movements.
- Implied Volatility: a forward-looking measure reflecting market expectations of future price movements.
Historical Volatility
Historical volatility measures how much an asset's price has moved over a given period.
Because it can be calculated over a rolling window that updates with each new price point, it can provide a continuous, current reading of how volatile an asset is relative to its typical behaviour.
It is also useful for understanding how an asset has performed under different market conditions and for comparing the relative volatility of different assets over time.
Implied Volatility
Implied volatility is forward-looking. Rather than measuring past price movements, it reflects what market participants expect to happen over a given future period.
It is derived from the market prices of options contracts. Options pricing models require several inputs, one of which is expected volatility.
By working backwards from the current price of an option, it is possible to identify the level of volatility the market has priced into an asset. When implied volatility is high, significant price swings are anticipated, whereas when it's low, calmer conditions are expected.
The CBOE Volatility Index (VIX), which tracks expected volatility in the S&P 500 over the next 30 days, is the most widely followed measure of implied volatility.
What Causes Market Volatility?
Markets are driven by expectations about the future, and volatility tends to rise when these expectations shift or when uncertainty increases. There are many factors which can cause volatility, including:
- Economic Announcements: Volatility often rises around the time of important economic announcements, such as GDP figures, job reports, central bank decisions and inflation data. If these numbers deviate significantly from expectations, it can cause a spike in volatility.
- Company Earnings: Similar to planned economic announcements, volatility can rise around the time of a company’s earnings report. Again, if the results diverge significantly from what’s expected, price can move sharply.
- Geopolitics: War, sanctions, trade tensions and elections can all introduce uncertainty about future economic conditions.
- News: Any events which have an impact on an industry or specific asset may introduce volatility. For example, adverse weather conditions can cause uncertainty about the supply of agricultural commodities.
- Market Sentiment: Psychology can also play a role in amplifying volatility. When fear grips the market, selling can accelerate beyond what fundamental factors actually justify.
- Liquidity: In thinly traded markets, big orders can have an outsized impact on price, meaning that less liquid markets tend to be more volatile than heavily traded ones.
How Is Market Volatility Measured?
There are a number of tools which can be used to measure volatility, each one approaching the question differently. Some look at past price behaviour, whilst others attempt to gauge market expectations about what lies ahead.
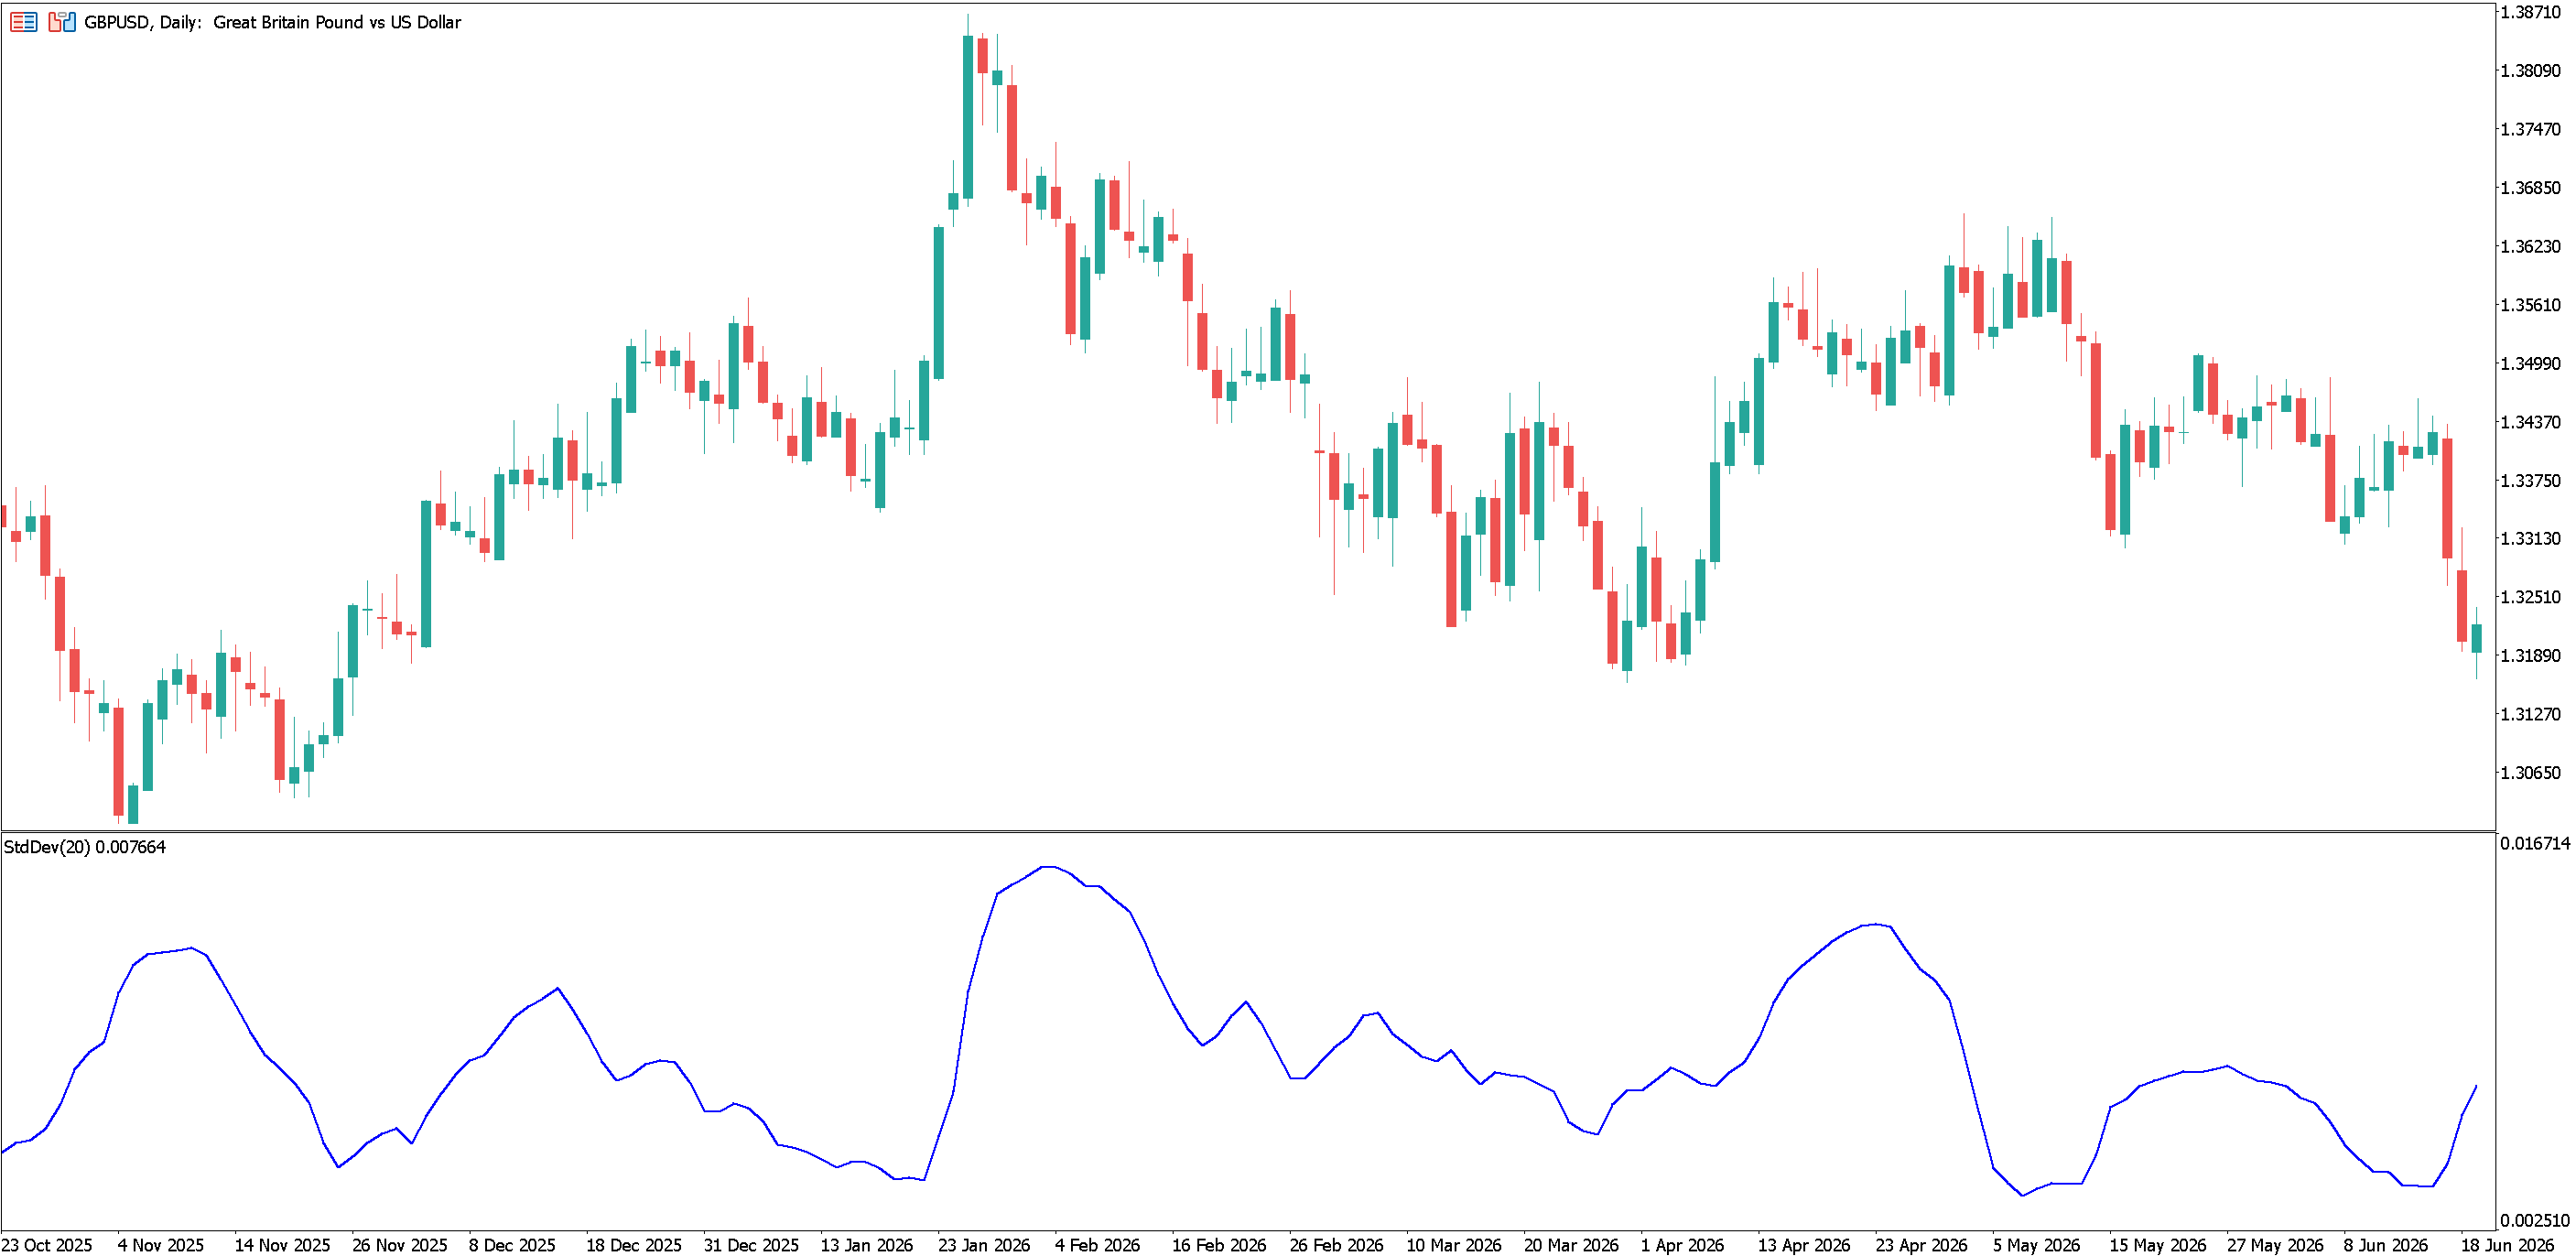
Standard Deviation
Standard deviation is the statistical foundation of historical volatility.
It is calculated by finding the square root of variance, which measures how widely returns are dispersed from the average. The greater that dispersion, the higher the standard deviation and, consequently, the higher the volatility.
In practice, rather than calculating it themselves, traders can use a standard deviation indicator, which is automatically calculated on most trading platforms, including MetaTrader 4 and MetaTrader 5.
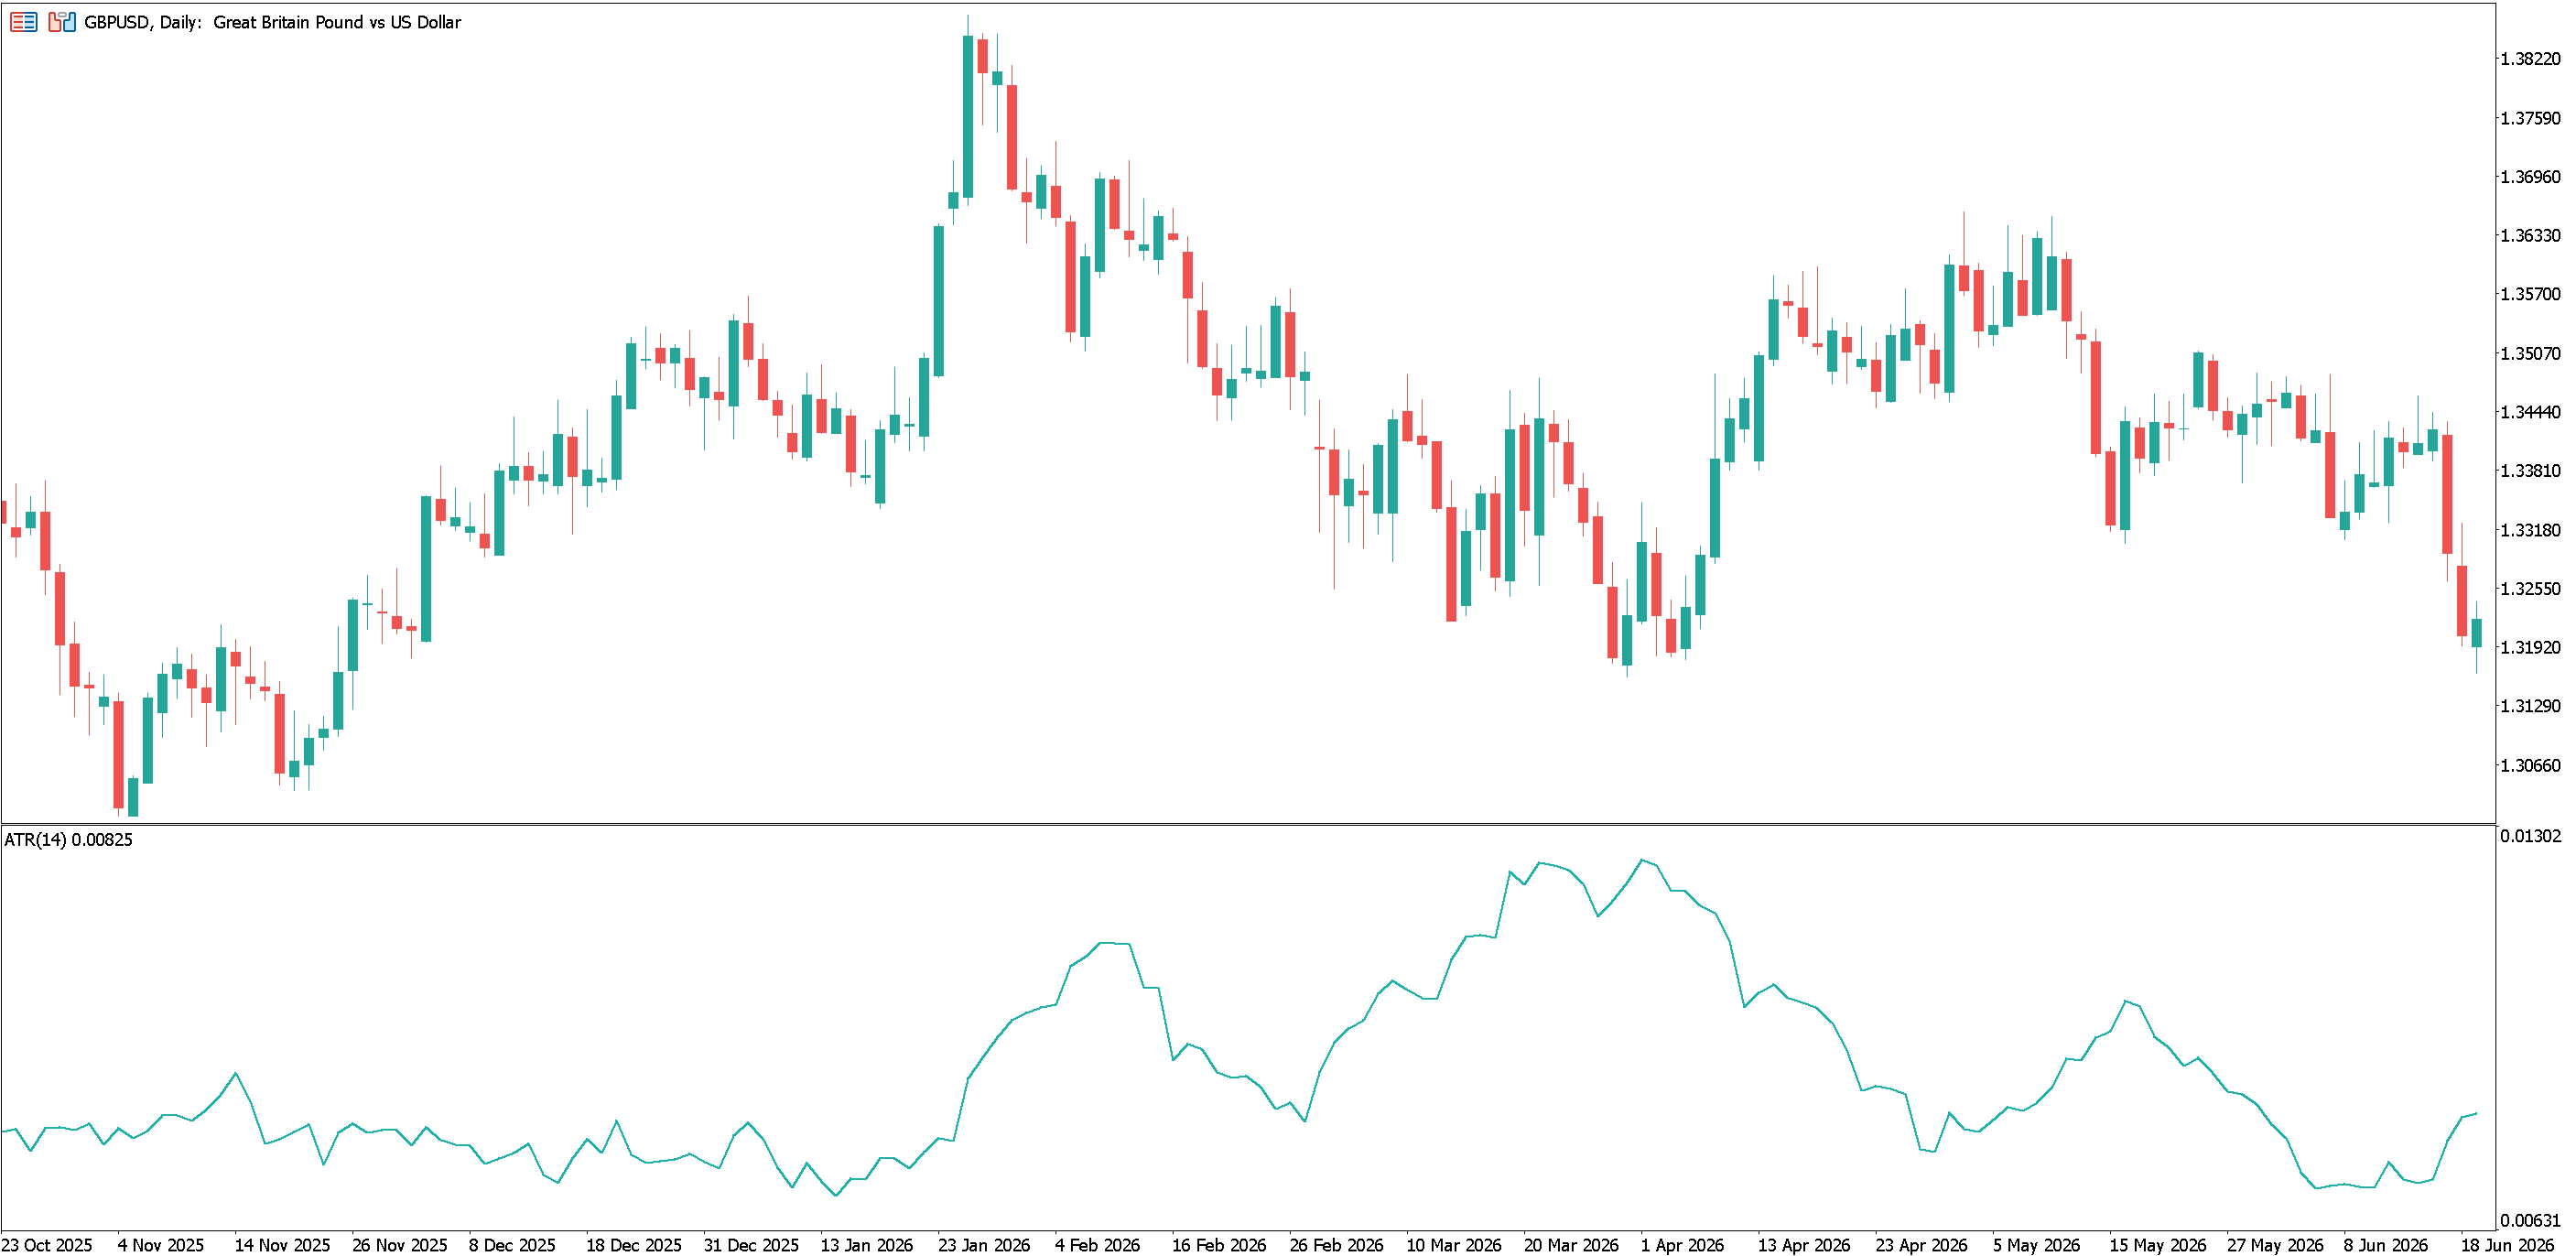
Average True Range (ATR)
The Average True Range, developed by technical analyst J. Welles Wilder, measures the average size of an asset's price movements over a given period. Rather than comparing returns to a mean, it captures the typical range of price movement from one period to the next.
To account for overnight gaps, ATR is based on the "true range" of each period, defined as the greatest of the following:
- The distance between the current high and low
- The distance between the current high and the previous close
- The distance between the current low and the previous close
The ATR is then calculated as the moving average of those true range values, typically over 14 periods. A rising ATR indicates increasing volatility, whilst a falling ATR suggests volatility is calming.
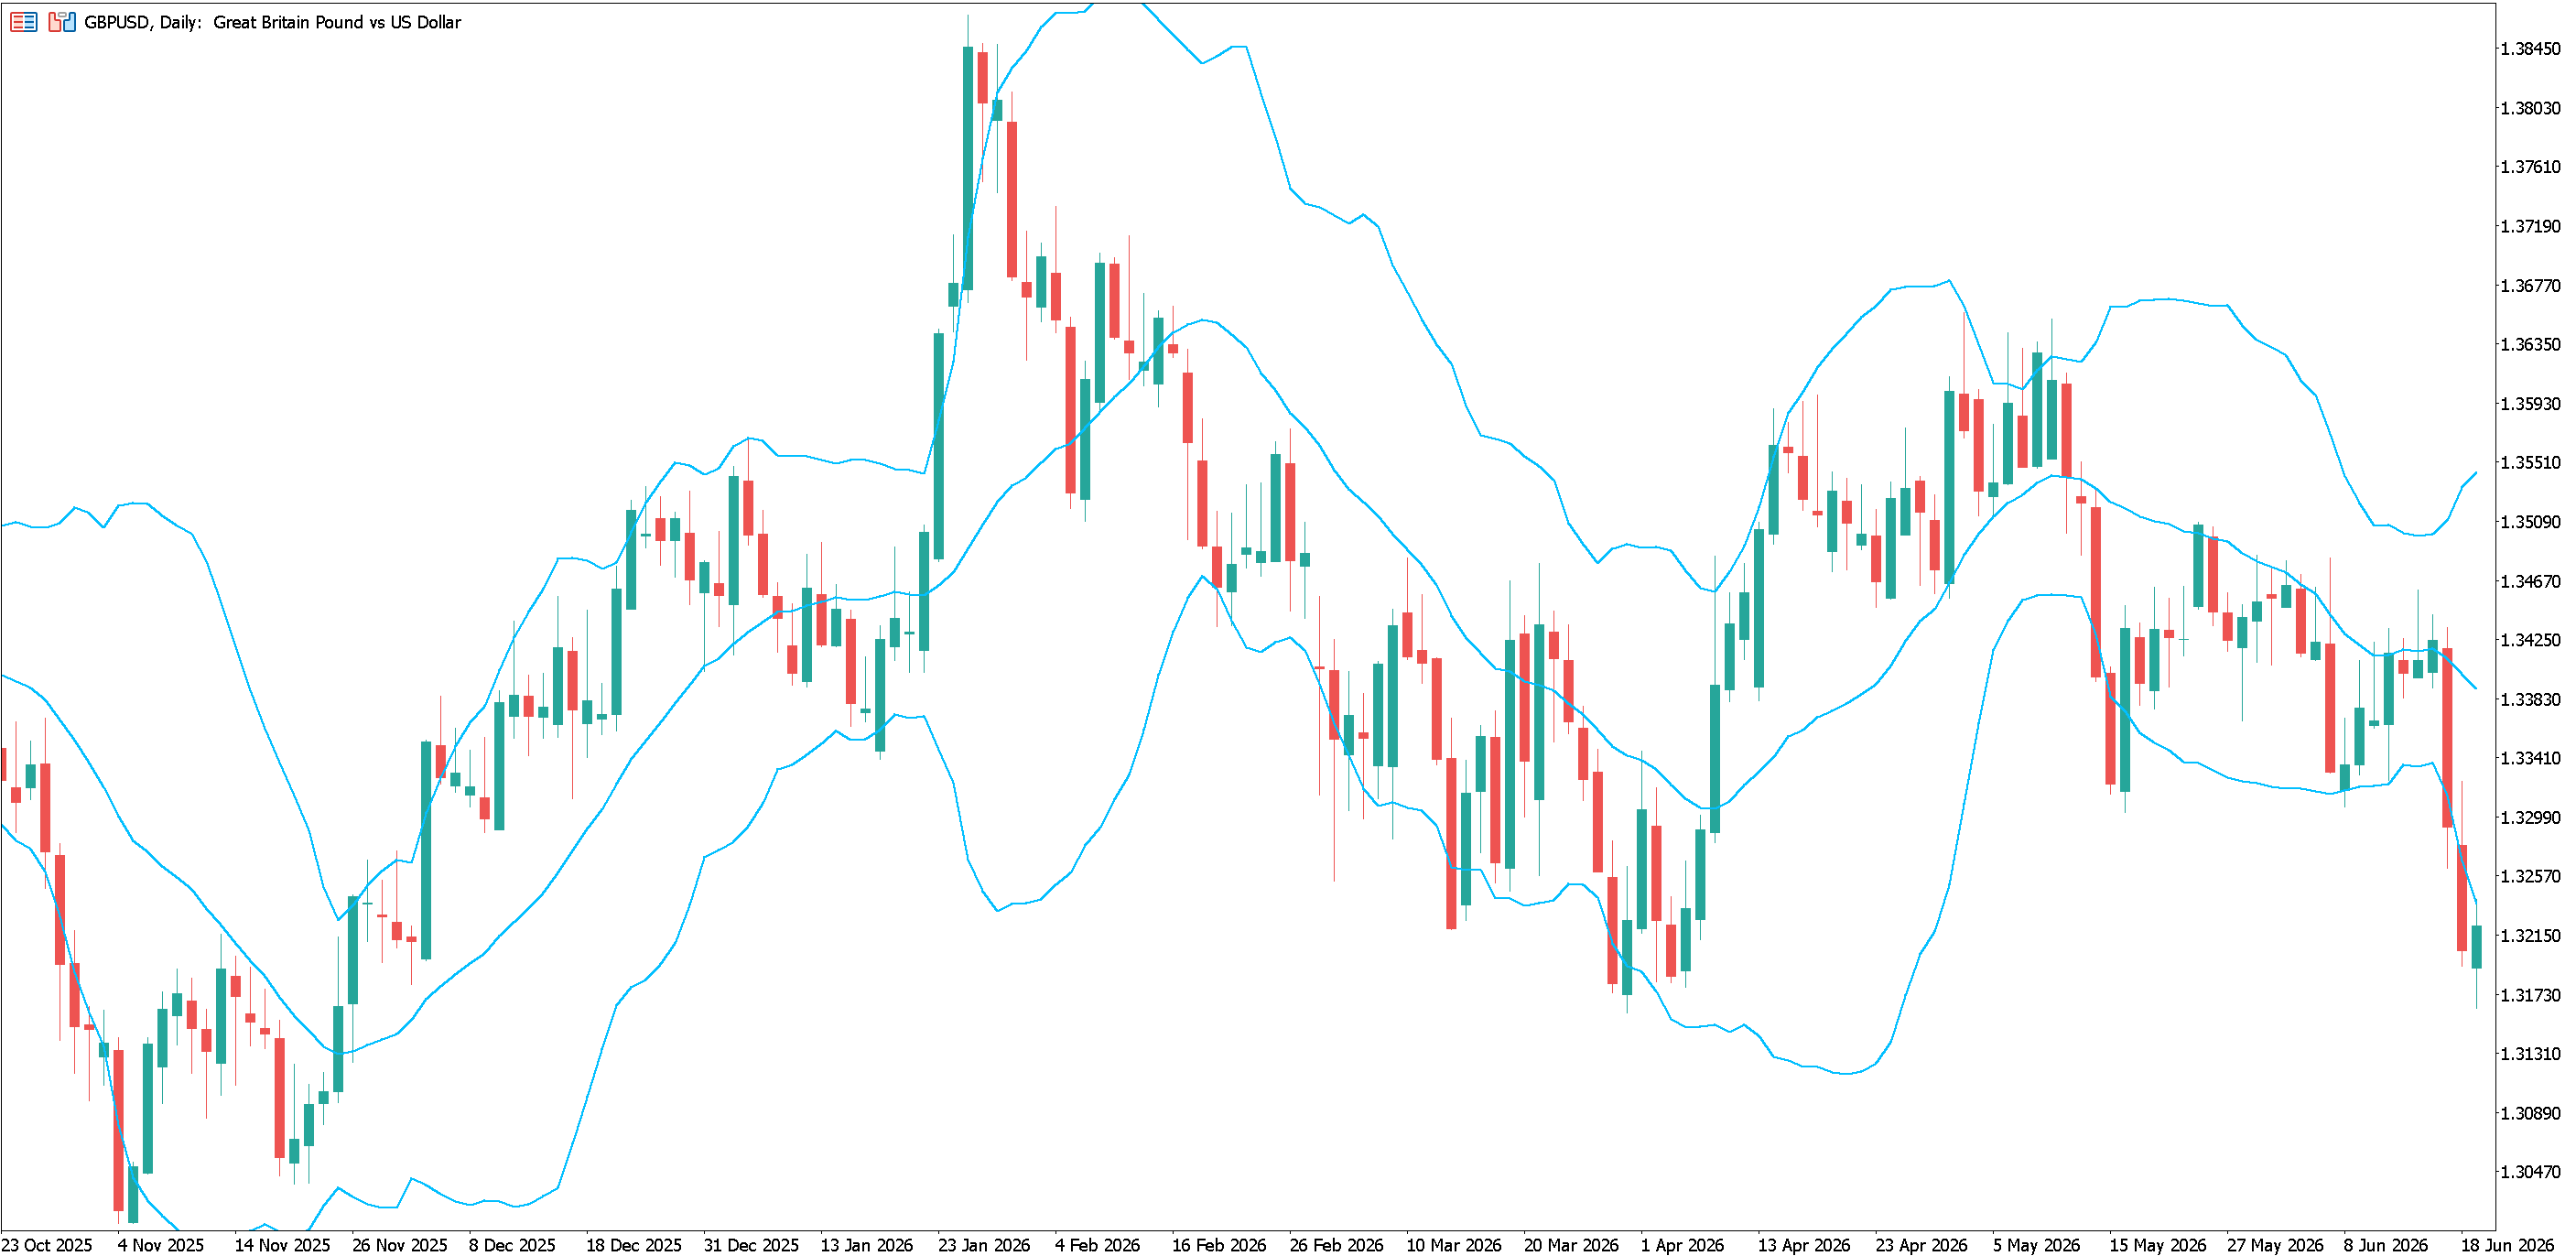
Bollinger Bands
Bollinger Bands consist of three lines plotted on a price chart. A moving average is enveloped by an upper and lower band, which are set two standard deviations above and below it.
The width of the bands reflects volatility levels in the market. When volatility increases, the bands widen; when it falls, they contract. This contraction is sometimes referred to as a Bollinger Band squeeze, which is often interpreted as a signal that a significant price move is imminent.
The VIX
The CBOE Volatility Index (VIX) is the most widely followed measure of expected market volatility. It is derived from S&P 500 options prices and reflects the level of volatility the market expects over the next 30 days.
The VIX is often referred to as the fear gauge. A rising VIX signals growing unease in the market, whereas a falling VIX suggests calmer expectations.
The following thresholds are commonly used as a rough guide to interpreting VIX readings:
These thresholds are approximate and should be interpreted in context. Whilst the VIX specifically measures expected volatility in the US stock market, similar indices exist for other markets, including the VSTOXX for European equities.
Beta
Beta is also worth a mention as a measure of relative volatility. It works by expressing an asset's volatility relative to a benchmark, typically the wider market.
A beta of 1 would suggest that a stock moves in line with the wider market. A stock with a beta above 1 tends to move more than the wider market, whereas a stock with a beta below 1 tends to move less.
What Does Volatility Mean for Traders and Investors?
How volatility is viewed depends on who’s looking at it. The same wild price swings may represent opportunity to one market participant and unwanted risk to another.
Is Volatility the Same as Risk?
Volatility and risk tend to move together, but they aren't quite the same thing. Volatility measures how much a price moves, whereas risk is the possibility of losing money on a position.
The two are closely linked, because larger price swings mean the market can move against a trader by a greater amount, and more quickly. But whilst higher volatility may increase risk, it isn’t the only factor.
Regardless of how volatile a market is, the size of a trader's position and whether they have an appropriate risk management strategy both also factor into how much risk a trader is taking.
The Short-Term Trader's Perspective
Many short-term traders, particularly scalpers and day traders, actively seek volatility rather than trying to avoid it.
These traders aim to profit from price movements in either direction over a short timeframe, and periods of higher volatility can produce more potential opportunities for trading.
However, these volatile conditions require closer attention, as prices can move quickly and unpredictably. Risk management, including the use of stop losses, becomes even more important when price swings are larger.
The Long-Term Investor's Perspective
For an investor planning to hold an asset over many years, a short-term period of turbulence may be inconsequential.
Whilst such periods can be unsettling, if a position doesn't have to be sold during the volatile stretch, the price swings may not affect the long-term outcome.
What may be a bigger consideration is whether an asset has a persistent tendency towards high volatility, rather than as a response to a particular event. That's different to a market simply going through an uncertain few months; it might reflect something more structural about the asset, which may be off-putting for a long-term investor.
How to Trade Volatility
There are two approaches to trading volatility: trading different markets during volatile conditions, and trading volatility itself, through the VIX and similar instruments.
Trading Volatile Markets
Most volatility trading involves taking a position on a market that happens to be experiencing high volatility. This might include Forex pairs, commodities, indices or individual stocks during periods of elevated price movement.
Because price swings are larger during volatile conditions, risk management tends to take on even greater importance. Stop losses and take profit orders can help predefine a trader's risk on each position before entering a trade, whilst position sizing can be adjusted to account for the wider range of potential price movement.
Technical indicators such as ATR and Bollinger Bands can help traders gauge current volatility levels before deciding how to size a position or where to place orders.
Trading the VIX and Volatility Products
For traders who want to take a position on the level of volatility itself, several instruments exist:
- VIX futures and options: derive their value directly from the VIX index
- Volatility ETFs and exchange-traded notes (ETNs): offer exposure to volatility, often by holding VIX futures contracts
- VIX CFDs: allow traders to speculate on the index's price without holding the underlying futures contracts
These products allow a trader to take a view on whether volatility itself is likely to rise or fall, independent of which direction the underlying market moves.
They all carry their own risks and behaviours. In particular, derivative products such as futures, options and CFDs are complex instruments which are not suitable for all traders and investors.
Other Articles You Might Be Interested In:
Frequently Asked Questions
What Is Considered High Volatility?
There isn't a fixed threshold that applies across all markets. What counts as high volatility depends on what's typical for an asset or market. For example, a price swing that would be unusual for a major currency pair might be unremarkable for a specific individual stock. Rather than a fixed number, volatility is generally judged relative to an asset's own typical range of movement.
How Is Volatility Calculated?
The most common way to calculate historical volatility is using standard deviation, which is calculated with the following steps:
- Gather a series of periodic returns for the asset, such as daily price changes.
- Calculate the average return over that period.
- Find the difference between each return and the average, then square it.
- Average those squared differences to find the variance.
- Take the square root of the variance to find the standard deviation.
In practice, most traders use a platform's built-in standard deviation indicator rather than performing this calculation manually.
What Does a VIX Reading Above 20 Mean?
A VIX reading above 20 generally indicates elevated volatility, suggesting the market is pricing in greater uncertainty over the next 30 days than usual. Conversely, readings below 12 typically point to calmer conditions, whilst anything in between is considered a fairly normal range. Readings above 30 are often associated with significant market stress, though these levels are guides rather than fixed rules.
How Does Volatility Affect Forex Trading?
Currency pairs can experience significant volatility around economic announcements, particularly inflation readings and interest rate decisions. Volatility levels also vary considerably between currency pairs and trading sessions.
Is High Volatility Good or Bad?
Neither necessarily. High volatility simply means larger and more frequent price swings. This may suit traders attempting to profit from short-term price movements but can feel unsettling for those holding an asset over a longer time frame.
INFORMATION ABOUT ANALYTICAL MATERIALS:
The given data provides additional information regarding all analysis, estimates, prognosis, forecasts, market reviews, weekly outlooks or other similar assessments or information (hereinafter “Analysis”) published on the websites of Admirals investment firms operating under the Admirals trademark (hereinafter “Admirals”) Before making any investment decisions please pay close attention to the following:
- This is a marketing communication. The content is published for informative purposes only and is in no way to be construed as investment advice or recommendation. It has not been prepared in accordance with legal requirements designed to promote the independence of investment research, and that it is not subject to any prohibition on dealing ahead of the dissemination of investment research.
- Any investment decision is made by each client alone whereas Admirals shall not be responsible for any loss or damage arising from any such decision, whether or not based on the content.
- With view to protecting the interests of our clients and the objectivity of the Analysis, Admirals has established relevant internal procedures for prevention and management of conflicts of interest.
- The Analysis is prepared by an analyst (hereinafter “Author”), with the assistance of AI tools. The Author Roberto Rivero is a contractor for Admirals. This content is a marketing communication and does not constitute independent financial research.
- Whilst every reasonable effort is taken to ensure that all sources of the content are reliable and that all information is presented, as much as possible, in an understandable, timely, precise and complete manner, Admirals does not guarantee the accuracy or completeness of any information contained within the Analysis.
- Any kind of past or modelled performance of financial instruments indicated within the content should not be construed as an express or implied promise, guarantee or implication by Admirals for any future performance. The value of the financial instrument may both increase and decrease and the preservation of the asset value is not guaranteed.
- Leveraged products (including contracts for difference) are speculative in nature and may result in losses or profit. Before you start trading, please ensure that you fully understand the risks involved.