
Articles & Tutorials
Master financial trading with Admirals` Forex & CFD education hub. Find expert articles, tutorials, trading strategies, currency analysis, and psychology insights for every level.
Forex Strategy
What are the top Forex strategies? Our section on Forex strategies provides you with all kinds of articles to help you with your everyday trading. Learn about strategies such as: Forex scalping, support & resistance indicators, Forex swing trading, day trading, Bollinger Bands, and more!

Price Action Trading: How to Understand Raw Market Movements

What Is Grid Trading? A Forex Guide to Types, Examples & Bot Setup

What Is an OCO Order?

Momentum Trading Strategy: How to Use It, Indicators & Setups

Forex Hedging: Meaning, Methods, Strategies

5 Top Forex Trading Strategies Explained

How to Trade the Inside Bar Candlestick Pattern in Forex

Top Days of the Week to Trade Forex in 2026
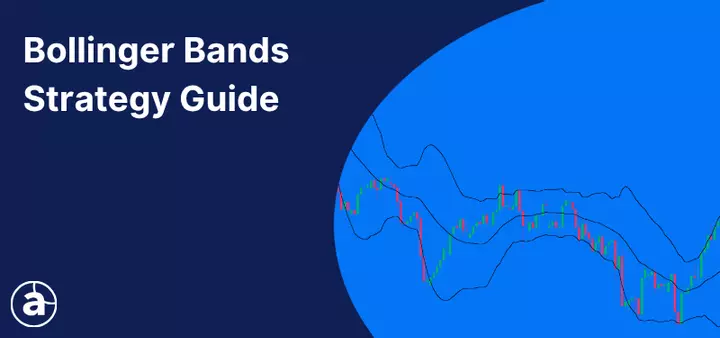
Bollinger Bands Strategy Guide

The Trading Style Guide: Scalping vs Day Trading vs Swing Trading

Forex Scalping Strategy Guide: Trading the 1-Minute Chart

NFP Trading Strategy Guide
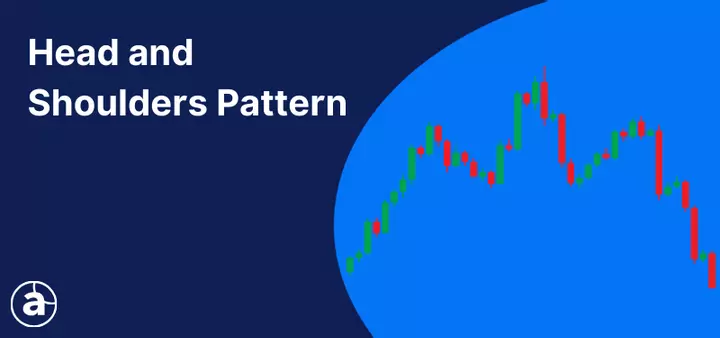
The Head and Shoulders Pattern

Divergence in Forex Trading

Top Forex Manual Trading Systems

The Forex Arbitrage Trading Strategy Guide

The Swing Trading Strategy Guide for 2026
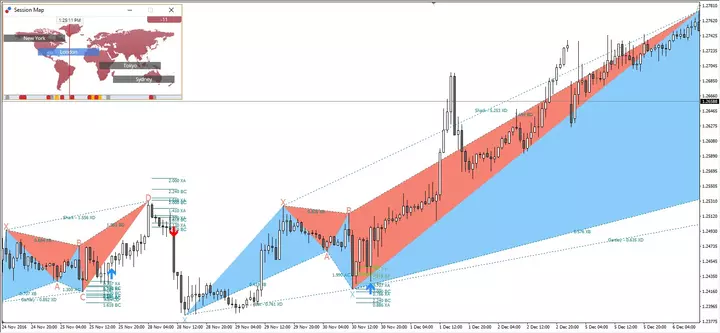
Harmonic Trading Patterns in Trading

What is carry trade in Forex?

Fibonacci Forex Trading Strategy - Fibonacci Retracement Levels
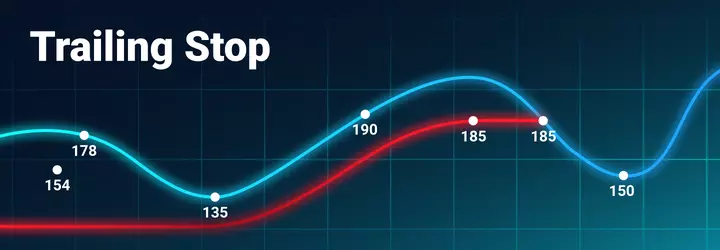
What is a Trailing Stop? Learn to use the Dynamic Stop Loss

How to Trade the Fed Rate Decision

Ready to trade with a broker that takes it as seriously as you do?
Join traders who’ve already made the switch. No demo pressure. No hidden fees. Just infrastructure that holds up when the market doesn’t.
CFDs and real stocks in one place
Daily market insights
Advanced tools on MT4/MT5