Ins and Outs of Trading the EUR/USD Currency Pair
The US Dollar and the Euro are two of the most prominent and well-known currencies in the world. The Euro versus US Dollar (EUR/USD) currency pair has the largest global trading volume, meaning it is the world's most-traded currency pair. Whether you find the instrument easy or difficult to trade on, it's not a pair that many traders neglect, due to its daily volatility and price movement.
This article provides a detailed account of all the angles connected to Euro/Dollar trading, EUR vs USD strategies, Euro Dollar news, and much more. It will mention the top strategies that readers should consider, and the various factors and forces driving the price movement and direction.

Table of Contents
- EUR/USD: An Introduction
- EUR/USD: History of Currency Pair
- Trading EUR/USD: Analyzing the Euro Dollar Pair
- EUR/USD: Trading Strategy
- Strategies for Trading the Euro Dollar
- Correlation of the EUR/USD With Other Assets
- Best Time for Trading the Euro Dollar Pair
- Best Platform for Trading EUR/USD
- Which Broker to Choose?
- Conclusion: Investing in the EUR/USD
EUR/USD: An Introduction
Before we share how to invest in the Euro Dollar, let's define what the Euro Dollar is and what EUR / USD means.
The US Dollar (USD) and Euro (EUR) are official currencies of their respective economic zones in the US, and the nations within the European Union. The FOMC (Federal Open Market Committee) is a branch of the Federal Reserve (FED) that determines the direction of monetary policy for the US, which in turn impacts the value and perceived value of the US Dollar. The European Central Bank (ECB) is the main central bank for the Euro and the Euro zone, and has a similar impact on the Euro currency.
Both currencies are part of the Foreign Exchange (Forex) market. In the Forex market, the price of one currency moves up, down, or sideways versus another currency, which is referred to as a currency pair. The Euro (EUR) and the US Dollar (USD) form a currency pair which is known as the Euro/Dollar, EURUSD or EUR/USD. Both the EUR and the USD also form currency pairs with other currencies such as, the Euro versus the Great British Pound (EUR/GBP) or the US Dollar versus the Canadian Dollar (USD/CAD).
The Euro Dollar is the most-traded currency pair in the Forex market, and its value refers to the exchange rate of the euro against the US dollar. A EUR / USD price of 1.2 means that to buy one Euro (EUR) you must pay 1.2 US Dollars (USD). In other words, 1 Euro is equivalent to 1.2 Dollars.
The Euro Dollar can be used in real economy trading, but also as a financial instrument in the form of CFDs to speculate on the exchange rate between the Euro and the US Dollar.
What the EURUSD price change means
While the EUR/USD exchange rate is constantly changing, what does that mean in terms of the value of each of the currencies? Simply, when the exchange rate goes up, that means the value of the Euro has increased, while the value of the Dollar has decreased in comparison. When the exchange rate goes down, the opposite is true.
- When the price of the Euro Dollar rises (for example from 1.15 to 1.17) the euro increases its value against the dollar.
- When the price of the Euro Dollar falls (for example from 1.22 to 1.19), the Euro loses value and the Dollar increases in value.
- If you were trading the USD/EUR rather than the EUR/USD, the opposite would happen. It is important to note that this version of the Forex pair is not very common.
When the price rises or falls, it tells us that one currency is becoming stronger or weaker than the other, or even both:
- A rise in the Euro Dollar could mean that the Euro is getting stronger compared to the Dollar or
- It could mean that the Dollar is weakening.

As you can see in the chart above, the exchange rate of the EUR/USD was in a down trend until September 2019, meaning the Euro was weakening against the dollar (or the Dollar was strengthening against the Euro) throughout this period. From September 2019 until February 2020, the currency pair traded within a range from a low of about 1.0875 to a high of about 1.1240. February and March then saw extreme volatility due to the coronavirus pandemic.
Euro Dollar - The Most Traded Currency Pair
The US Dollar (USD) is the world's most traded currency, and the Euro claims the second spot, according to a Central Bank Survey conducted in 2016. The USD takes a daily share of 87.6% of all currency related trade activity, which is 2.79 times as much as the Euro's share at 31.4%.
There are a couple of conclusions that can be considered:
- The US Dollar's lead is enormous, the USD has the largest daily share by far
- It does not come as a surprise that the EUR/USD is a highly traded currency pair, as it incorporates the world's first and second highest valued currencies
The rest of the top five Forex pairs are the Japanese Yen with a 21.6% share, Pound Sterling at 12.8%, and the Australian Dollar at 6.9%. The table below displays percentages for the entire top 10 currencies.
|
Rank |
Currency |
Currency symbol |
% daily share (April 2016) |
|
1 |
United States dollar |
USD (US$) |
87.6% |
|
2 |
Euro |
EUR (€) |
31.4% |
|
3 |
Japanese Yen |
JPY (¥) |
21.6% |
|
4 |
Pound sterling |
GBP (£) |
12.8% |
|
5 |
Australian dollar |
AUD (A$) |
6.9% |
|
6 |
Canadian dollar |
CAD (C$) |
5.1% |
|
7 |
Swiss franc |
CHF (Fr) |
4.8% |
|
8 |
Renminbi |
CNY (元) |
4.0% |
|
9 |
Swedish krona |
SEK (kr) |
2.2% |
|
10 |
New Zealand dollar |
NZD (NZ$) |
2.1% |
|
Other |
21.5% |
||
|
Total |
200.0% |
||
|
Source: Triennial Central Bank Survey Foreign exchange turnover in April 2016. Data range: 11 December 2016 - Retrieved 22 March 2017. |
|||
The currencies with a higher daily share are usually the most interesting currency pairs for traders, because price movement tends to be stronger and more regular from an intra-day and daily perspective when compared with less frequently traded currencies, which we will explore now. Most traders tend to stick to "major" currency pairs such as the EUR/USD, GBP/USD, USD/JPY, EUR/JPY, GBP/JPY, whereas some traders venture into lesser known currency crosses such as GBP/AUD, EUR/NZD, CAD/JPY.
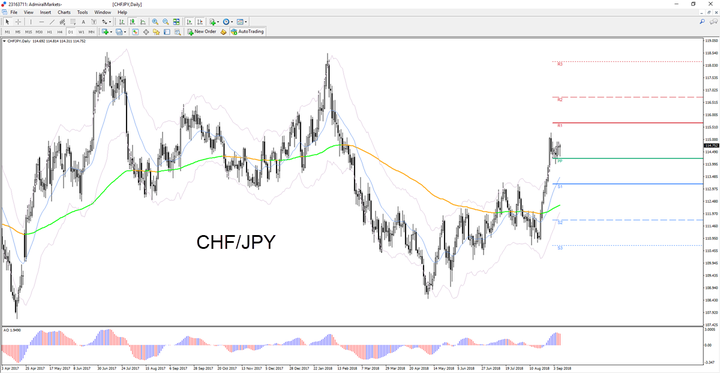
The most popular however, is the Euro/Dollar. The "exotic" currency pairs, such as, Czech Crown (CZK) versus Mexican Peso (MXN/CZK) or CHF/JPY (Swiss Franc versus Japanese Yen) are often more difficult to trade due to lower volatility, and are not recommended for new traders.

EUR/USD: History of Currency Pair
The Forex market in the late 90s was significantly different from the way it is today. Back then, the German Deutschmark against the US dollar was one of the biggest currency pairs, along with the French Franc versus the US dollar.
It didn't take long before the course of currency conversion history changed. On 1 January 1999, the Euro came into existence. The journey leading to the euro began decades before. There were also earlier versions of Euro, in the form of internal accounting units for the European Community members:
These were:
- The European unit of account
- The European currency unit (ECU)
These were not true currencies, however. Instead, they were baskets of certain EC currencies, designed to aid stability in European exchange rates. Thus, they helped pave the way for a single currency. The ECU basket of EC currencies had a slightly different composition to those that would comprise the Euro. Despite this difference in composition, the ECU played a crucial role in the historical exchange rate of the Euro. This is because the value of one Euro was set as the value of one ECU at its inception on 1 January 1999.
This made the original Euro Dollar exchange rate 1.1686. Though the Euro wouldn't become a physical currency until 2002, the Euro launch at the beginning of 1999 tied the ratio of these Eurozone currencies together. Thus, the French Franc, the German Deutschmark, the Spanish Peseta, the Italian Lira, etc., ceased to have separate, floating historical FX rates after this point.
Instead, they were effectively pegged to the value of the Euro until they were completely folded into the shared currency we know today. Many saw the Euro in its early days as a contender to usurp the Dollar's unofficial title as the global reserve currency. While this could still happen, the Dollar still retains its crown by some margin.
What has affected the history of EUR/USD?
While the short-term ebb and flow of the Euro to Dollar exchange rate can be influenced by a huge number of factors, the long-term performance of the currency pair has been driven by various fundamentals. Naturally, these are the same factors that affect exchange rates in general, no matter which FX pair you look at.
Two important factors that affect exchange rates in general are: the strength of the underlying economy, and monetary policy, which is implemented by the pertinent central bank. Of course, the latter is very much tied to the former. As the timeframes shorten, speculation starts to come into focus more and more. Therefore, expectations over central bank policy also have a major impact. If we look at the US Dollar to Euro exchange rate history, we can see some clear examples.
Many of these occurred after one of the biggest reductions in the Euro vs USD history: the global financial crisis that began in 2007. The stresses placed by this event on economies around the world forced a sequence of extraordinary responses from central banks. But here's a key part of the puzzle: the response wasn't uniform. The divergence in policy between the US Federal Reserve and the European Central Bank (ECB) in particular was pronounced.
How did they differ?
The Fed made early and aggressive moves to stimulate the US economy with three different tranches of quantitative easing (QE). In contrast, the ECB resisted QE for an extended period. When it finally began purchasing sovereign bonds as a stimulus measure, it was several years behind the FED.
Why did they differ?
The FED has a dual mandate:
- To foster maximum employment
- To stabilise prices
In contrast, the ECB's primary objective is solely price stability. This disparity in policy consequently led to some interesting effects on the Euro-Dollar exchange rate. In fact, for an extended period, the most important EUR/USD Forex news stories tended to be about FED stimulus. Another major issue facing the Euro was the Eurozone sovereign debt crisis. Certain member states had crippling amounts of national debt.
The uniform nature of monetary policy for the shared currency posed a thorny problem: you cannot tailor measures to the specific needs of different nations with a 'one-size-fits-all' monetary policy. This led to some questioning whether the single currency would even survive. Let's look at the specifics of the Euro against the Dollar over the period in question.
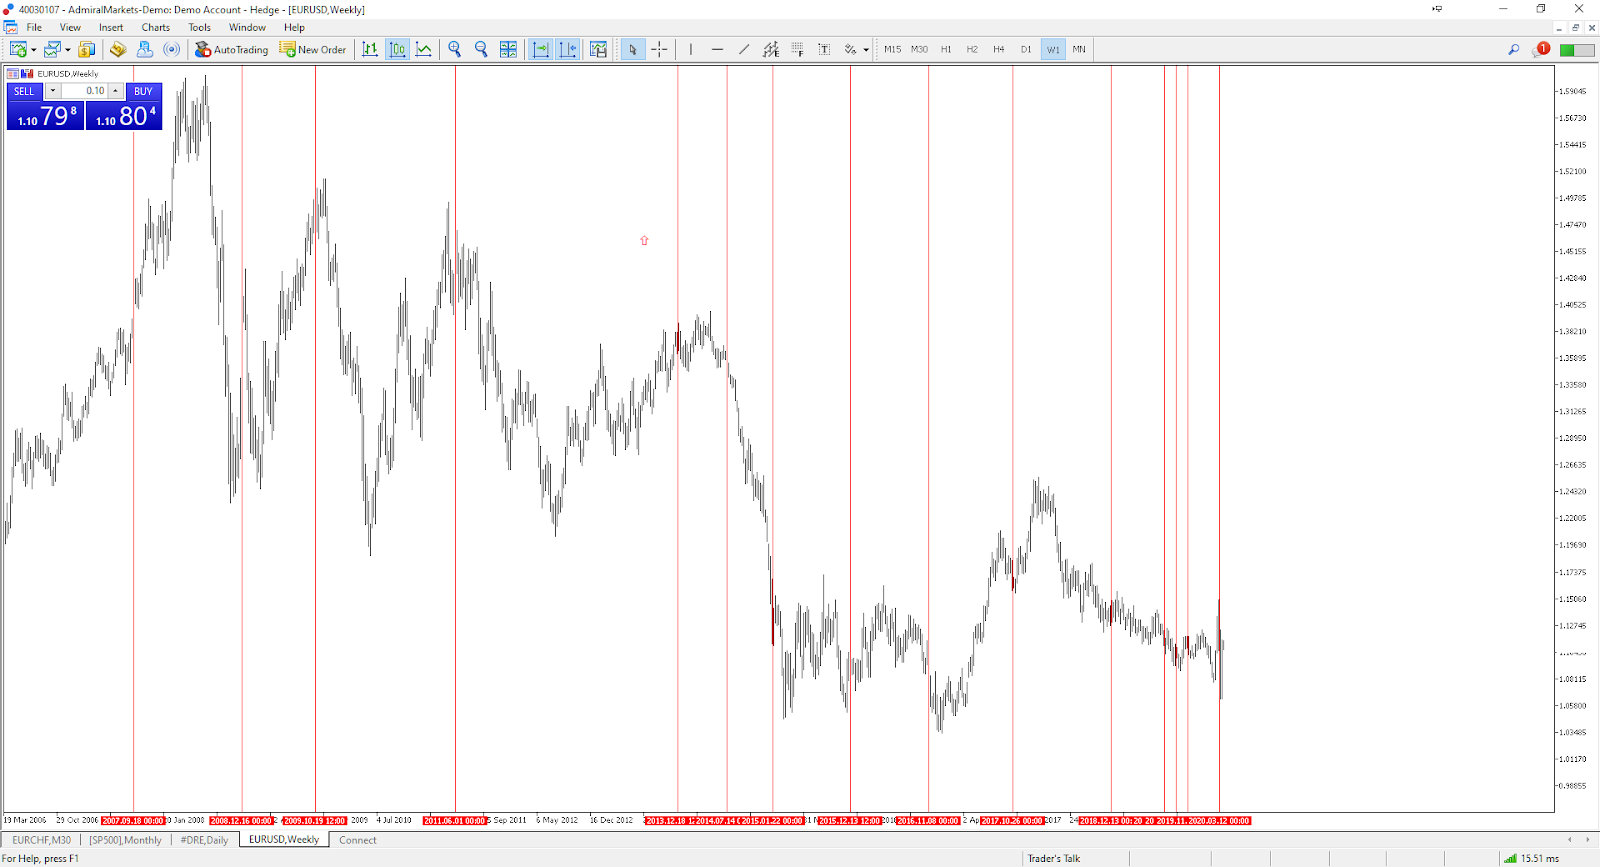
Here's a weekly EUR/USD chart dating back to 2007:

Some of the key events for the period are marked on the chart above, so that we can see how they affected the Dollar Euro exchange rate history.
Euro Dollar Exchange Rate History Since 2007
The most significant events in EUR/USD history are as follows:
|
|
Date |
Event |
Effect |
|
1 |
18 September 2007 |
FED cuts Fed funds rate by 50 basis points |
Euro strengthened against Dollar |
|
2 |
16 December 2008 |
FED cuts rates to near zero |
Euro strengthened against Dollar |
|
3 |
19 October 2009 |
The newly-elected Greek government revises deficit forecasts from 6.7% of GDP to 12.7% of GDP |
Euro weakens against Dollar |
|
4 |
1 June 2011 |
Moody's downgrades Greek debt by seven notches to junk status |
Euro weakens against Dollar |
|
5 |
18 December 2013 |
FED announces 'tapering' of stimulus will begin in January 2014 |
Euro weakens against Dollar into February 2014 |
|
6 |
14 July 2014 |
ECB president Mario Draghi prepares the market for QE, stating that it ' falls squarely in our mandate.' |
Euro weakens against Dollar |
|
7 |
22 January 2015 |
ECB introduces full blown QE |
Euro weakens against Dollar |
|
8 |
13 December 2015 |
Fed hikes interest rates for first time in a decade. |
Euro strengthens against Dollar |
|
9 |
8 November 2016 |
Donald Trump wins US Presidential election. |
Euro weakens against Dollar |
|
10 |
26 October 2017 |
ECB halves 60 billion EUR bond-buying programme |
Euro strengthens against Dollar |
|
11 |
13 December 2018 |
ECB ends 2.5 trillion EUR QE stimulus programme |
Euro weakens against Dollar |
|
12 |
25 July 2019 |
ECB President Mario Draghi prepares for interest rate cut as growth slows |
Euro weakens against Dollar |
|
13 |
12 September 2019 |
ECB President Mario Draghi cuts interest rates and restarts quantitative easing |
Euro weakens against Dollar |
|
14 |
1 November 2019 |
Ex-IMF Chief Christine Lagarde takes over as ECB President |
Euro strengthens against Dollar |
|
15 |
12 March 2020 |
ECB announces new bond-buying stimulus plan to fight impact of coronavirus |
Euro strengthens against Dollar |
Evolution of the Euro Dollar over the Years
Let's take a closer look at how the events listed above have affected the Euro to Dollar exchange rate over the years.
Above you can see a simple chart to highlight the general trends of the EUR/USD.
As we see, the price of the EUR/USD was on an upward trend from when the currency was first established. In mid-2018 the price reached the all-time high around 1.6038.
Since then, the EURUSD pair was in a bearish channel until late 2019. However, both in 2017 and in late 2019, instead of continuing to the lower area of the channel, the price slowed down in the line that marks the beginnings of an upward trend.
Let's zoom in a bit more on the graph!
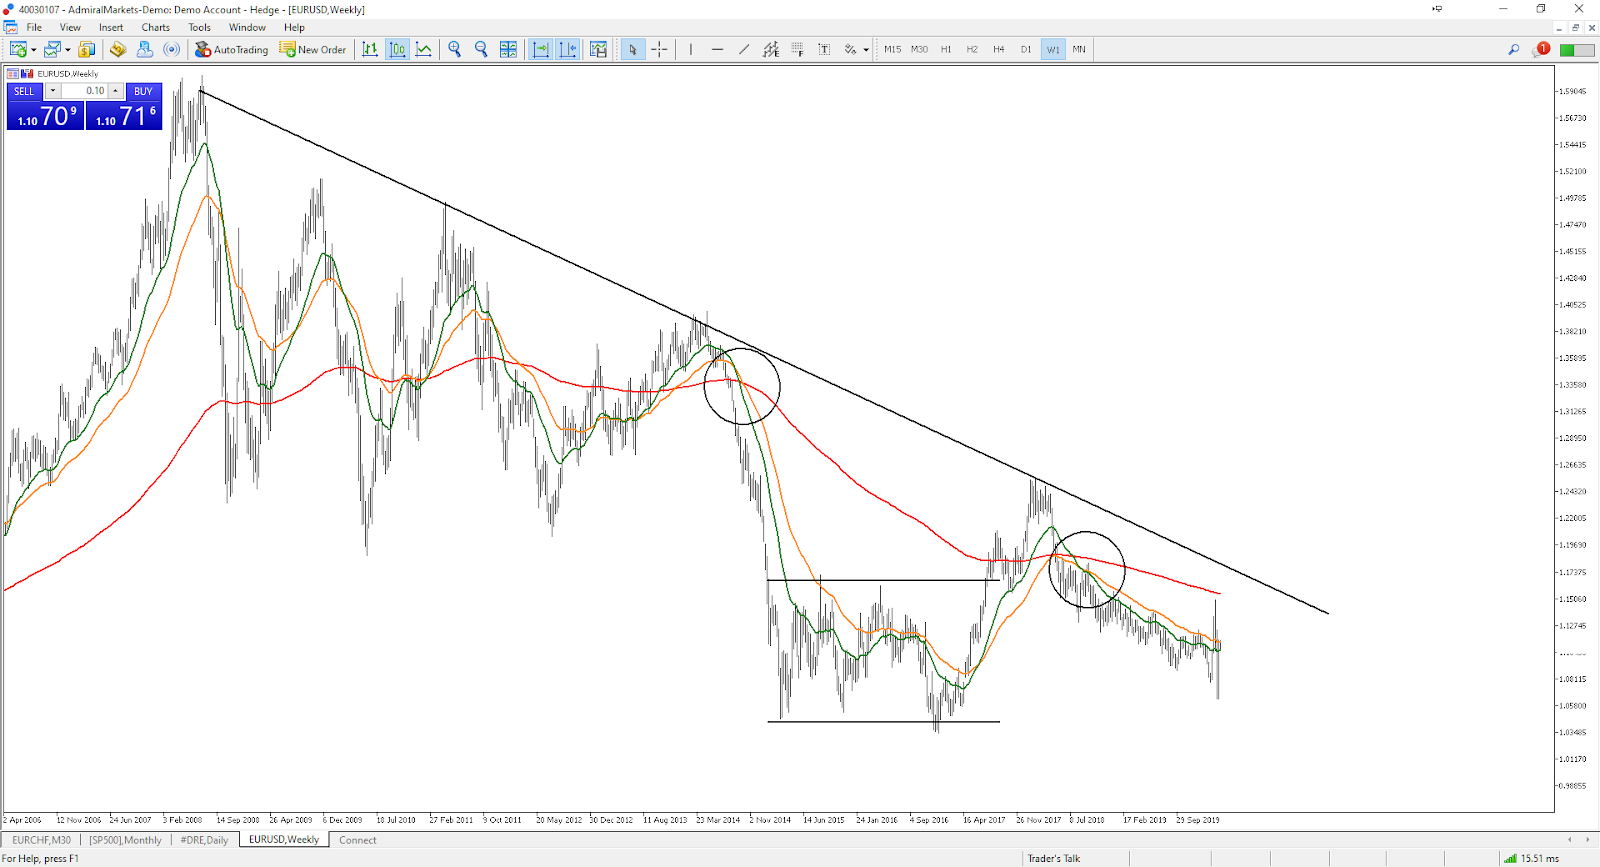
In this new image we have added 3 exponential moving averages (EMA):
- Red: 260 period EMA
- Orange: EMA 52 periods
- Green: EMA 26 periods
If we get a little closer to the bearish channel we can see how a triple crossover of averages occurred in October 2014 (black circle) with a clear decrease in the price of the Euro Dollar.
Between early 2015 and mid-2017, the price remained in a lateral range. When it managed to break the range, it headed back to the upper part of the bearish channel. Once this zone was reached, it rebounded and descended again, with a new crossing of averages, to stop, as we have mentioned, in the uptrend line.

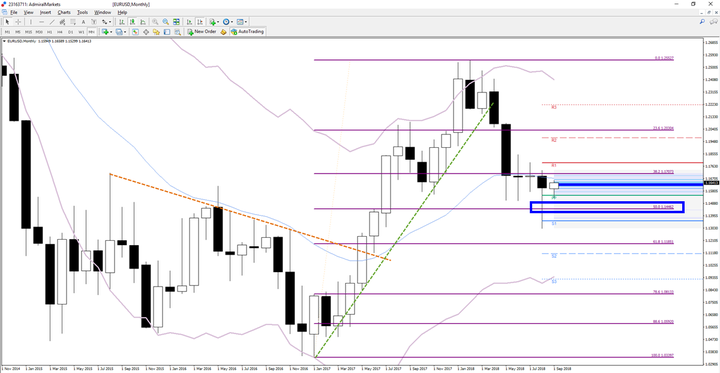
On a daily chart of the Euro Dollar, we see several key points from 2019:
- Annual maximum around 1.15676: reached in January 2019
- Resistance zone at 1.14141: second time the price touches that zone, along with the downtrend line and the 260-period EMA.
- Maximum reached at 1,11810: the price has broken the black bearish channel and marked that maximum, which has previously acted as a support area.
- Annual minimum at 1.08788: October 1, 2019
Of course, then coronavirus and extreme market volatility hit in early 2020, which led to the Euro Dollar to behave very erratically, like many global markets.
Trading EUR/USD: Analyzing the Euro Dollar Pair
There are multiple factors that impact the price movement of the EUR/USD currency pair. These factors are usually grouped together as follows:
- Fundamental analysis
- Wave, price, and technical analysis (including indicators)
Euro Dollar Fundamental Analysis
The macro economic data of a country like the US or an economic zone like the EU indicates the long-term direction of their economies. The relationship between them decides how the price of the EUR/USD currency pair behaves.
Here is a list of American and European publications that influence the price of EUR / USD and that you should consider before investing in the Euro Dollar:
- Interest rates (ECB and FED)
- Press conferences (ECB and FED)
- Unemployment rate
- The trade balance
- Non-farm payrolls (NFP)
- Inflation rates
- GDP growth rates
- Retail sales
- Durable goods orders and industrial orders.
- Business sentiment
- Consumer confidence
You can find these economic announcements, figures, statistics, and associated forecasts through our Forex calendar, if you are interested in tracking them as they are released.
To indicate whether the news is expected to be important or not, Admirals uses a color code system for indicating important (red), medium (yellow) and lower (green) impact news in its Forex Calendar.
There are a few events that will impact the entire market, which include among others, the NFP (Non-Farm Payroll) in the US, and the FOMC interest rate decision for the US.
The economic data impacts prices because it provides information about whether the US and the EU are performing better or worse in comparison with the past. This is why messages from the FED and ECB are also critical, as they convey the view of the main decision makers on the board, with regards to the current and future economic outlooks within the US and EU.
There are also expected figures that are determined beforehand, and analysts can compare the actual numbers to the expected ones, and see if there was a positive or negative change.
Fundamental analysts evaluate these factors and try to assess the directions of these numbers, and the impact they will have on each currency and currency pair.
With the fundamental analysis, traders who want to invest euro dollar focus mainly on long-term trades, which point to greater fluctuations and that could take weeks, months or even full financial quarters.
Wave, Price and Technical Analysis
The main benefit of trading the EUR/USD is that it reacts well to technical, price, and wave strategies. The good news with that is that these elements offer a large mixture of possibilities to use and create trading systems. The wide range of methods, indicators, and tools provide traders with infinite ways to tackle the market.
That being said, traders who use one or all of these three methods are usually intraday traders (who open and close in one trading day), intraweek traders (who open and close in one trading week), or swing traders (over a maximum of multiple weeks).
The trading systems are also mostly focused on five different types of scenarios:
- With the trend setups
- Breakout setups
- Bounce setups
- Reversal setups (against the trend)
- Range setups (no trend is visible)
Each of the three segments - technical, price, and wave - have their own methods and tools, although keep in mind that this can vary widely from trader to trader as well. In general, they will use the indicators to determine entry and exit spots to gain an edge and profit in the long run. The indicators help avoid spots with lower probability, and to choose zones with higher probability. This is valid in the long-term, but not case by case, because trading always remains a probability, and absolute certainty can ever be achieved.
-
Technical analysis strategies are often based on indicators such as the RSI (Relative Strength Index), ATR (Average True Range), Keltner channel, Pivot Points, MACD, and many more. They look for probable bounce or breakout spots using these indicators.
For instance, a breakout above the Keltner channel could confirm a potential EUR/USD long setup. Traders could also use the indicators for determining a pullback within the trend, or the reversal spot within a range. If you are interested in using the Keltner channel indicator, why not consider using Admirals' own Keltner channel? And see how it compares with the regular one.
- Price analysis strategies focus on understanding the sequence of bars or candlesticks to determine whether the price is likely to continue, break, bounce, or reverse. The candlestick lows, highs, opens, and closes provide critical information about price movement. For instance, a EUR/USD daily candle close that is far from the candle high could indicate exhaustion of the trend.
- Wave analysis strategies base their decision on wave patterns. For instance, an EUR/USD 4 hour chart could see a bullish wave 1-2 pattern, and price bouncing at a 61.8% Fibonacci support level. A wave trader could take a long entry at or after the reversal to try to trade the expected wave 3. Keep in mind that all strategies should work with a stop loss (or exit point if the trade goes against your expected direction) and should exercise proper risk management.
Technical Analysis
Technical analysis involves reviewing trends, patterns, support and resistance levels using indicators like MACD and Keltner's Channel and tools like trend lines and Fibonacci retracements.
Technical analysis strategies to trade the Euro Dollar are often based on indicators, these indicators look for probable rebound or break points using these indicators. For example, a breakout over the Keltner channel could confirm a possible long EUR / USD setting. Traders could also use the indicators to determine a pullback within the trend, or the reversal point within a range.
Some of the indicators to which we refer are:
- RSI (Relative Strength Index),
- ATR (Average True Range),
- Keltner's channel
- Pivot Points
- MACD and many more.
Euro Dollar Price Analysis
Trading using price action often relies on analysing Japanese candlestick patterns to understand how all factors affect price flow. These patterns can indicate whether the price is moving up or down.
Price analysis strategies for trading the EURUSD focus on understanding the sequence of bars or candles to determine whether the price is likely to continue, break, rebound, or fall.
The highs and lows reached by the price and the openings and closings of the candles provide critical information about the price movement.
For example, a daily EUR/USD candle close that is far from the maximum reached by the candle could indicate the trend exhaustion.
Wave Analysis
Wave analysis reviews price patterns using Elliott wave theory, which explains that price moves with the trend in five waves and falls in three waves. Wave analysts study waves from the past to determine current and next bullish, bearish, corrective, or impulsive waves.
The wave analysis strategy for trading the euro dollar bases its decision on wave patterns. For example, a 4-hour EUR/USD chart could see a 1-2 bullish wave pattern, and the price rebounded at a Fibonacci support level of 61.8%. A wave trade could take a long entry on or after the reversal to try to trade the expected wave 3.
How to Analyze Euro Dollar Trends
Before starting to trade with the EURUSD, or any other instrument, traders should analyse the following:
- The Euro Dollar's underlying trend
- The current trend of the EUR/USD
- The EUR/USD's price action
EUR/USD Underlying Trend
To analyse the historical trend of the dollar, it is recommended to consult larger time units to take into account the trend of the dollar over a longer term.
Therefore, before starting to operate with the euro dollar, when analysing the underlying trend of this instrument it is common to observe the trend on the daily chart. That is, the D1 trading chart to determine the upward or downward trend.

EUR/USD Current Trend
Understanding the current trend of the Euro Dollar helps us determine if it is consistent with the trend of the daily chart.
Later, you can consider smaller units of time, such as the H4 chart. In this graph each candle represents 4 hours of the market of the EUR/USD instrument.

Or even the hourly chart, where each candle represents one hour of trading the Euro against the US dollar.
The only secret is to use the same method to check whether the current trend is in line with the underlying trend or not.
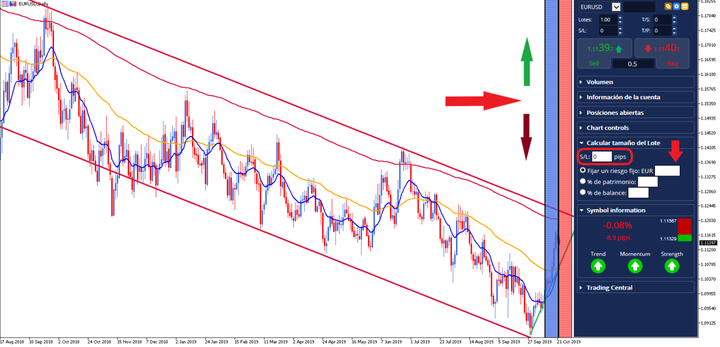
When you want to invest in EUR/USD, just use the same method to check whether or not the current trend agrees with the underlying trend. And consequently, open your buy or sell position.
In our case, the trend of the Euro Dollar on the daily chart is bearish, however in a H4 time frame it is bullish. This indicates that there is a possibility that the price will change direction and become bearish again.
Let's look at an example of analysing a 4-hour trend in the EUR / USD, comparing it to a 30-minute trend.

The time unit of the upper graph is 4 hours. As you can see, the help of 20-period exponential moving averages (in blue) and 50-period moving averages (in red) help you confirm the uptrend, which could be an indicator to start trading long in this Forex pair.
With this Forex upward trend on the rise, it only remains to move towards the 30-minute time unit to find the same averages setting for a current trend according to the underlying trend.
Euro Dollar Price Action
The information provided by the price action can help you interpret the best time to invest in the Euro Dollar, through the relationship between the current price and its maximum and minimum level.
Example:
- If the price breaks the last high, the price action indicated by the closing of the current candle shows the willingness to continue the upward movement
- If the price breaks the last low, the price action indicated by the closing of the current candle shows the willingness to continue the downward movement.
Price action is the most direct information regarding price. Remember that any other standard technical indicator is only a derivative of price, which will therefore tend to delay the movement itself.
It is also possible to complete the analysis of price action with the interpretation of the Japanese candles for trading with the EUR/USD.

In this chart, the EUR/USD shows a resistance level with the green line, and we have highlighted with the orange box an inverted candle from a Japanese hammer.
Here, the inverted hammerhead Japanese candle demonstrates a clear rejection of resistance around 1.11719.
Remember that price action signals and analyses work best near important support and resistance levels.
EUR/USD: Trading Strategy
There are three 3 main types of trading styles when it comes to trading the EURUSD:
- Scalping
- Intraday trading
- Swing trading
Scalping the EUR/USD
Scalping is a trading method where you open and close trades in a short period of time - often just a few minutes. Because the trades are so short, often you only aim to make a few pips of profit per trade. This is an advanced trading style that requires high volumes to earn a decent income.
Intraday Trading the EUR/USD
Here, the trader applies a strategy that consists of opening and closing trades within a day or the trading session. Where scalpers make trades within minutes, intraday traders generally make trades that last several hours.
The goal is to make profit only in one day as all positions must be closed before the end of the session.
Swing Trading the EUR/USD
In this approach, the trader becomes almost an investor, in the sense that he will try to take advantage of a weekly or monthly trend of the Euro Dollar without spending much time behind his trading screen.
These three 3 forms of trading also correspond to specific profiles and personalities. We'll talk about that in a moment, but we wanted to mention that the most profitable EUR/USD traders do not hesitate to use two of these approaches, sometimes even all three!
Strategies for Trading the Euro Dollar
The Euro Dollar price tends to move up and down a lot during the trading day and week, which offers opportunities for traders to benefit from the price swings. Here is how traders can capitalize on such price movements:
- Traders can enter a long or buy position if their analysis indicates that the EUR/USD has a better chance of moving up (compared to the current price) and attempt to sell at a higher price.
- Traders can enter a short or sell position if their analysis indicates that the EUR/USD has a better chance of moving down (compared to the current price) and try to buy at a lower price.
- Traders can choose not to enter the market and wait to see if their analysis indicates indecision.
There are dozens of strategies available for each analytical category. Whether you are trading based on fundamental analysis, economic data, technical analysis, price analysis or wave analysis, there are multiple ways of approaching the Forex market in general, and the EUR/USD specifically.
Besides existing methods, traders are also free to develop their own trading strategies, but be aware that all methods need to be properly tested. The best way to do conduct such research is by testing through:
- Checking your ideas in the past via a Expert Advisor (EA), and manual backtesting or
- By forward testing via a Demo account or a real trading account.
Correlation of the EUR/USD With Other Assets
Another element to consider when trading the Euro Dollar is how this currency pair correlates with other trading assets.
We remember that the correlations between these CFD instruments change over time, so it is necessary to have a reliable and practical tool such as the Admirals Expert Advisor "Correlation Matrix" to analyse these behavioral changes and extract their advantages.
This Expert Advisor is part of the MetaTrader Supreme Edition plugin available for free at Admirals.
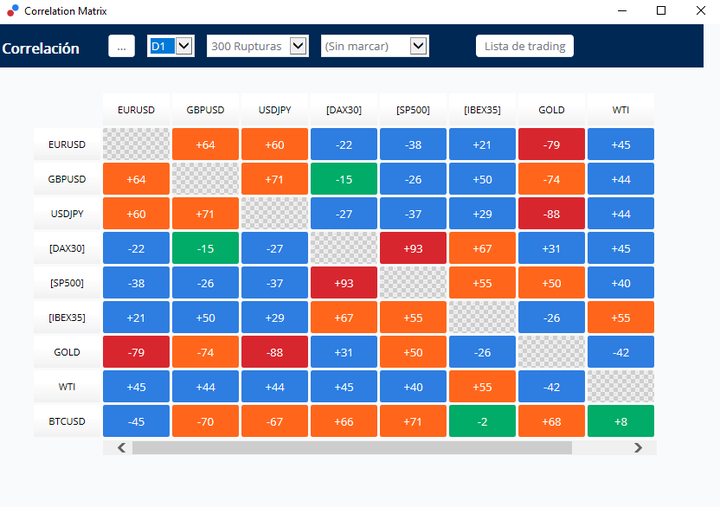
EUR/USD - GBP/USD and USD/JPY correlation
The correlation between the EURUSD and these two main Forex pairs is considered as medium (orange) and positive.
Specifically, the score is:
- +64 for GBPUSD
- +60 for USDJPY
This indicates that positions in the same direction on these symbols will tend to have similar benefits. Conversely, positions in opposite directions will tend to cancel each other out.
EUR/USD - DAX30 CFD, SP500 and IBEX35 correlation
Here, the correlation matrix shows a low correlation (blue color) with the three indices, with scores of:
- -22 for the DAX30
- -38 for the SP500
- +21 for the IBEX35
This indicates that when a movement appears in the euro dollar, the German, American and Spanish markets will tend to move independently and it will be difficult to establish any relationship between these movements.
EUR/USD - GOLD and WTI correlation
The image shows a correlation of:
- -79 with gold
- + 45 with WTI
In the case of Gold, there is a strong negative correlation with the euro dollar, that is, it is very likely that positions in the same direction on these symbols will cancel each other out. And, on the other hand, positions in opposite directions will have a similar benefit.
In the case of the WTI, some similarity could be observed between the open positions in the same direction, but of a weak nature.
EUR/USD - Bitcoin correlation
In the case of Bitcoin we find a correlation with the -45 Eurodollar.
That is, the same case as the WTI but in opposite directions.
It is important to emphasize that these data were collected on October 22, 2019, and that they vary over time.
Best Time for Trading the Euro Dollar Pair
The Forex market, including the Euro/Dollar pair, is open for 24 hours a day, 5 days a week. There are only two non-trading days per week, or 48 hours where the market is closed.
Traders can start trading with Admirals on Sunday at midnight until Friday at 9:00 PM (EET).
The best time for trading the Euro Dollar, just like any other currency pair, is to trade it when the market is active, which means that there is the presence of decent price volatility and movement.
Currency pairs tend to be more active when one or both of the currencies are operating in the usual business, and the stock market hours of that country or economic zone. Here is an overview:
- The Euro for instance, is most active between 8am to 4pm EET.
- The same is true for the US Dollar which is most active between 8am EET to 4pm EET.
- There is a two to three hour overlap when both the European and the American market are open, which tends to offer a period with the most volume and volatility.
Generally speaking, the Euro Dollar strategies can be best traded between 7am GMT till about 8pm GMT, which is when the chart shows the most price volatility. Before and after the price movement slows down significantly. But the best period appears to be the overlapping hours between 12pm GMT to about 3pm GMT when the markets in the US, London, and Europe are open.
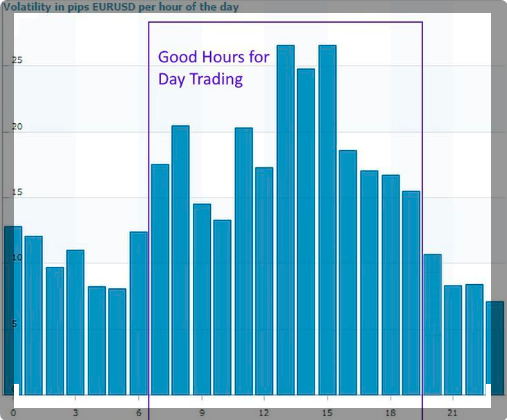
The higher volatility is especially useful for traders that trade:
- With the trend
- Breakout setups
- Intraday Euro Dollar trading strategies
The lower volatility periods could still be interesting to trade in the following two cases:
- A trader creates a special strategy tailor made to this environment, which often means trading ranges and false breaks
- A trader finds an entry at an earlier spot before the market activity increases
Although the usual time when price moves remains more or less stable over time, the volatility of the price does fluctuate on a daily, weekly, and monthly basis. At certain times, the Euro Dollar will move more or less due to changes in factors impacting the currency pair:
- News events
- Releases of economic data
- Press conferences of Central Bankers
- Changes in macro economic outlook
- Technical analysis aspects
- Chart patterns and wave patterns
Best Platform for Trading EUR/USD
The best euro-dollar trading platform for trading the Euro Dollar currency pair is arguably MetaTrader Supreme Edition. The MetaTrader (MT) platform offers a charting platform that is easy to use and navigate. Traders can view the EUR/USD currency pair, and a wide range of other financial instruments, including CFDs, commodities, and stock indexes.
The Supreme Edition plugin from Admirals offers a long list of extra indicators and tools that are not a standard part of the usual MetaTrader package. The additional features include, but are not limited to, the sentiment trader, the mini terminal, the trade terminal, the tick chart trader, the trading simulator, mini charts perfect for multiple time frame analysis, and an extra indicator package including Pivot Points and the Keltner Channel.
How to buy EUR/USD on MetaTrader
Trading EUR/USD has become very simple, here are the steps to follow to place a purchase order:
- Connect to the MT5 trading platform.
- Click the "New Order" shortcut located in the toolbar at the top left of the MetaTrader trading station
- Select "EURUSD, Euro vs. US Dollar" in the "Symbol" field
- Choose the size of your position in the "Volume" space
- Click on the blue button "Buy in the market"
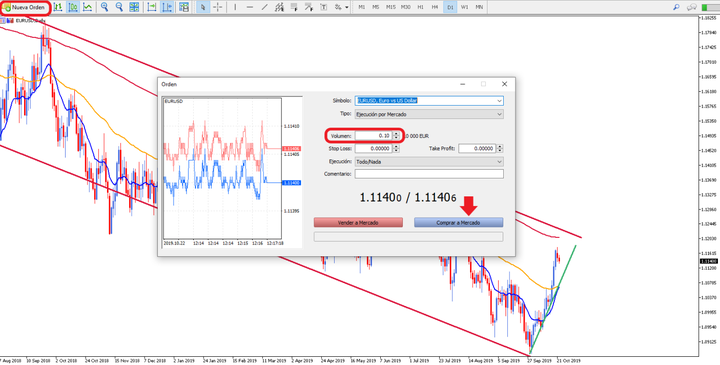
Before trading EuroDollar on MetaTrader, we always recommend placing a Stop Loss to limit your risk, and possibly a Take Profit, to get your profits if the price hits its target without touching the Stop Loss.
To do this, you must:
- Enter the Stop Loss price level in the "Stop Loss" area
- Enter the Take Profit price level in the "Take Profit" field
Let's take a look at these steps to do trading with euro dolar

As in the illustration above, it is also possible to place Stop Loss and Take Profit once the position is open with a simple movement of the position line.
Here is an example for a buy position:
- If you pull the EUR / USD order line down, the Stop Loss will be placed at the price level at which it will stop.
- If you pull the long line of the euro dollar position up, we will place the Take Profit at the price level where we want to make the profit.
If you decide to trade with the euro dollar, or any other instrument, risk and money management are essential, which is why Admirals offers you an Expert Advisor Mini Terminal. This tool will help you:
- Calculate the number of lots according to the size of the Stop Loss
- Help carry out pending trades above or below the current EUR / USD rate if you cannot stay in front of your Trading screen
How to sell EUR/USD on MetaTrader
In the event that we are in a downtrend, the steps to follow would be the following:
- Connect to the MT5 trading platform.
- Click the "New Order" shortcut on the toolbar at the top left of the MetaTrader trading station
- Select "EURUSD, Euro vs. US Dollar" in the "Symbol" field
- Choose the size of your position in the "Volume" space
- Click the red "Market Sale" button
Technical indicators to operate with EUR/USD
There are a large number of technical indicators, although it is better to use a few to avoid overloading your analysis of the euro dollar.
Let's see a concrete example!
- If you use 12 indicators, you will have too many conflicting signals, preventing you from taking a position or receiving false signals.
- On the other hand, the use of 2 to 4 indicators of different types (trends, oscillators ...), together with the price analysis itself, can increase the relevance of a trading signal in the euro-dollar.
Using the right tools is also essential. The MetaTrader Supreme Edition includes a large number of technical indicators that will help you invest in the euro dollar in MetaTrader.
Which Broker to Choose?
A broker is a financial intermediary that will allow you to access the market when you want to take advantage of a potential movement identified through your analysis and activated according to your own strategy to invest with the euro dollar.
And one of the best brokers (at least, we like to think so) is Admirals. When trading the Euro Dollar pair, here are just some of the conditions you can expect when trading with us:
- FCA Regulations in London
- Unlimited negative balance protection for Retail clients and limited to £50,000 for Professional clients
- Client funds are deposited into segregated accounts at Barclays Bank in London
- Leverage up to 1:30 for Retail clients, and 1:500 for Professional clients
- Typical Competitive Spread: 0.00008 pips
- Ultra-fast order execution
- No commission on the entry and exit of a euro dollar position.
- At Admirals the operating costs for scalping and intraday traders at Admirals are limited to the spread.
- Professional trading platform: MetaTrader 4 and 5 and Supreme Edition.
- Free online training, webinars and articles
- Customer service in more than 20 languages.
Conclusion: Investing in the EUR/USD
The euro dollar is the currency most traded for the following reasons:
- It is accessible to everyone with leverage.
- It has high daily volatility, creating many trading opportunities
- Available 24 hours a day and 5 days a week to operate at the times that suit you best.
- Strong liquidity of the euro dollar, which avoids order execution problems.
- Without restrictions, there is no minimum distance for Stop Loss or a limitation regarding trading styles or strategies.
Do you want to practice your trading, without putting any of your funds at risk, under real market conditions? Register for a free demo account and hone your skills before entering the live market! Click the link below for more:
Frequently Asked Questions
What is EUR/USD trading?
EUR/USD trading involves buying and selling the Euro (EUR) against the US Dollar (USD) in the foreign exchange (forex) market. Traders aim to profit from fluctuations in the exchange rate between these two currencies.
How does the exchange rate work?
The exchange rate represents how much one unit of the base currency (EUR) is worth in terms of the quote currency (USD). For example, an exchange rate of 1.1500 means 1 Euro is equivalent to 1.15 US Dollars.
Who participates in EUR/USD trading?
Various participants engage in EUR/USD trading, including banks, corporations, governments, and individual traders. The forex market operates 24/5, providing continuous trading opportunities.
Other articles you may find interesting:
- Short-Term Forex Trading Strategies
- How to Start Forex Trading Guide 2026
- The Bollinger Bands Strategy Guide
INFORMATION ABOUT ANALYTICAL MATERIALS:
The given data provides additional information regarding all analysis, estimates, prognosis, forecasts, market reviews, weekly outlooks or other similar assessments or information (hereinafter “Analysis”) published on the websites of Admiral Markets investment firms operating under the Admiral Markets and Admirals trademarks (hereinafter “Admirals”). Before making any investment decisions please pay close attention to the following:
1. This is a marketing communication. The content is published for informative purposes only and is in no way to be construed as investment advice or recommendation. It has not been prepared in accordance with legal requirements designed to promote the independence of investment research, and that it is not subject to any prohibition on dealing ahead of the dissemination of investment research.
2. Any investment decision is made by each client alone whereas Admirals shall not be responsible for any loss or damage arising from any such decision, whether or not based on the content.
3. With view to protecting the interests of our clients and the objectivity of the Analysis, Admirals has established relevant internal procedures for prevention and management of conflicts of interest.
4. The Analysis is prepared by an independent analyst (hereinafter “Author”) based on the personal estimations of Alexandros Theophanopoulos (SEO and Content Specialist).
5. Whilst every reasonable effort is taken to ensure that all sources of the content are reliable and that all information is presented, as much as possible, in an understandable, timely, precise and complete manner, Admirals does not guarantee the accuracy or completeness of any information contained within the Analysis.
6. Any kind of past or modeled performance of financial instruments indicated within the content should not be construed as an express or implied promise, guarantee or implication by Admirals for any future performance. The value of the financial instrument may both increase and decrease and the preservation of the asset value is not guaranteed.
7. Leveraged products (including contracts for difference) are speculative in nature and may result in losses or profit. Before you start trading, please ensure that you fully understand the risks involved.