Forex Trading for Beginners [2026 Guide]
Forex trading, also known as foreign exchange trading, refers to the speculation on the direction of global currency pairs. For beginners, it can feel overwhelming to know how to start and what to do.
In this Forex trading for beginners guide, you will learn how the currency market works, understand key terminology every trader should know, discover three Forex strategies to start with and the pros and cons of trading the currency market.
This material is for informational purposes only and not financial advice. Consult a financial advisor before making investment decisions.
Table of Contents
- What is Forex Trading?
- How to Learn Forex Trading as a Beginner in 5 Steps
- Essential Forex Terms for Beginners
- How to Trade Forex: Chart Types Explained
- Risk Management Forex Tutorial
- Learn Forex: 3 Strategies for Beginners
- Choosing the Right Forex Strategy
- Top 10 Forex Trading Tips for Beginners
- Final Thoughts
- Frequently Asked Questions
What is Forex Trading?
Forex trading involves buying and selling currencies to try and profit from changing exchange rate fluctuations. The Forex market is the largest and most liquid financial market in the world, operating 24 hours a day, five days a week.
While currency pairs such as EUR/USD or GBP/JPY are traded by institutions, governments and businesses, retail traders can also trade them using a Forex broker. Trying to profit from trading the currency market is very difficult and takes time to learn how to do it. Consider using a demo trading account first, which allows you to trade in a virtual environment to practice your skills before using real money.
How hard is forex trading? Extremely hard! Forex trading requires strong technical and emotional skills and is not suitable for everyone.
How to Learn Forex Trading as a Beginner in 5 Steps
A common question among beginners is 'how to become a forex trader?' It has to start with learning how to trade the Forex market, ensuring you have a solid education and a step-by-step process, as highlighted below. However, it's also important to know that Forex trading carries significant risks, and beginners should ensure they fully understand these risks before starting.
- Start with a Demo Account: Practice on a demo account so you can trade with virtual funds without risking your money.
- Master Your Trading Platform: Use platform tutorials to get comfortable with using MetaTrader 4 (MT4) or MetaTrader 5 (MT5), which are common trading platforms for Forex traders.
- Learn Price Action, Charts and Indicators: There are many different tools used to trade the Forex market. Educate yourself using a trading academy and review as many articles and videos as possible.
- Build a Trading Plan: A trading plan should include a routine and a list of rules and conditions for knowing when to execute a trade and when to stay out of the market.
- Exercise Proper Risk Management: It is crucial to ensure you have the correct position size on each trade and know how much you could win or lose. Use a trading calculator to help.
Let's start your Forex trading education by detailing some of the most important Forex terms to know.
Essential Forex Terms for Beginners
Here are some common terms regarding the Forex market.
1. Spot Forex
This form of Forex trading involves buying and selling the real currency. For example, you can buy a certain amount of pounds sterling and exchange it for euros, and then once the value of the pound increases, you can exchange your euros for pounds again, receiving more money compared to what you originally spent on the purchase.
2. CFDs
The term CFD stands for "Contract for Difference." You can learn more in the 'CFD Trading for Beginners Guide.' Essentially, it is a contract used to represent the movement in the prices of financial instruments.
Traders can buy or sell contracts in different financial instruments, without owning the underlying asset. As this method involves trading a derivative of a financial instrument, it enables traders to trade long and short.
CFDs are complex instruments and come with a high risk of losing money rapidly due to leverage. Ensure you understand how CFDs work and whether you can afford to take the high risk of losing your money.
3. Pip
A pip is the base unit in the price of the currency pair, which is typically 0.0001 of the quoted price, in non-JPY currency pairs. So, when the price for the EUR / USD pair goes from 1.14988 to 1.14998, that represents a difference of 1.0 pip.

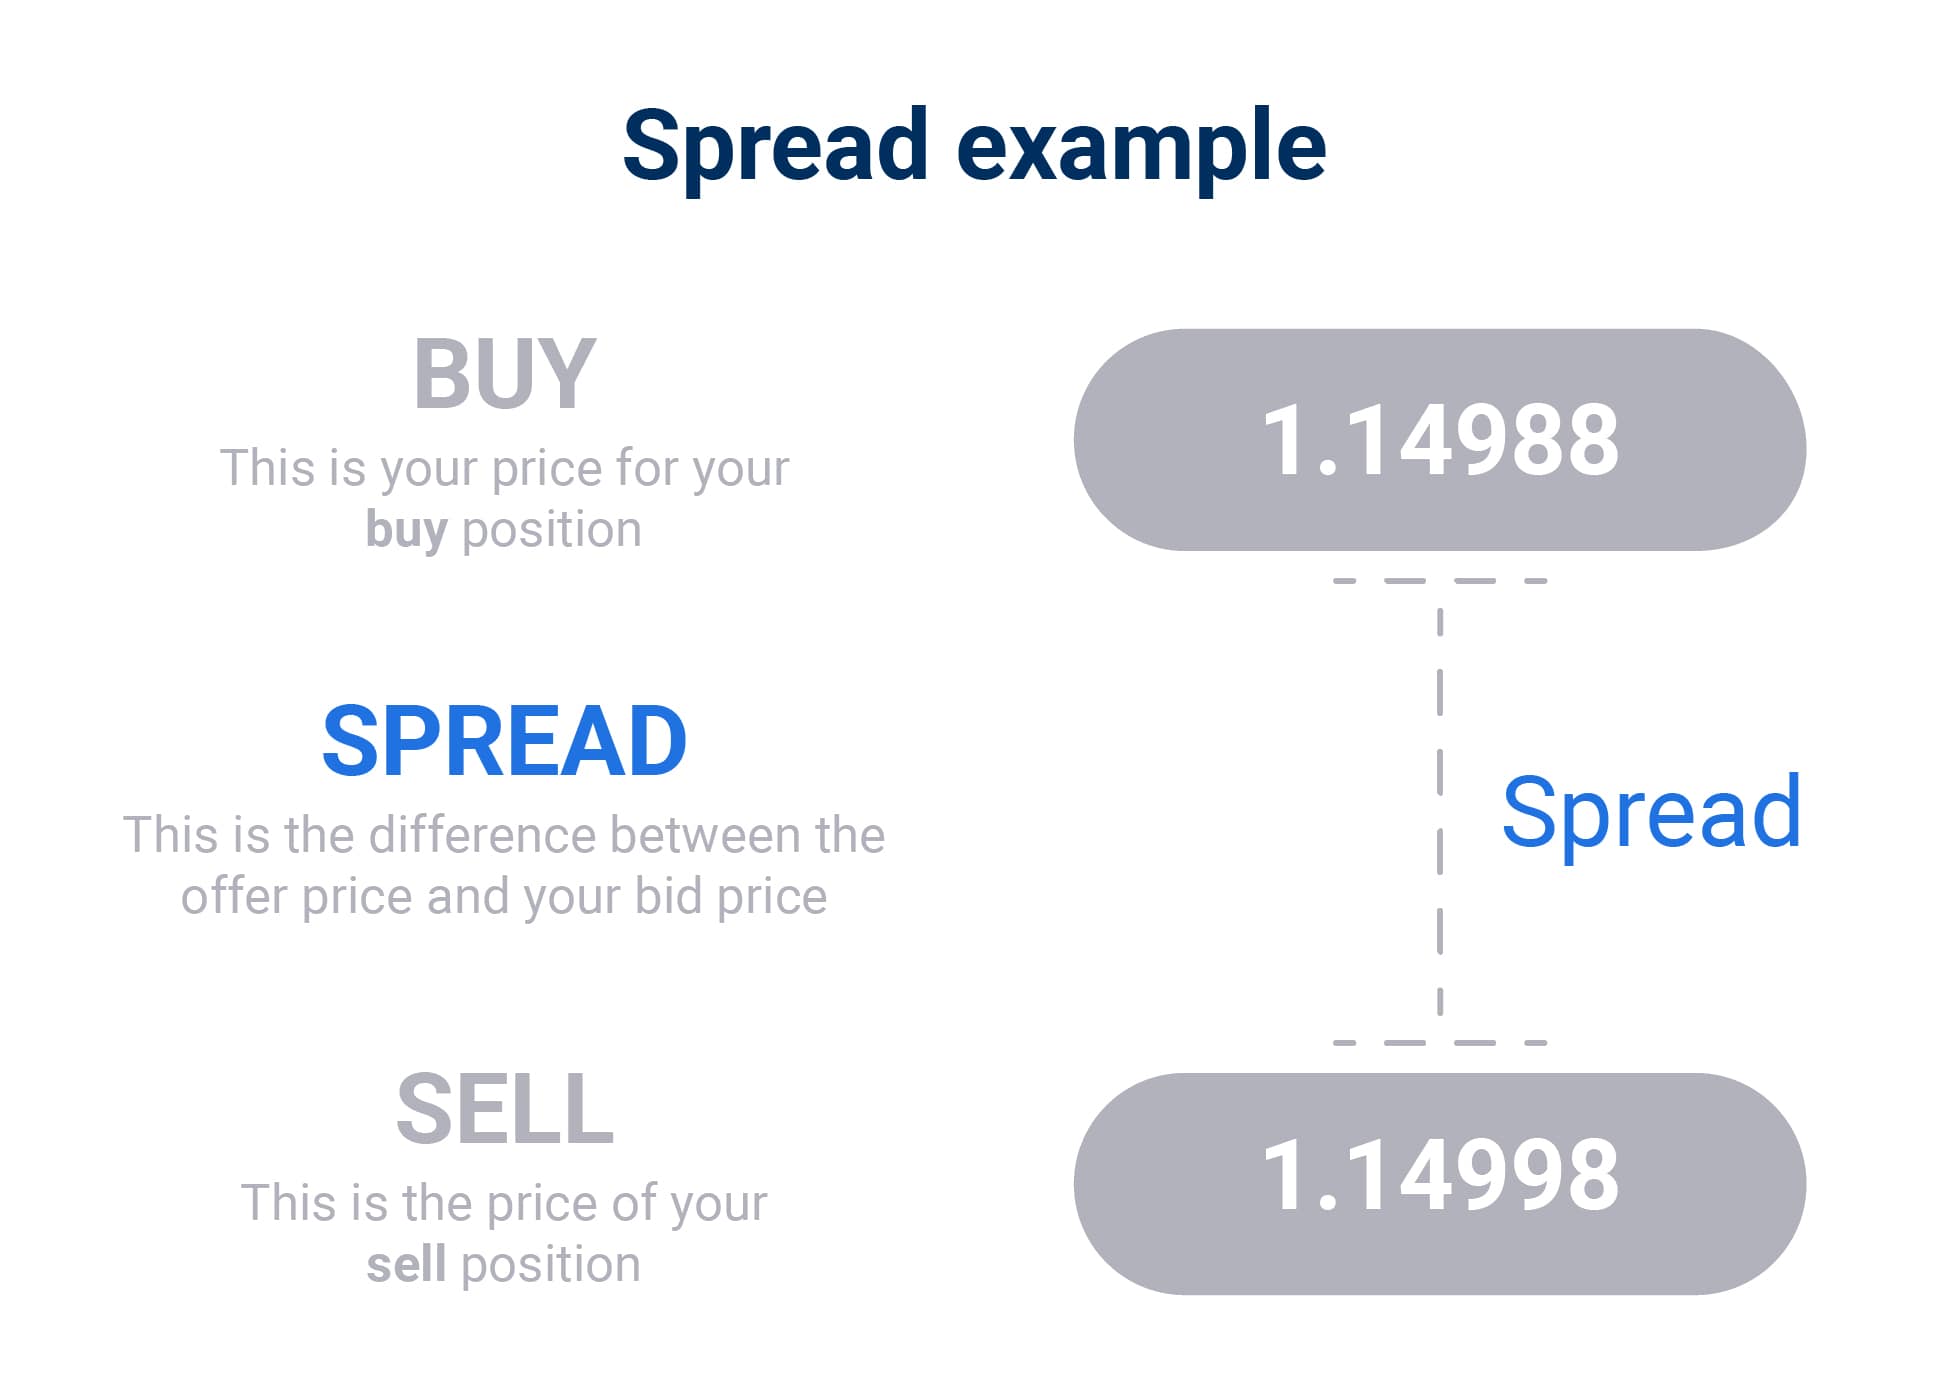
4. Spread
The spread is the difference between the purchase price and the sale price of a currency pair. For the most popular currency pairs, the spread is often low, sometimes even less than a pip! For pairs that don't trade as often, the spread tends to be much higher. Before a Forex trade becomes profitable, the value of the currency pair must exceed the spread.
5. Leverage
Leverage refers to the ability to open a larger position size using smaller capital. For example, if a broker offers 1:30 leverage on a Forex pair, this means with $1, you can control a position size worth $30.
However, as your profit and loss are based on what the position size is worth, leverage has the effect of amplifying both profits AND losses. Leverage can result in rapid losses and should only be used with full awareness of its risks. Losses can exceed deposits.
6. Margin
Margin is the amount of capital required to open a trade. For example, if a broker offers 1:30 leverage on a Forex pair, this means you would need 3.33% in margin to open a position (1/30 * 100). Therefore, to open a $10,000 position, you would need $333 to be held as margin in your account to do so.
7. Long
A long trade refers to a trader buying a currency pair on the expectation that the exchange rate will rise in value.

8. Short
A short trade refers to a trader selling a currency pair on the expectation that the exchange rate will fall in value.
Learn more in this 'Beginner's Guide to Forex Terminology' video, produced by our in-house analysts. This resource is for educational purposes only and does not constitute trading advice.
How to Trade Forex: Chart Types Explained
Once you open a brokerage account, you can access a trading platform which will provide a chart of the different financial instruments available. These charts are used as visual tools to analyse price movements.
Let's have a look at some of the most common chart types available for beginners.
Line Charts

A line chart connects the closing prices of the time frame you are viewing. So, when viewing a daily chart, the line connects the closing price of each trading day. This is the most basic type of chart used by traders. It is mainly used to identify bigger picture trends, but does not offer much else, unlike some of the other chart types.
OHLC Bar Charts

An OHLC bar chart shows a bar for each time period the trader is viewing. So, when looking at a daily chart, each vertical bar represents one day's worth of trading. The bar chart is unique as it offers much more than the line chart, such as the open, high, low and close (OHLC) values of the bar.
The dash on the left represents the opening price, and the dash on the right represents the closing price. The high of the bar is the highest price the market traded during the time period selected. The low of the bar is the lowest price the market traded during the time period selected.
- The green bars are known as buyer bars, as the closing price is above the opening price.
- The red bars are known as seller bars, as the closing price is below the opening price.
In either case, the OHLC bar charts help traders identify who is in control of the market - buyers or sellers. These bars form the basis of the next chart type called candlestick charts, which is the most popular type of Forex charting.
Candlestick Charts

Candlestick charts were first used by Japanese rice traders in the 18th century. They are similar to OHLC bars in that they also give the open, high, low and close values of a specific time period. However, candlestick charts have a box between the open and close price values. This is also known as the 'body' of the candlestick.
Many traders find candlestick charts the most visually appealing when viewing live Forex charts. They are also very popular as they provide a variety of price action patterns used by traders all over the world. You can learn more about these patterns in the '16 Candlestick Patterns to Know' article.
Risk Management Forex Tutorial
Learning how to trade Forex for beginners also means understanding risk and ensuring you can handle the unpredictable distributions of wins and losses. Here are some vital principles to consider:
- Use Stop Loss Orders: These automatically close a trade at a user-defined price level to limit losses.
- Risk No More Than 1–2% per Trade: Protect your capital and ensure you can handle a string of losses.
- Avoid Overleveraging: Higher leverage can amplify losses, causing you to lose a large portion of your trading account.
- Create a Plan and Follow the Plan: Systemising the trading process and analysis helps to avoid making emotional decisions based on fear or greed.
- Use a Trading Calculator: By inputting your entry, stop loss and take profit levels into a trading calculator, you can find the correct position size for yourself and know how much you could potentially win or lose.
Learn Forex: 3 Strategies for Beginners
Knowing how to start Forex trading involves exploring different trading approaches. There are many different types of trading strategies available. Each strategy has its own risk profile, time commitment, and suitability depending on the trader’s goals and experience.
Below are three commonly used Forex trading strategies that beginners often explore. These are not recommendations, but rather overviews to help new traders understand their options.
These strategies are for educational purposes only and may not be suitable for all traders. Beginners should practice these strategies on a Demo account before trading with real money.
1. Scalping
Scalping is a short-term trading strategy that involves executing a high volume of trades over very small timeframes - often seconds to minutes.
Key Characteristics:
- Requires constant market monitoring.
- Typically involves using technical indicators or algorithms.
- Relies on fast execution and low spreads.
- Timeframes: M1, M5
2. Day Trading
Day trading involves opening and closing positions within the same trading day. The objective is to speculate on short-term market movements, typically over a few hours, without holding positions overnight.
Key Characteristics:
- Positions are not held after market close, reducing overnight risk.
- Often relies on economic news, technical analysis, or intraday trends.
- Requires access to real-time market data and efficient order execution.
- Timeframes: M15, M30, H1, H4
3. Swing Trading
Swing trading seeks to capture medium-term trends in the market by holding positions for several days or even weeks. This strategy involves trading different market conditions like trends, reversals and breakouts.
Key Characteristics:
- Trades are based on both technical and fundamental analysis.
- Less time-intensive than scalping or day trading.
- Timeframes: H4, D, W, M
Choosing the Right Forex Strategy
When starting Forex trading for beginners, it's important to take time and consider which strategy you will focus on. Here are some key questions to ask:
- Time availability – How often can you monitor the markets?
- Risk tolerance – Are you comfortable with short-term volatility or longer holding periods?
- Capital – Some strategies may require higher capital due to frequent trading or wider stop losses.
For most beginner traders, learning Forex trading requires some trial and error, as you won't know what will work for you until you try it. This is where a demo account is useful in how to learn Forex trading, as it allows you to practice different strategies with virtual funds without risking your money.
Remember, no strategy guarantees success, and past performance is not indicative of future results.
Top 10 Forex Trading Tips for Beginners
- Educate Yourself Continuously
- Practice with a Demo Account
- Start Small and Scale Gradually
- Track Every Trade in a Journal
- Learn Technical and Fundamental Analysis
- Control Emotions While Trading
- Limit Risk Per Trade
- Evaluate Your Performance Regularly
- Set Realistic Expectations
- Protect Your Capital
Final Thoughts
A common question among beginners is 'how can I learn forex trading for free?' For beginners to start trading, it is important to have a strong foundation of knowledge, the risks involved and consistent practice in executing a strategy. Use this guide to get started, but continue to refine your skills, stay updated with market news, and educate yourself.
Continue reading...
- CFD Trading for Beginners
- Beginner's Guide to Different Types of Stocks
- 6 Top Trading Strategies
- Learn the 1 Minute Forex Scalping Strategy
- Admirals Dashboard Tutorial: Supercharge Your Experience
Frequently Asked Questions
What is Forex trading?
Forex trading is the act of buying one currency while simultaneously selling another in the foreign exchange market to try and profit from exchange rate price fluctuations.
Is Forex trading good for beginners?
Forex trading is difficult and should be approached with proper education, risk management, and realistic expectations. Always begin with a demo account.
How do I start Forex trading?
Start by educating yourself, choosing a regulated broker, opening a demo account, and developing a trading strategy.
What are the risks in Forex trading?
Risks include market volatility, leverage-related losses, and emotional decision-making. Using stop-loss orders and sound strategies can mitigate risk but not eliminate it.
Can I teach myself to trade Forex?
There are many Forex tutorials, articles and videos available to learn how to trade the Forex market. However, it is important to have a plan, set realistic expectations and give yourself time to learn.
INFORMATION ABOUT ANALYTICAL MATERIALS:
The given data provides additional information regarding all analysis, estimates, prognosis, forecasts, market reviews, weekly outlooks or other similar assessments or information (hereinafter “Analysis”) published on the websites of Admirals' investment firms operating under the Admirals trademark (hereinafter “Admirals”). Before making any investment decisions, please pay close attention to the following:
1. This is a marketing communication. The content is published for informative purposes only and is in no way to be construed as investment advice or recommendation. It has not been prepared in accordance with legal requirements designed to promote the independence of investment research, and that it is not subject to any prohibition on dealing ahead of the dissemination of investment research.
2. Any investment decision is made by each client alone whereas Admirals shall not be responsible for any loss or damage arising from any such decision, whether or not based on the content.
3. With view to protecting the interests of our clients and the objectivity of the Analysis, Admirals has established relevant internal procedures for prevention and management of conflicts of interest.
4. The Analysis is prepared by an analyst (hereinafter “Author”). The Author, Jitanchandra Solanki, is an employee of Admirals. This content is a marketing communication and does not constitute independent financial research.
5. Whilst every reasonable effort is taken to ensure that all sources of the content are reliable and that all information is presented, as much as possible, in an understandable, timely, precise and complete manner, Admirals does not guarantee the accuracy or completeness of any information contained within the Analysis.
6. Any kind of past or modeled performance of financial instruments indicated within the content should not be construed as an express or implied promise, guarantee or implication by Admirals for any future performance. The value of the financial instrument may both increase and decrease, and the preservation of the asset value is not guaranteed.
7. Leveraged products (including contracts for difference) are speculative in nature and may result in losses or profit. Before you start trading, please ensure that you fully understand the risks involved.
![How to Start Forex Trading | How Much Do You Need in [2026]](https://dynamic-images.admiralmarkets.com/800x,webp/fxmedia.s3.eu-west-1.amazonaws.com/featured_images/68655ae67d5331751472870.jpeg)