Bollinger Bands Strategy Guide
Bollinger Bands are a popular and versatile technical indicator, which can be used to assess market volatility as well as to help spot overbought and oversold levels.
In this article, we will explain what Bollinger Bands are, how they are calculated and how to interpret them. We will also provide 3 examples of Bollinger Band strategies to demonstrate how the indicator can be used in the markets.
The information in this article is provided for educational purposes only and does not constitute financial advice. Consult a financial advisor before making investment decisions.
Bollinger Bands Explained
Bollinger Bands are a technical indicator which can be used by traders to gauge an asset’s volatility and ascertain whether its price is relatively high or relatively low.
The indicator itself consists of three lines: an upper band, a middle line and a lower band.
The middle line is a Simple Moving Average, which is typically set to 20 periods by default. The upper and lower bands are plotted by a certain number, typically two, of standard deviations away from the moving average.
| Standard Deviation: A statistical measurement of how much the values in a data set vary from the mean average. The higher the standard deviation, the more spread out data points are from the mean. It is often used to measure volatility. |
What This Means
- The upper Bollinger Band highlights a level that is statistically high relative to the moving average. When price approaches or touches this level, the market might be interpreted as overbought.
- The lower Bollinger Band highlights a level that is statistically low relative to the moving average. When price approaches or touches this level, the market might be interpreted as oversold.
- The width of the Bollinger Bands reflects the level of volatility in the market.
- When volatility increases, the bands widen.
- When volatility decreases, the bands tighten.
How to Use Bollinger Bands in MetaTrader 5
Bollinger Bands are typically included as standard in many trading platforms, including MetaTraders 4 and 5.
In both MetaTrader platforms, the Bollinger Bands indicator can be found in the Indicators Trend folder in the Navigator window on the left of the screen.
If you double click the indicator, or drag it onto the chart window, you will be presented with the Bollinger Bands settings window, which is shown below.
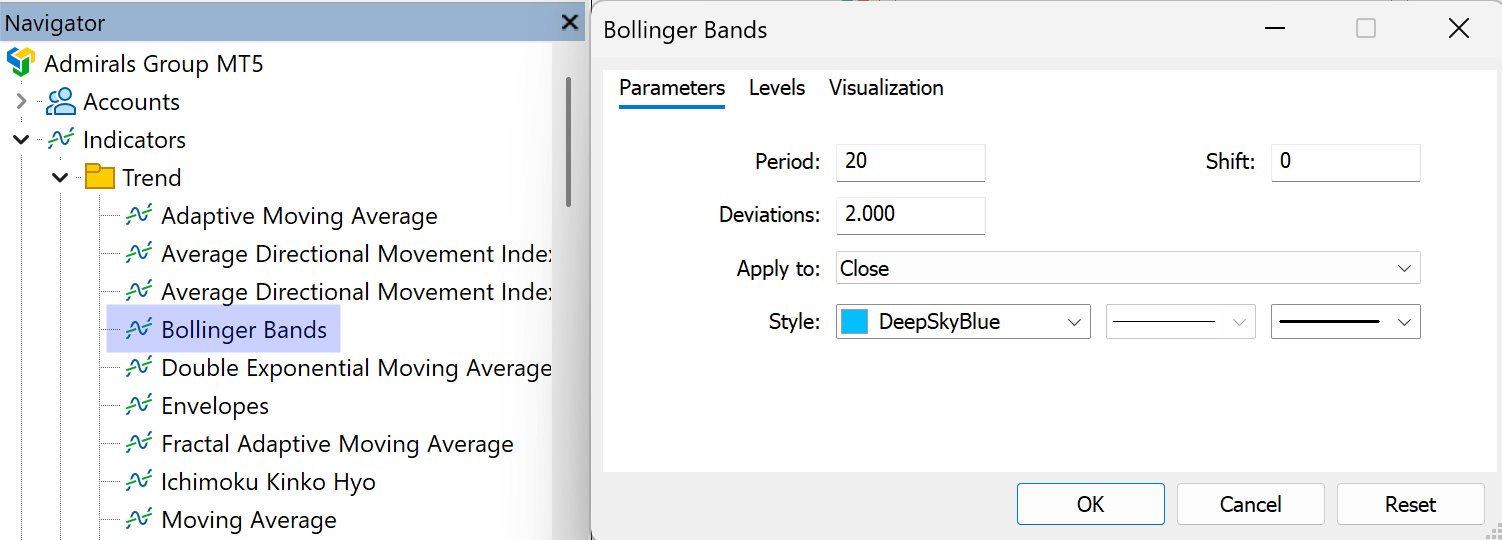
The above settings will be filled out by default, but traders can choose to amend these if they wish, before clicking ‘OK’ to add the indicator to the chart. For beginners, it might be a good idea to try the default settings before experimenting with different options.
Bollinger Band Strategy Examples
Now that we better understand what Bollinger Bands are and how they work, let’s take a look at some examples of Bollinger Bands strategies, to demonstrate how the indicator might be used by traders.
Please note that the strategies outlined in the following sections are examples and have not been tested in live conditions.
Double Bollinger Band Strategy
As the name suggests, the Double Bollinger Bands strategy uses two sets of Bollinger Bands on a single price chart.
The first set of Bollinger Bands uses the default settings, a 20-period moving average with the upper and lower bands plotted two standard deviations away (20,2).
The second set of Bollinger Bands leaves the period as 20 but changes the number of deviations to just one (20,1). In the chart below, the first, wider set of bands (with the default settings) are blue, whilst the second, narrower set are red.
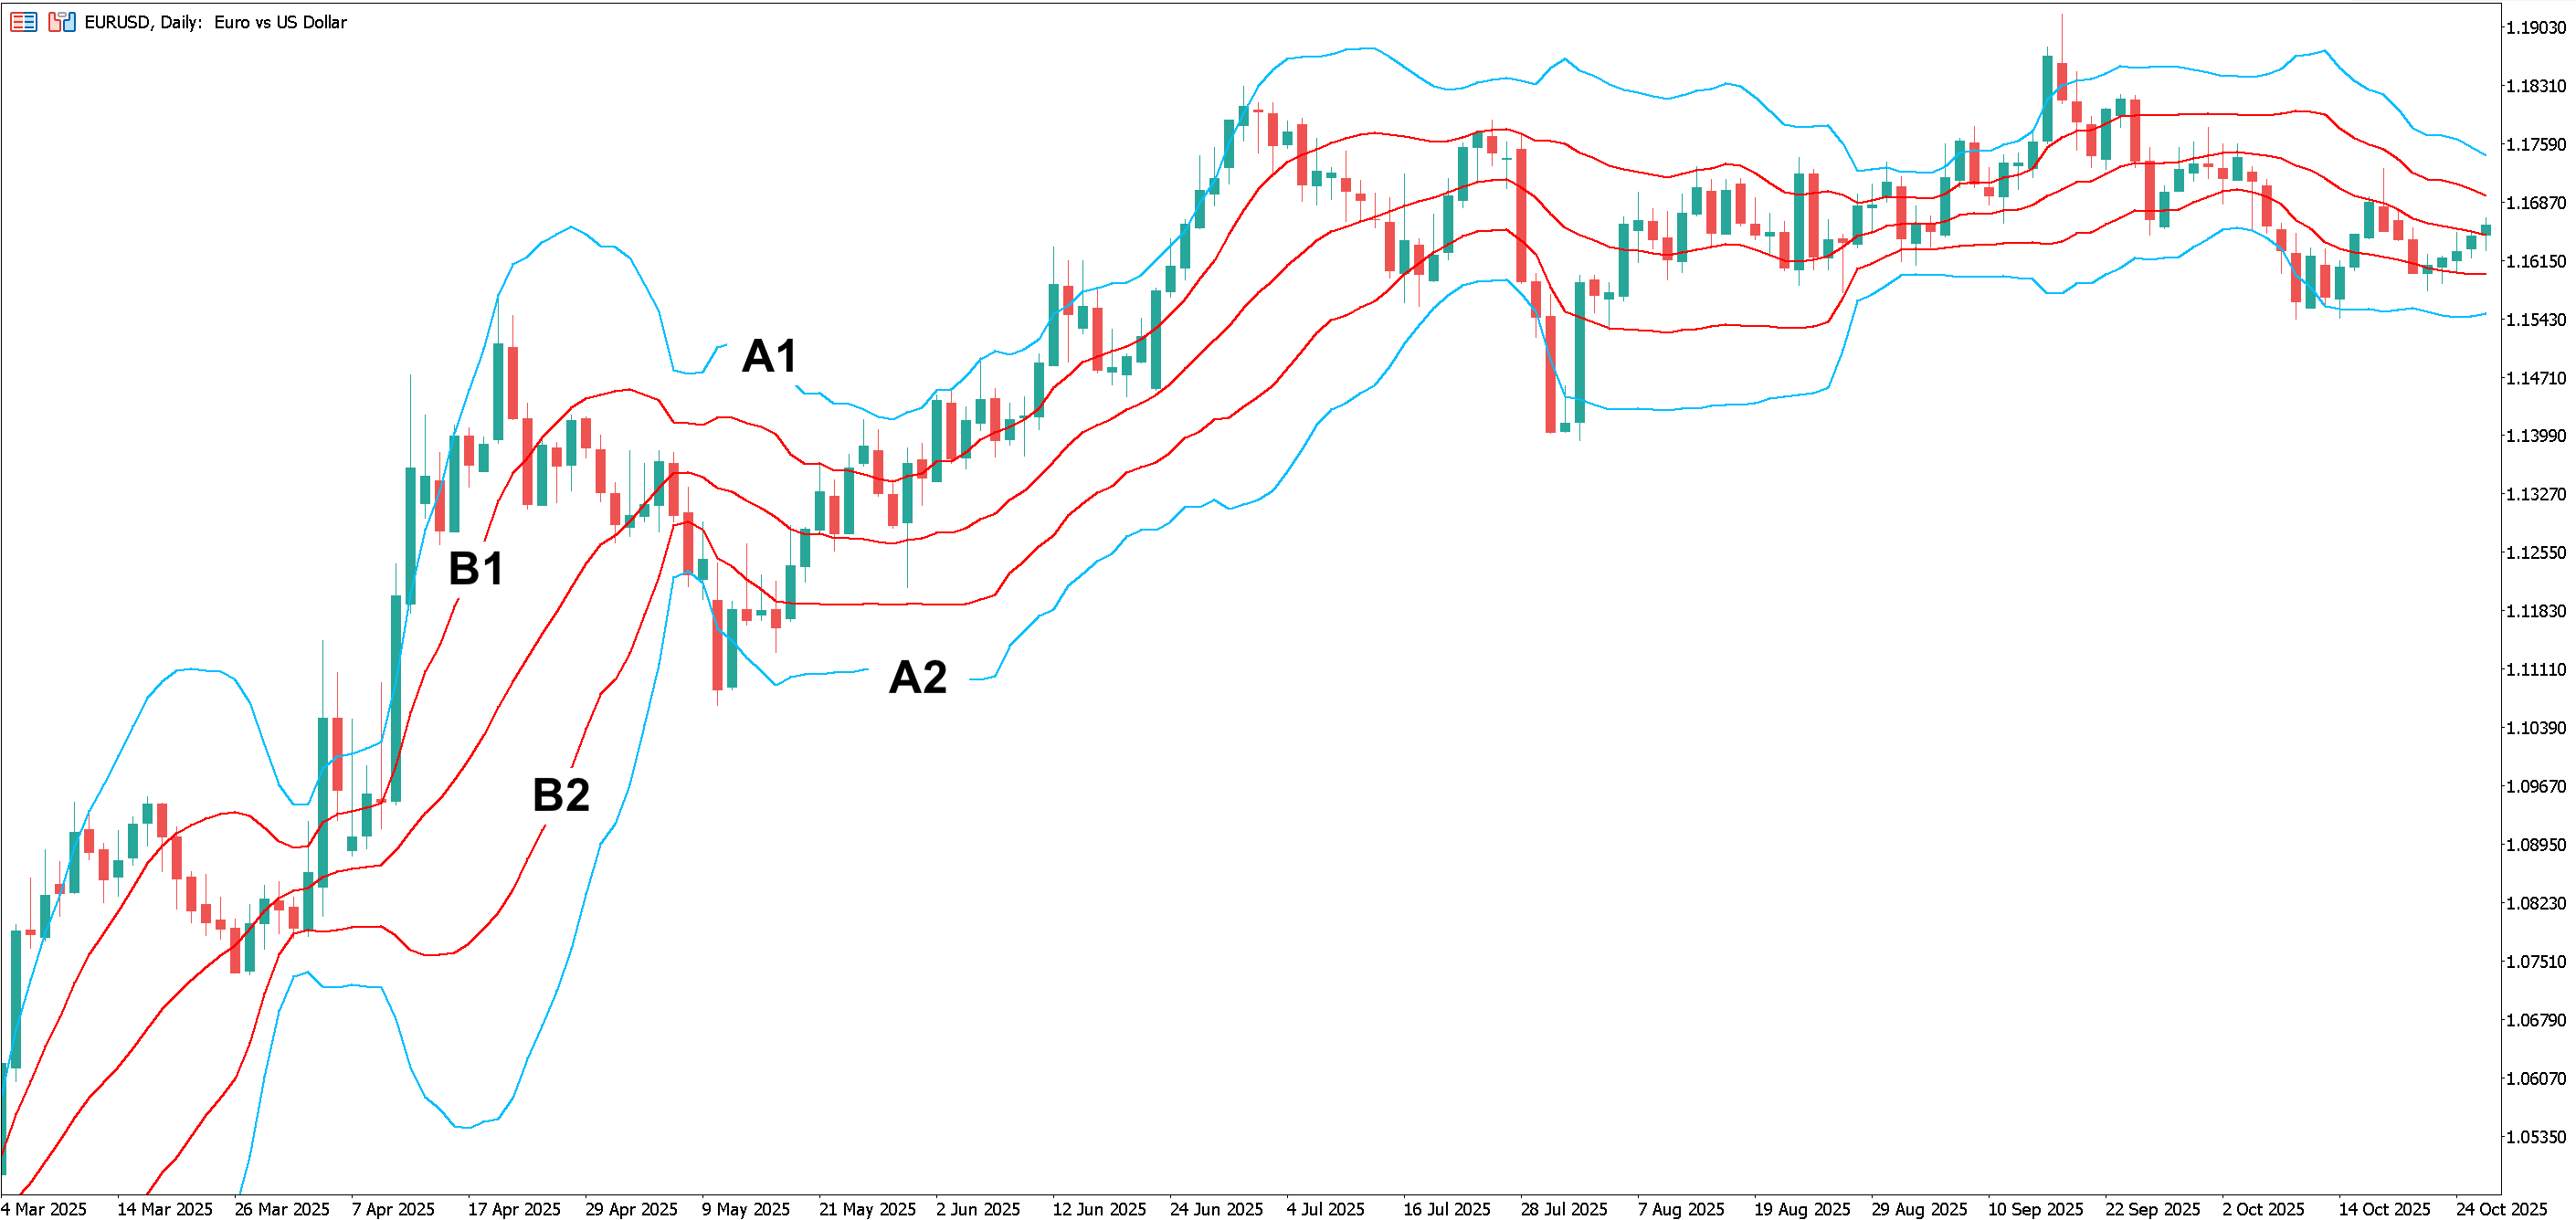
We’ve marked the outer bounds of the blue Bollinger Bands as A1 and A2 and the outer bounds of the red Bollinger Bands as B1 and B2.
Proponents of the Double Bollinger Band Strategy identify three zones:
- The ‘Buy Zone’ is between A1 and B1.
- The ‘Neutral Zone’ is between B1 and B2.
- The ‘Sell Zone’ is between B2 and A2.
When the price is in the buy zone it indicates that the current uptrend is strong, when it’s in the sell zone it implies that the current downtrend is strong. When the price is in the neutral zone, it suggests that there is no clear trend.
Generally speaking, when the price is in:
- The buy zone, traders might interpret this as a potential signal to consider long positions.
- The sell zone, traders might interpret this as a potential signal to consider short positions.
- The neutral zone, traders might prefer to wait for a signal before considering their next move.
Bollinger Bounce
One characteristic you might notice about Bollinger Bands is that price often tends to return to the middle band, treating the lower and upper bands as areas of support and resistance, respectively.
A Bollinger Bounce strategy is based on mean reversion, the idea that after the price approaches or touches the outer bands, it could bounce and return towards its moving average.
For instance, look at the weekly chart of USDCHF below. For an extended period, each time price touches the outer bands, it reverses course and heads back towards the moving average.
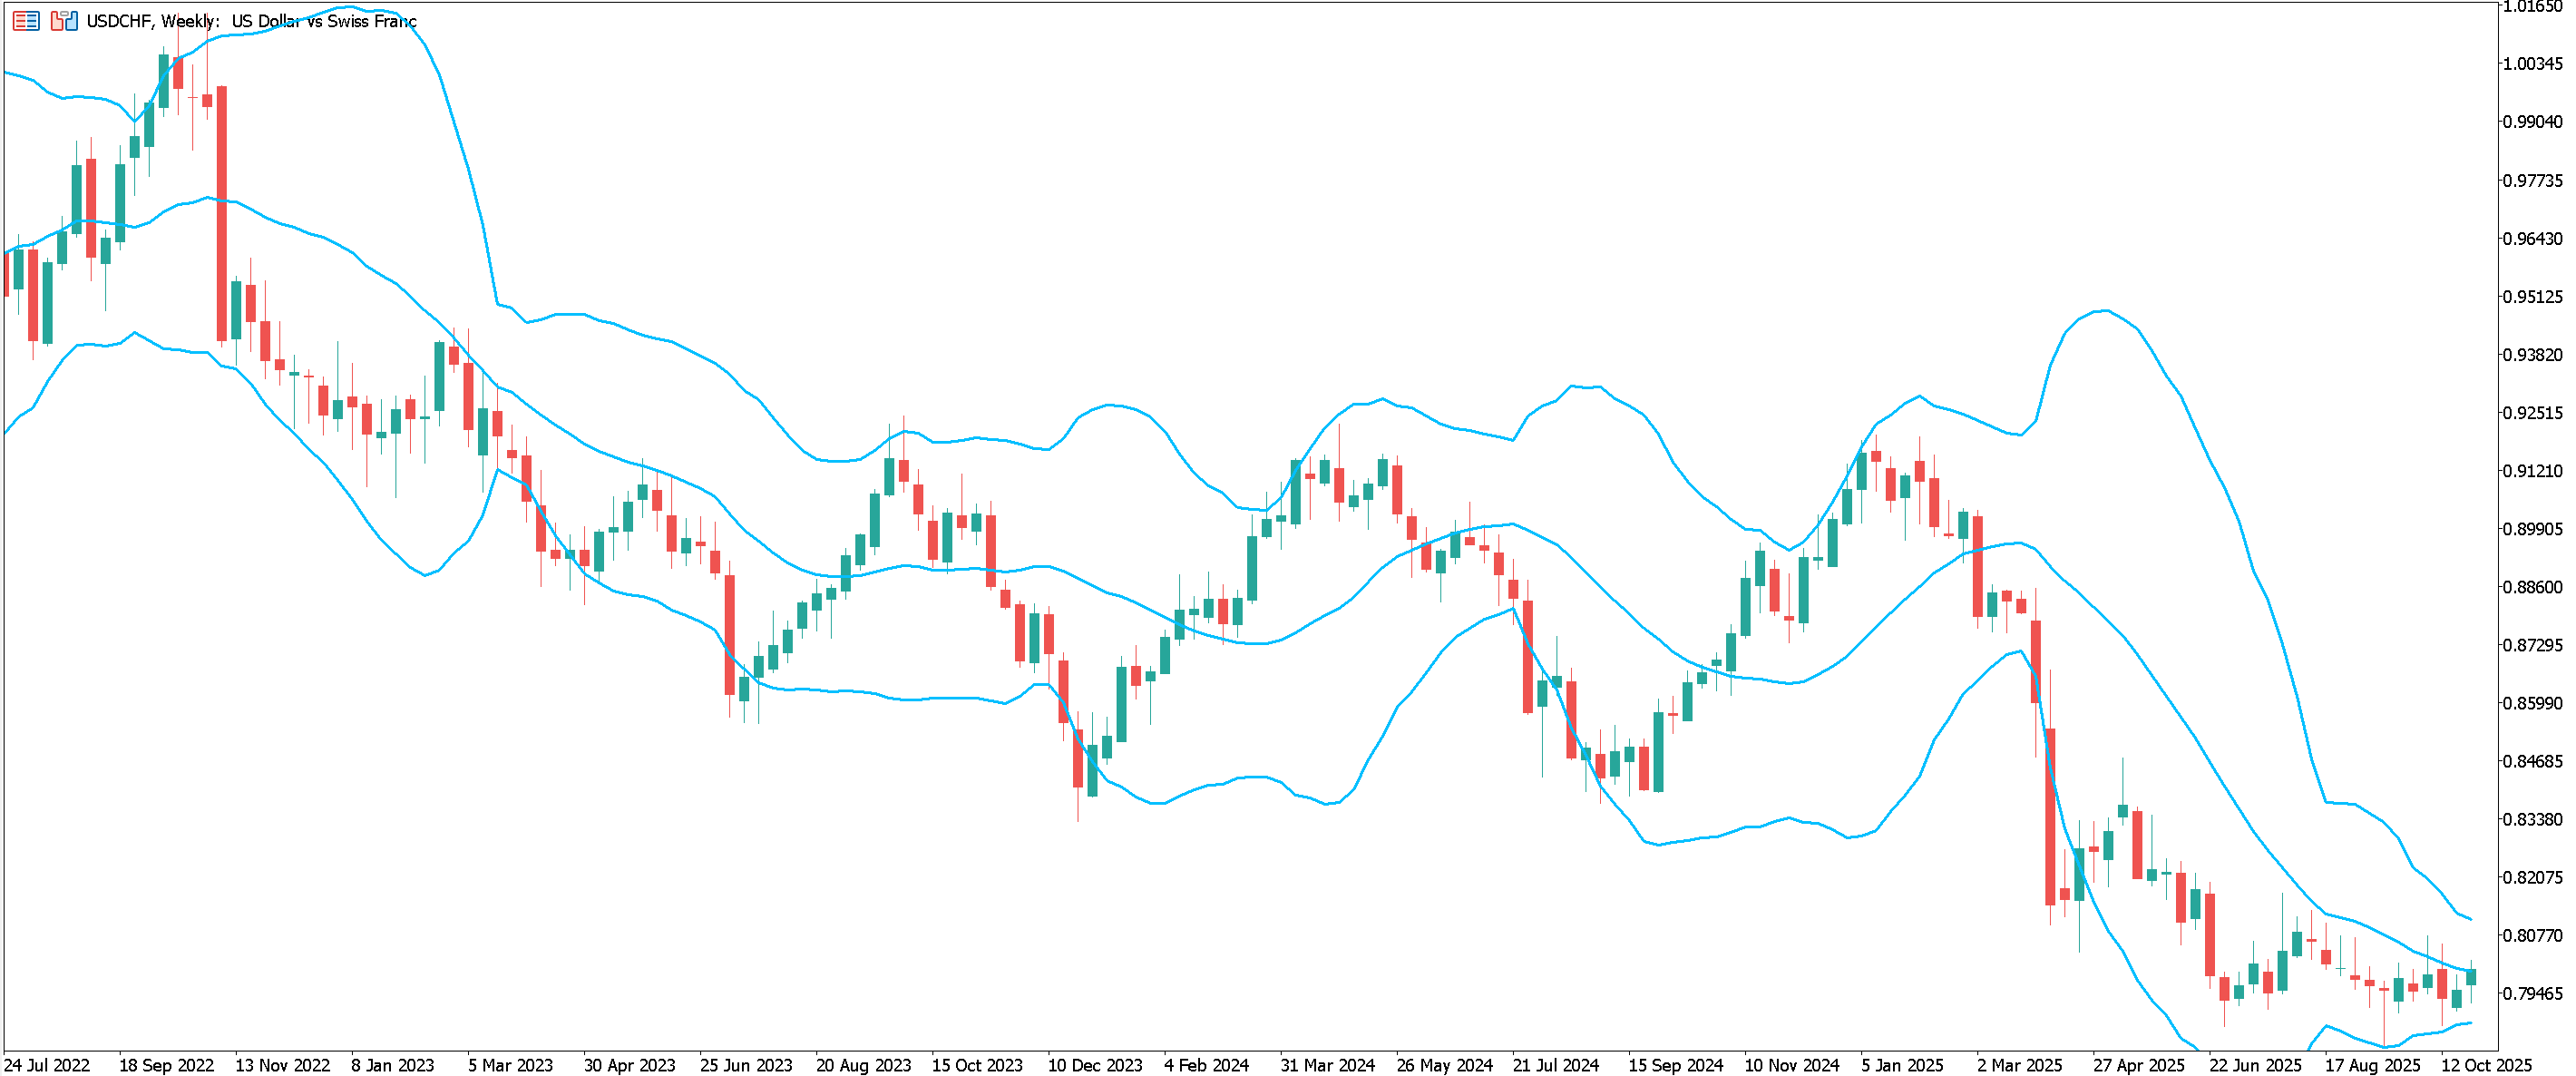
Consequently, traders might interpret the price approaching the upper band as a potential signal to consider short positions. Conversely, as price approaches the lower bank, it might be interpreted as a potential signal to consider long positions.
This approach tends to work better when the market is ranging and there is no clear trend. Traders should also note that a market won’t remain within a range forever. At some point, price will break out of the range, meaning traders should implement a risk management strategy.
Traders can also attempt to find additional confirmation of reversals by using other indicators such as the Relative Strength Index (RSI) and the Stochastic Oscillator.
Both of these indicators can be used to identify overbought/oversold levels in the market, which might foreshadow a reversal. Divergences between these indicators and the price of an asset is also often considered a sign of a potential reversal.
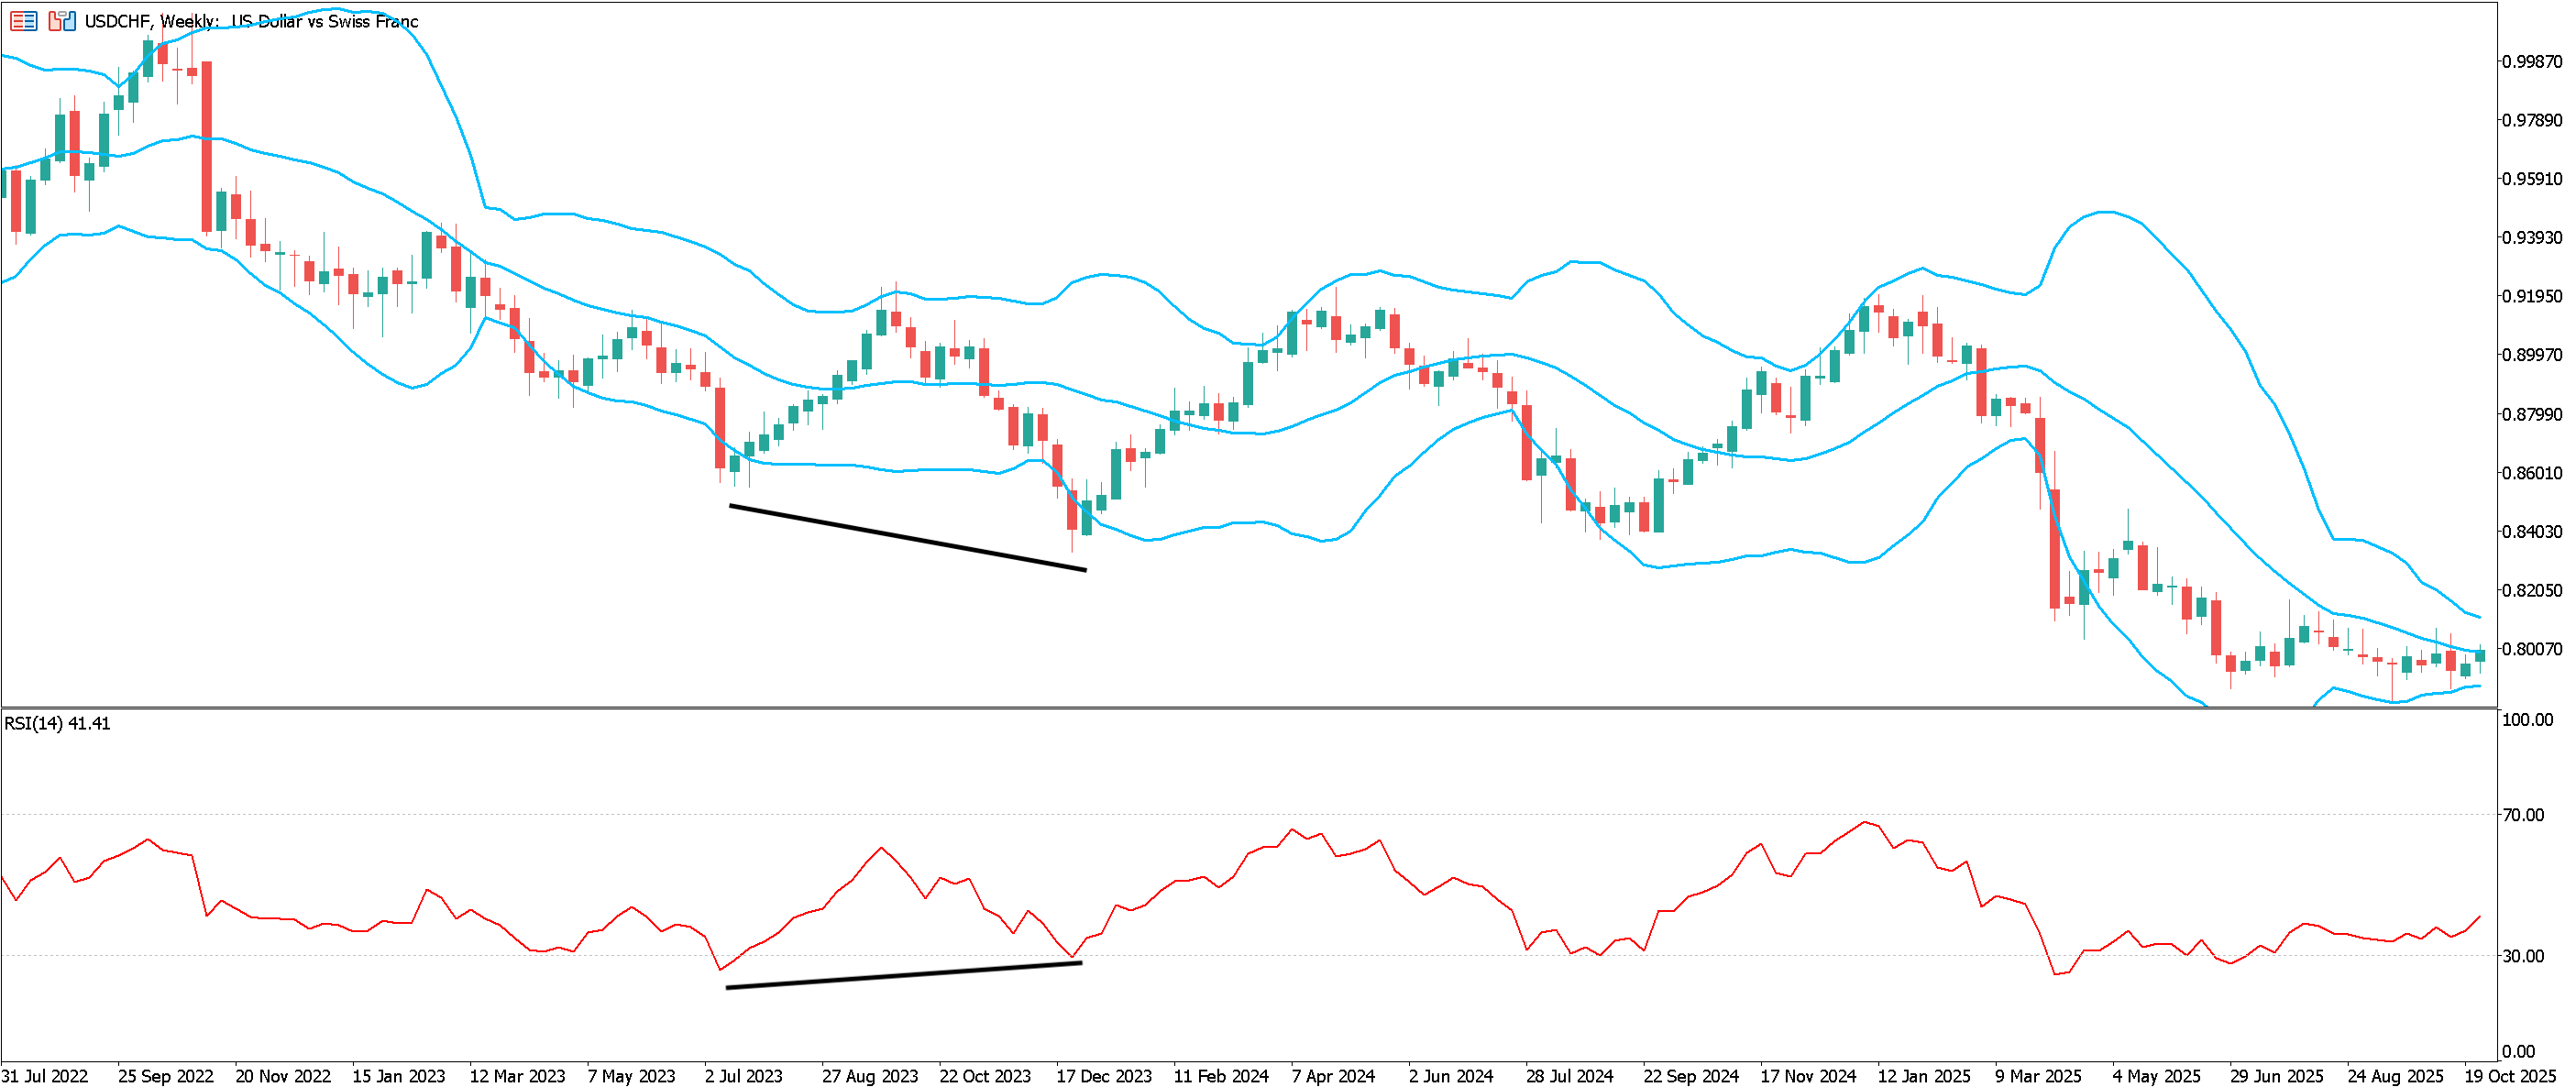
For example, above is the same weekly chart of USDCHF as before, but this time we have added the RSI. We’ve highlighted an example of divergence - where, as price makes a lower low, the RSI makes a higher low - which coincides with price touching the lower band.
The Bollinger Band Squeeze
The Bollinger Band Squeeze refers to a period where the Bollinger Bands tighten, indicating low volatility.
Traders often view this as a sign that a significant price move could be on the horizon, although the squeeze itself does not indicate which direction this might be in.
Following the squeeze, if price breaks above the upper Bollinger Band, it could signal the start of an upward move. Conversely, if price breaks below the lower Bollinger Band, it could be the beginning of a downward move.
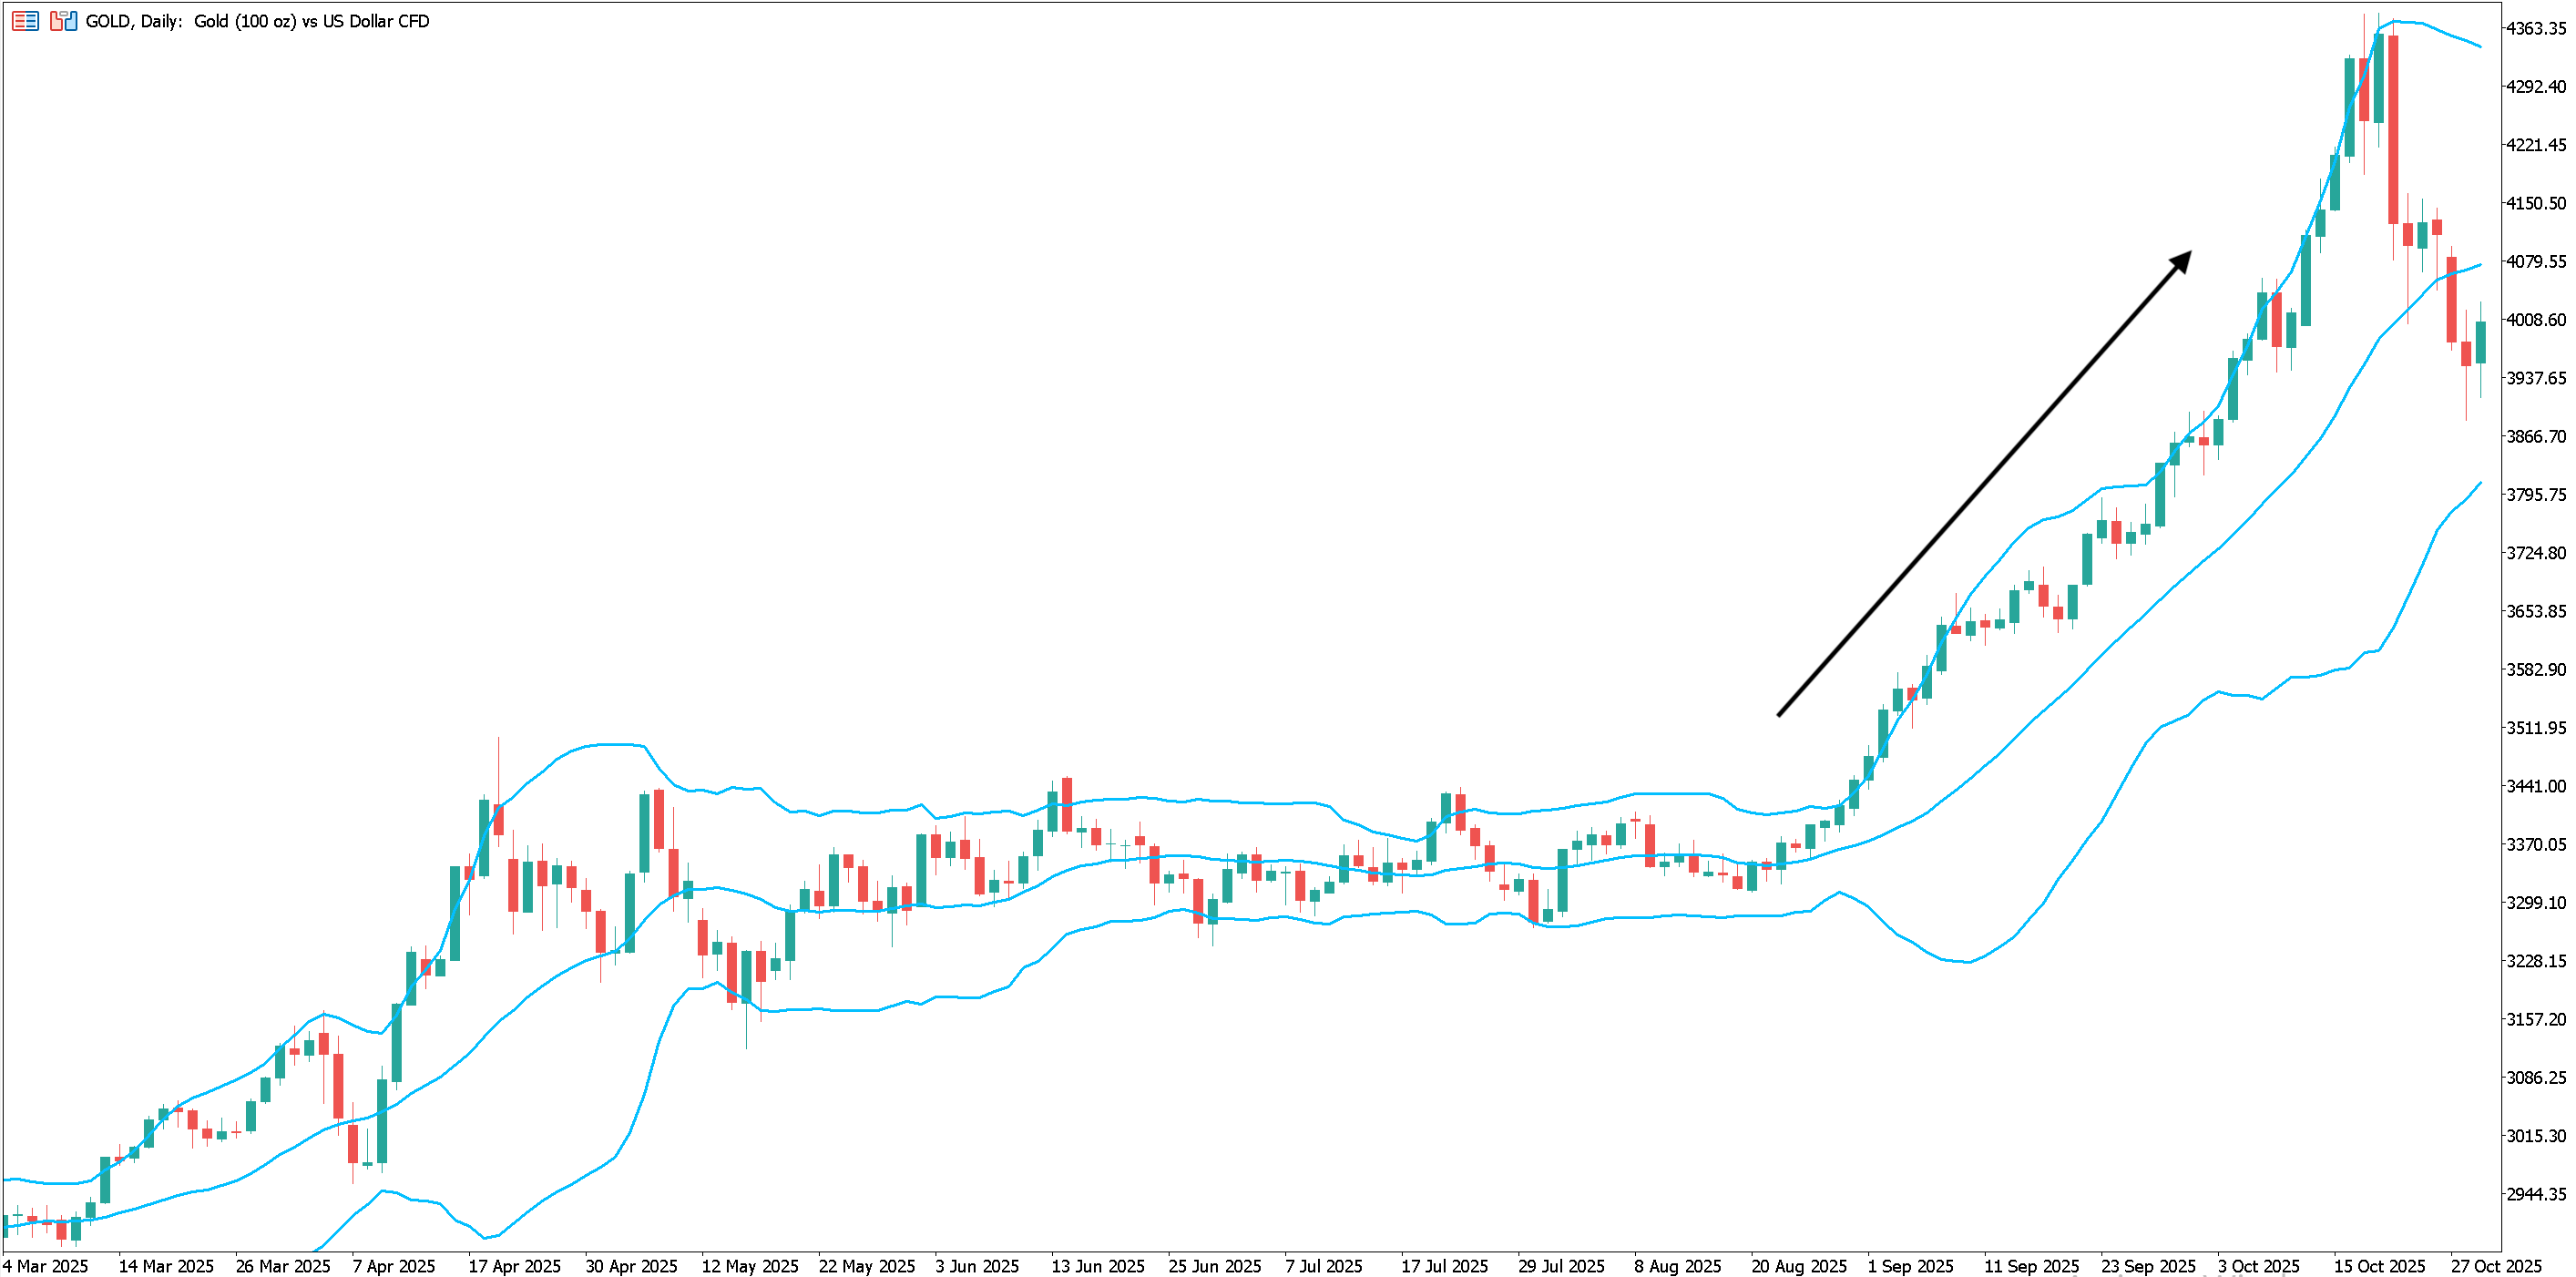
For example, in the daily chart of gold above, we can see the Bollinger Bands squeeze together for an extended period of time as price moves in a sideways channel.
The squeeze is followed by a breakout to the upside, and a significant upward movement begins as the bands begin to widen.
It’s important to note that not every squeeze will necessarily be followed by a movement like the one above. You’ll also notice that, in the example provided, price closed above the upper band on a couple of occasions before the upward move started.
Consequently, in order to help provide trading signals, traders will usually use other technical indicators in conjunction with the Bollinger Bands.
For instance, traders might use momentum indicators - such as the RSI - to help determine the direction of a breakout, or volume-based indicators - such as the Accumulation/Distribution Index - to confirm the validity of a breakout.
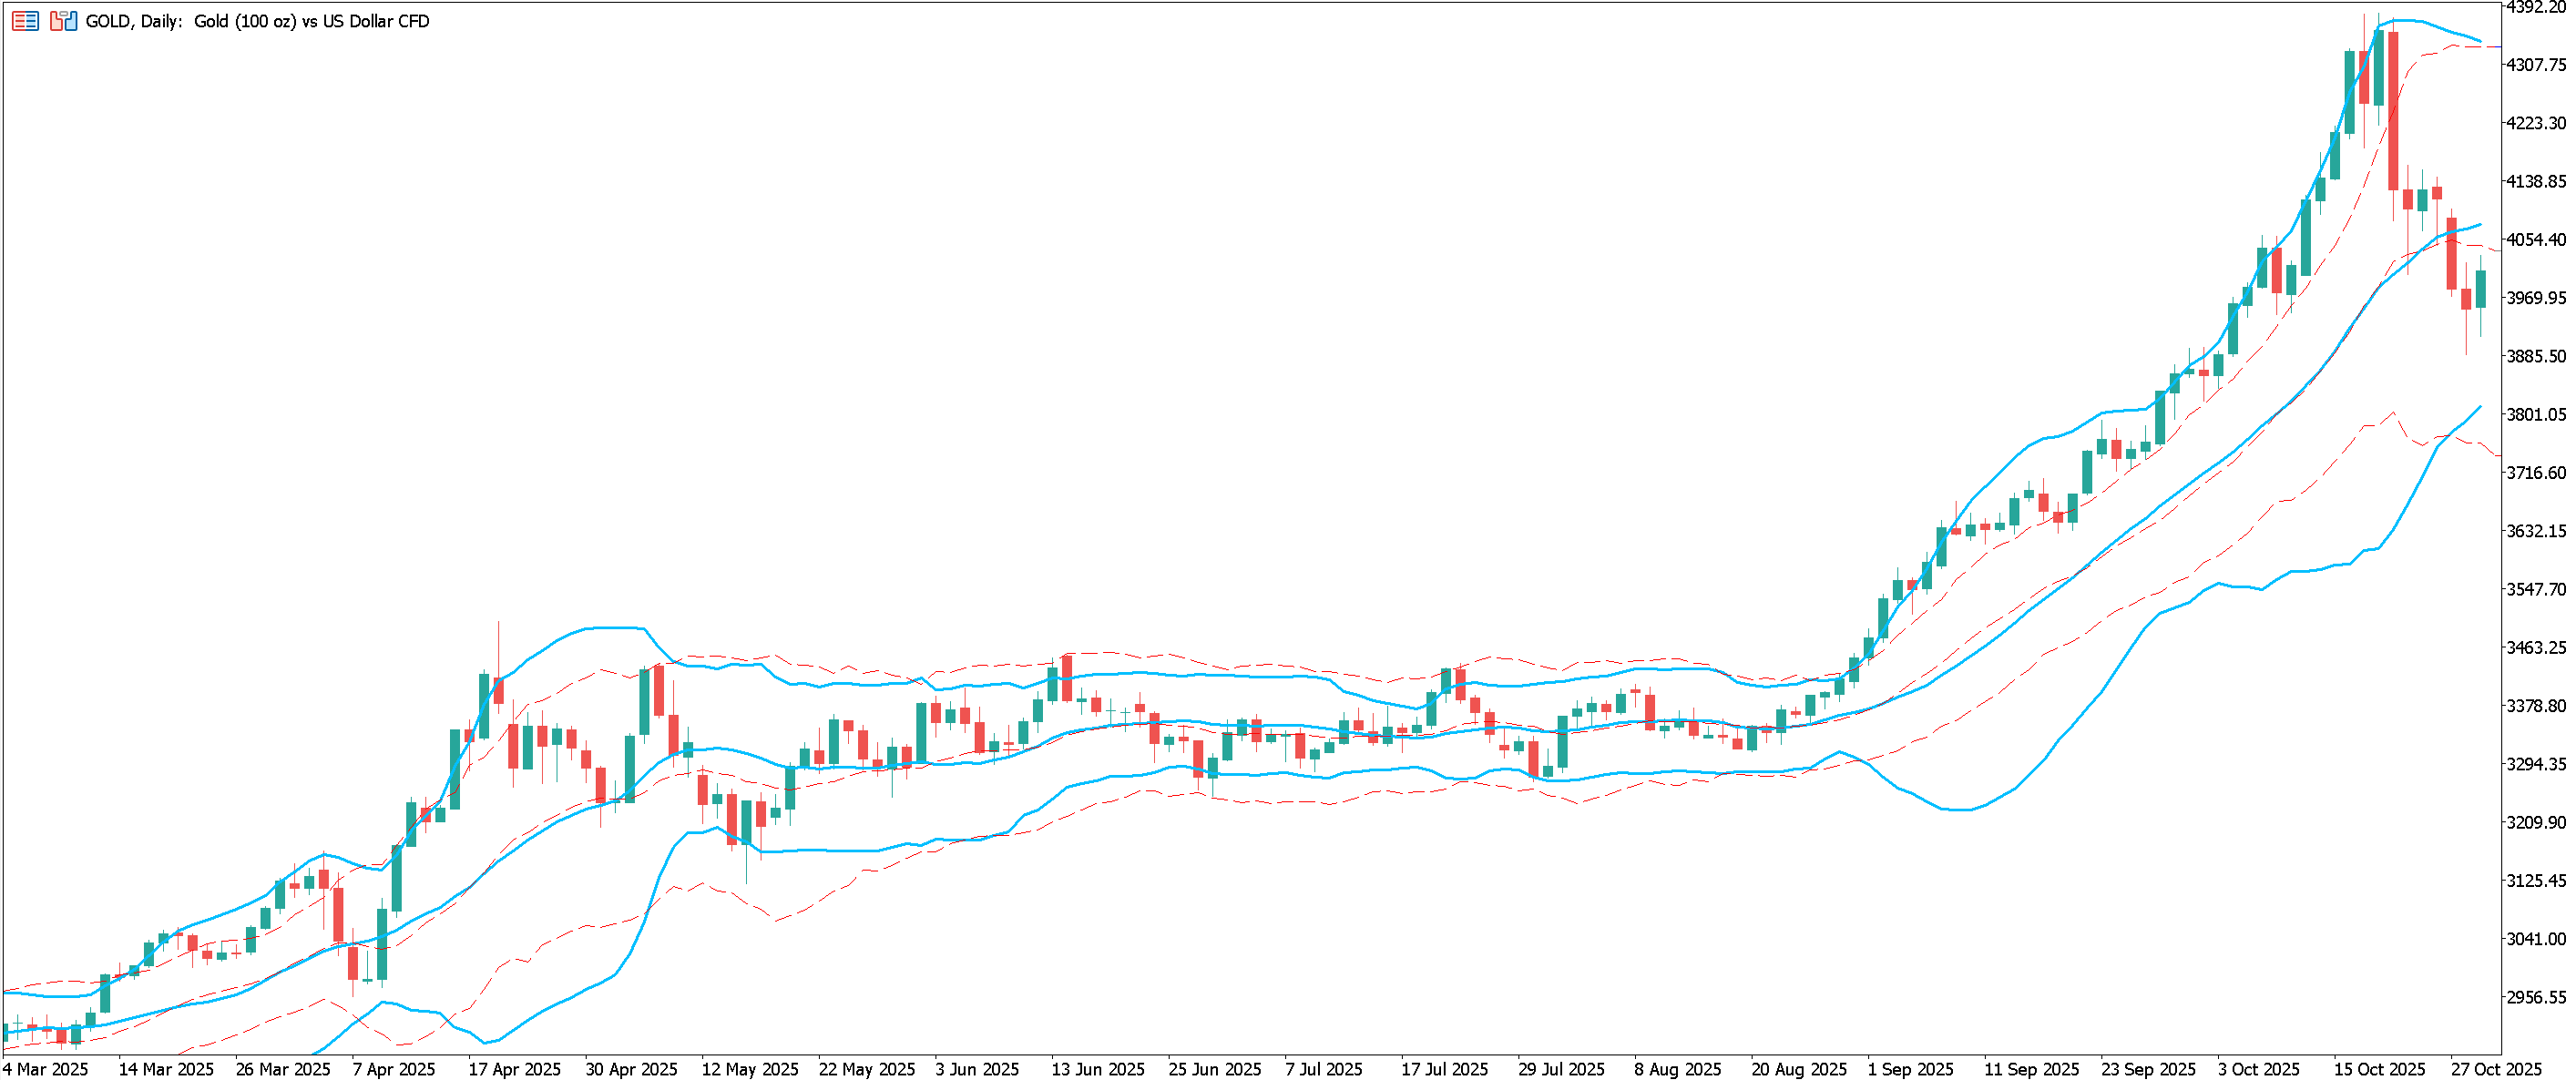
The chart above is the same daily gold chart as before; however, this time, in addition to the Bollinger Bands, we have added the Keltner Channel.
Like Bollinger Bands, the Keltner Channel is comprised of three lines, which are red and dotted on the chart above.
Nevertheless, unlike Bollinger Bands, the Keltner Channel’s middle line is an Exponential Moving Average (EMA), and the placement of two outer lines is based on the Average True Range (which is another volatility indicator).
If using the Keltner Channel, a trader may only consider a Bollinger Squeeze in which both the outer Bollinger Bands contract inside the Keltner Channel. Subsequently, traders might choose to wait until both Bollinger Bands have broken back outside the Keltner Channel before looking for a trading signal.
Other Articles You Might Be Interested In:
Frequently Asked Questions
Who invented Bollinger Bands?
Bollinger Bands were developed by John Bollinger in the 1980s.
What is the middle line in Bollinger Bands?
The middle line of Bollinger Bands is a simple moving average.
What does it mean when Bollinger Bands widen?
When Bollinger Bands widen, it means that volatility is increasing. Conversely, narrowing Bollinger Bands indicate a period of lower volatility.
How to calculate Bollinger Bands?
Bollinger Bands consist of three lines; the middle is a simple moving average (SMA) the default period of which is 20. By default, the outer bands are then plotted two standard deviations away from the moving average (i.e. upper band = SMA + 2 standard deviations and lower band = SMA – 2 standard deviations).
The given data provides additional information regarding all analysis, estimates, prognosis, forecasts, market reviews, weekly outlooks or other similar assessments or information (hereinafter “Analysis”) published on the websites of Admirals investment firms operating under the Admirals trademark (hereinafter “Admirals”) Before making any investment decisions please pay close attention to the following:
- This is a marketing communication. The content is published for informative purposes only and is in no way to be construed as investment advice or recommendation. It has not been prepared in accordance with legal requirements designed to promote the independence of investment research, and that it is not subject to any prohibition on dealing ahead of the dissemination of investment research.
- Any investment decision is made by each client alone whereas Admirals shall not be responsible for any loss or damage arising from any such decision, whether or not based on the content.
- With view to protecting the interests of our clients and the objectivity of the Analysis, Admirals has established relevant internal procedures for prevention and management of conflicts of interest.
- The Analysis is prepared by an analyst (hereinafter “Author”). The Author Roberto Rivero is a contractor for Admirals. This content is a marketing communication and does not constitute independent financial research.
- Whilst every reasonable effort is taken to ensure that all sources of the content are reliable and that all information is presented, as much as possible, in an understandable, timely, precise and complete manner, Admirals does not guarantee the accuracy or completeness of any information contained within the Analysis.
- Any kind of past or modelled performance of financial instruments indicated within the content should not be construed as an express or implied promise, guarantee or implication by Admirals for any future performance. The value of the financial instrument may both increase and decrease and the preservation of the asset value is not guaranteed.
- Leveraged products (including contracts for difference) are speculative in nature and may result in losses or profit. Before you start trading, please ensure that you fully understand the risks involved.