MT4 Supreme Edition Indicator Package
In this manual, you will find installation and usage instructions for MT4 Supreme Edition. Installation process and usage is the same in new MT5 Supreme Edition. Simply apply the instructions described in your MetaTrader 5 Supreme Edition accordingly.
Indicators are auxiliary tools that complement MetaTrader 4 trading software. They usually analyse the chart via an individual mathematical formula and draw conclusions from the chart history about potential chart movements.
Indicators provide trading signals to help you analyse charts, recognise trends and opposing or supportive movements.
1.Installing and opening indicators
Download MT4 Supreme Edition and make sure MetaTrader 4 is closed during the installation process.
Open the .zip file once the download is finished and double-click the Admiral-MT4-Apps.exe file inside the .zip archive to execute it. This should initiate the installation assistant.
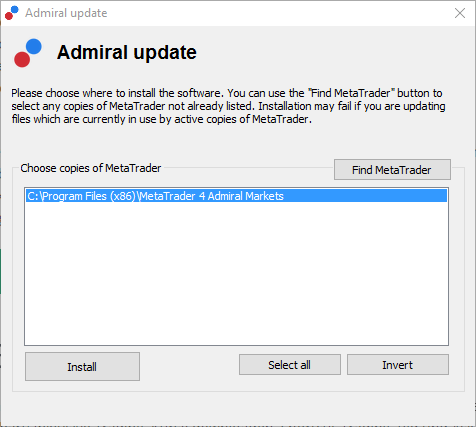
If you have multiple instances of the software installed on your system, use the Find MetaTrader button to find the correct version.
Click the Install button and follow the steps on the screen until the installation has completed successfully.
At this time, the MT4 Supreme extensions are only compatible with Windows, although some indicators work with Mac OS as well. You can find installation instructions for indicators under Mac OS X in Chapter 1.1.
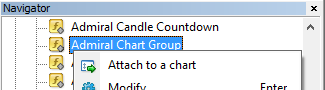
After installation, you can find the indicators in the navigator window of your MetaTrader software interface.
To place one of them in the chart:
- right-click the respective indicator, and
- choose Attach to a chart, or
- drag and drop the indicator directly into the chart window.
1.1.Installation under Mac OS X
As mentioned before, some of the Admirals indicators can be used under Mac OS X including Candle Countdown, High-Low, Local Time, Order History, Pivot and Spread.
To receive the installer files for Mac, please contact our customer service.
Correctly close the MetaTrader 4 software before the installation. To properly close the software:
- right-click the MetaTrader 4 symbol in the dock
- click the option for closing it.
To install the extension:
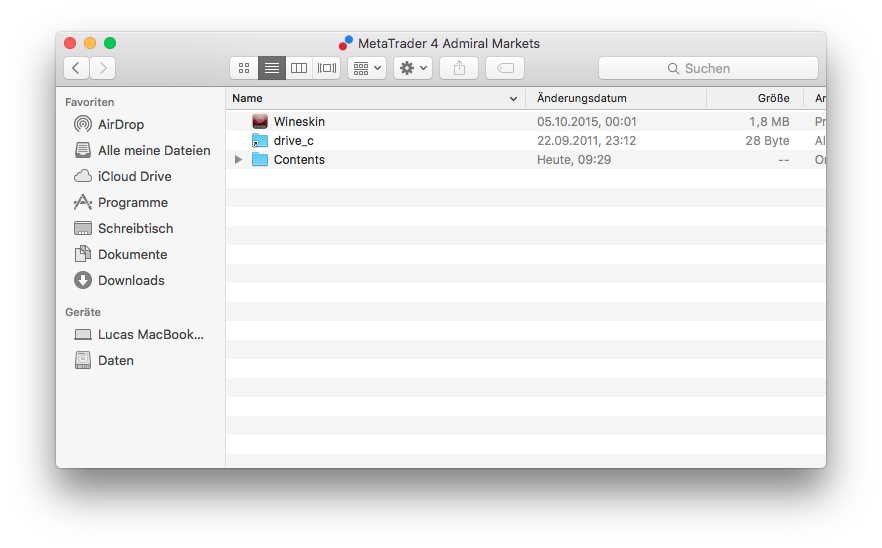
- open your Programs folder
- find the program MetaTrader 4 Admirals, then
- right-click it, and
- click the Show content option
- in the new window, open the following folder path: drive_c → Program Files → MetaTrader 4 Admirals → MQL 4 → Indicators (nb: this is where you have to paste the indicator files, identified by their .ex4 file type)
- after this, start MetaTrader 4.
If you have successfully installed the indicators, you will now find them in the navigator window.
2.Admiral Candle Countdown indicator
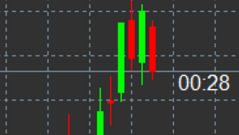
As soon as the indicator is enabled, the time until the next candle begins is displayed.
Usually, this number appears in the bottom-right corner of the chart window. However, you can customise where it appears in the settings window when applying the indicator to the chart.
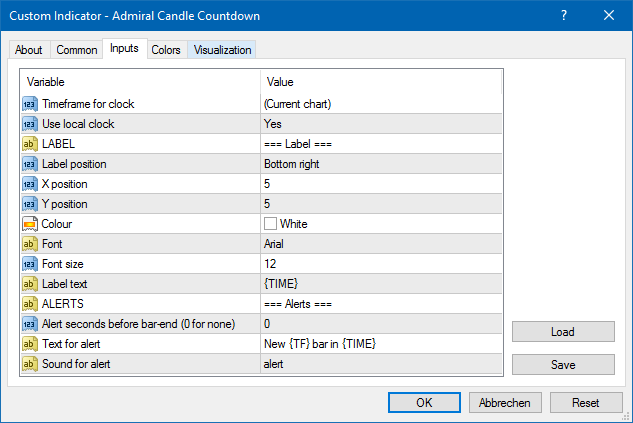
2.1.Settings of the Candle Countdown indicator
The individual settings of the Candle Countdown indicator are:
- Label position – sets the position of the Candle Countdown timer
- Colour – sets the colour of the displayed number
- Font and Font Size – configure font and font size.
You can also set the timer to be located right next to the candle. To do this, set the option to In line with price. Note that automatic chart scrolling needs to be activated for this to work.
Additionally, you can set alarms for new candles in the line Alert.
3.Admiral Chart Group indicator
The Admiral Chart Group indicator is a useful tool to connect multiple charts. For example, you can look at the same instrument multiple times, with different time-frames for each chart and change the symbol of all charts with only one click.
The main advantage of the Chart Group indicator is the ability to change all the chart windows by simply changing the symbol in one of them. The indicator automatically applies the customisation to all attached charts.
To use the indicator properly, you have to apply it to all chart windows you wish to connect. After this, a text box appears in the bottom-right corner of every affected chart.
You can manually set a name to create a chart group that connects all charts with that same name in the text box. This option is not case-sensitive.
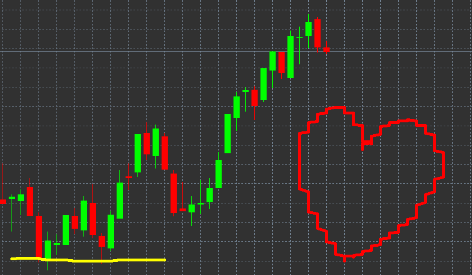
4.Admiral Freehand Drawing indicator
The Admiral Freehand Drawing indicator is a tool that allows freehand drawing in the chart.
Apply the indicator to the chart and then hold D to draw with your mouse.
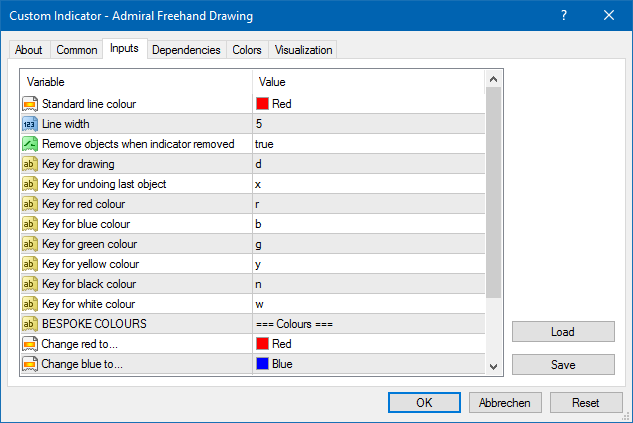
4.1.Settings and keybindings
Standardly the drawing colour is red, but you can also customise the colour by pressing different keys, press:
- B to get blue
- Y to get yellow
- N to get black
- W to get white.
To return to the standard red, simply press R.
You can also delete your last drawn object by pressing X.
Additionally, you can customise the keybindings and colours in the settings screen of the indicator.
5.Admiral High-Low indicator
The Admiral High-Low indicator shows the highest and lowest price value within the chosen time-frame.
It works with all standard time windows like minutes, hours or days.
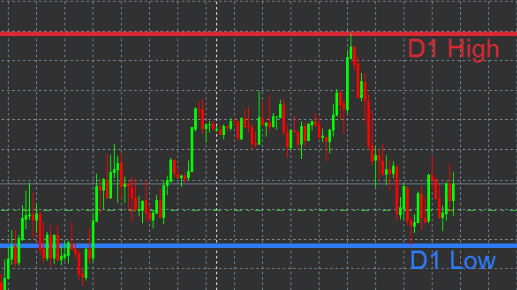
Standard setting for the indicator are daily high and low points.
You can customise the colours of the respective horizontal lines to your liking in the settings screen.
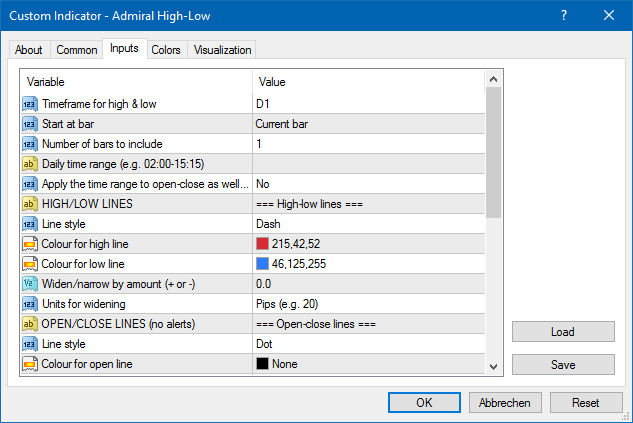
5.1.Settings of the High-Low indicator
- Timeframe for high & low – changes the time unit of the indicator.
- Start at bar – chooses whether the current or former candle is the point of reference for calculating high and low.
- Numbers of bars to include – sets the number of candles to be considered for calculating high and low.
- Daily time range – optionally limits the time of the day for which high and low are calculated.
- Apply the time ranges to open-close as well as high-low – decides whether the set time-frame applies to open and close lines.
- Colour for high and low line – customises the colour for high and low lines.
- Widen/narrow by amount – moves the high and low indicator inward or outward.
- Units for widening – sets the unit of measurement to be used in the above option.
- Line style – customises the style of the open-close lines.
- Colour for open line – activates the current open line and sets its colour (remains disabled as long as the colour is set to None).
- Colour for close line – activates the current close line and set its colour (remains disabled as long as the colour is set to None).
- Colour for previous-close line – activates the former close line and set its colour (remains disabled as long as the colour is set to None).
- Label-settings – customises the labels, adjusts the text, font etc.
- Alert-settings – decides whether there should be an alarm sound when the price crosses any of the lines.
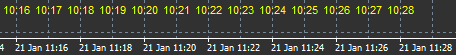
6.Admiral Local Time indicator
The Admiral Local Time indicator offers the option to display your local time in addition to the server time at the bottom of the chart.
The display colour can be customised.
7.Admiral Order History indicator
The Admiral Order History indicator inserts a well-arranged representation of your past trades into the chart.
Profitable trades are displayed as green lines, loss-trades as red ones.
Hovering the mouse over any of the lines will display detailed information about the trade, such as win/loss, opening and closing price, S/L and T/P.
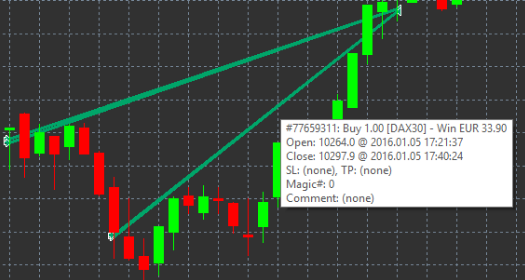
This example shows €33.90 profit for this trade
The blue and gray bars in the chart offer additional reference over past trades in all trade symbols.
The blue bar refers to trades in the same symbol - the gray one to trades in all other symbols.
7.1.Settings of Order History indicator
- Include open trades? – decides whether currently open trades should be displayed.
- Colour coding of trades – changes the mode of this indicators colour coding, win/loss or buy/sell.
- Colour 1 – determines the colour of the win or buy line.
- Colour 2 – sets the colour for the loss or sell line.
- Colour for open trades – sets the colour of the marker that represents points where orders are opened.
- Entry and exit markers – changes the type of marker.
- Line from open to close – changes the style of the history bars.
- Stop-loss line colour style – sets the colour and style of the stop loss lines (requires a style to activate).
- Take-profit line colour style – sets the colour and style of the take profit lines (requires a style to activate).
- Show bands for active trading periods – activates or deactivates display of trades in other symbols at the bottom of the chart.
- In-filter-colour and Out-of-filter-colour – changes the colour of the bars for trades in the active symbol or other symbols.
- Size of band (pixels) – changes the size of the bars.
- Filter settings – sets an individual filter for the displayed trades.
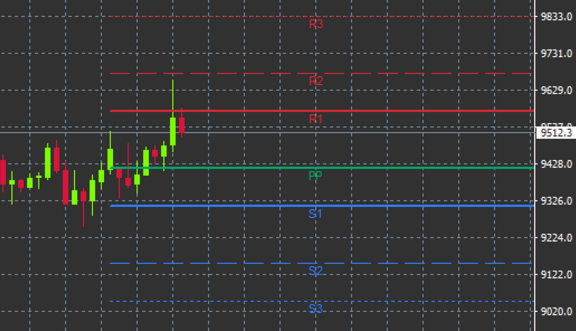
8.Admiral Pivot indicator
The pivot points show different resistance and support lines in the chart, while the PP-line is the most important support and resistance line.
R1, R2 and R3 represent increments of the resistance with decreasing significance. On the other hand, S1, S2 and S3 represent increments of the support.
8.1.Settings of the Pivot indicator
- Timeframe for pivot points – sets the time-frame that is the basis for calculation of the pivot points.
- Number of bars to include – sets the amount of candles used to calculate the pivot points.
- Calculation for PP level – sets the method for price calculation of the pivot points.
- Show lines all the way across chart – allows lines to be displayed along the entire chart.
- Show labels for all lines – enables labels for pivot lines.
- Bar offset for labels (+ for future) – moves line labels to the right or left.
- Font name for labels – sets the font type for the line labels.
- Font size for labels – sets the font size for the line labels.
- Colours and styles – sets the colour and style of all individual lines.
- Alerts – sets up alerts for the price-crossing lines.
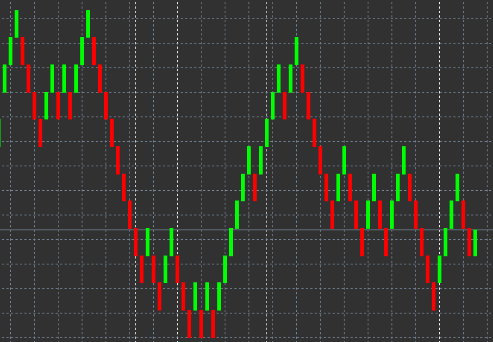
9.Admiral Renko indicator
The Renko indicator is used for technical chart analysis.
It displays an alternate form of the chart and only draws new candles when actual price movements occur. This way, minor price movements that don’t actually influence the trend are ignored and do not obscure the overall picture.
9.1.Settings of the Renko indicator
- Renko block size in pips – sets the size of Renko blocks.
- Symbol pip size – sets the pip size of the instrument.
- Colour for up and down blocks – customises the colour of the Renko blocks.
- Draw blocks as continuous – adjusts whether blocks are continuous or not.
- Target lines for next blocks – changes the style of indicator lines.
- Draw on top of chart – decides whether Renko blocks appear in the foreground or background.
- Alerts on new blocks – sets up alerts for when new blocks are being drawn.
- Round the starting price – decides whether the starting price should be rounded.
- Maximum historic blocks – sets the number of blocks displayed at a time.
- Build Renko data from history period – decides the time-frame over which the Renko indicator is calculated.
- CSV/TSV log – decides whether to keep a log file by inputting a file name and choosing a format.
- Offline chart – configures settings (see chapter 9.2.).
9.2.Open offline chart
Create offline chart period – sets up your desired amount of blocks that doesn’t match one of the standard time-frames in MT4, such as 10 for 10 pips Renko blocks.
To open offline chart:
- click on File and then Open offline
- double-click the chart with the time-frame you chose.
The offline chart should open. In this example, offline chart would be M10.
The opened offline chart contains candles with unified size according to the amount of pips you chose. Movement disturbances are filtered out and ignored. Trend movements, resistances and supports are made more clear.
10.Admiral Spread indicator
The Spread Indicator is a tool to measure and document the spread of an instrument. Once applied to a chart, it displays the spread until it is terminated. The displayed information provides:
- maximum
- minimum, and
- average spread per time period.
The offline chart should open. In this example, offline chart would be M10.
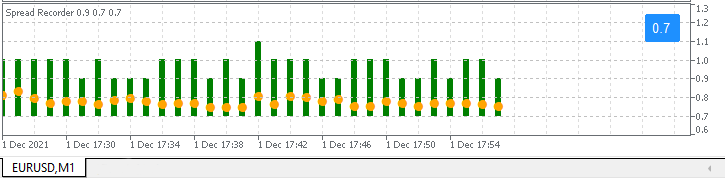 Spread EUR/USD
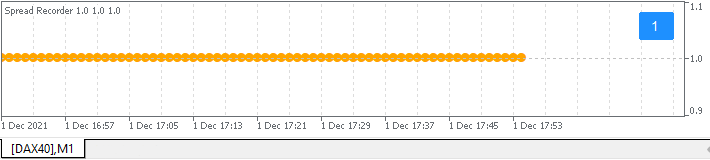 Spread in DAX40, typically fixed at 1.0 point
11.Admiral Day Session indicator
The Day Session indicator can hide candles generated during night trading times. This allows you to continue working with your old settings and indicators as usual.
Additionally, you can create your own time windows for sessions, such as DAX40 Xetra from 09:00 to 17:30 CET.
By default, the indicator is set to display the regular DAX40 session from 08:00 to 22:00 CET.
To start:
- apply the indicator to the chart, then
- click on File and choose Open offline, then
- choose a symbol to open in an offline chart.
You can:
- change the periodicity displayed in the active chart at any given time - this will change the periodicity in your offline chart, and
- apply templates, indicators and expert advisors to the offline chart.
11.1.Settings of Day Session indicator
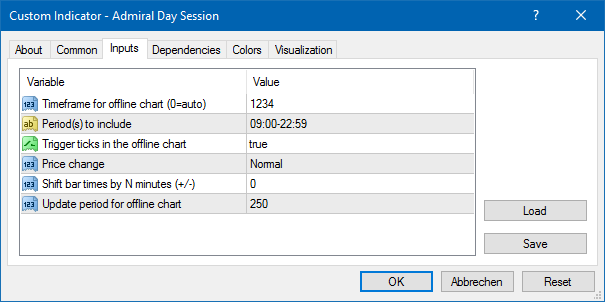
- Timeframe for offline chart – displays ID of the offline chart.
- Period(s) to include – shows the time window of the session you want to be displayed in your offline chart (uses server time).
- Shift bar times by N minutes – adjusts the displayed time (for example, -60 for CET).
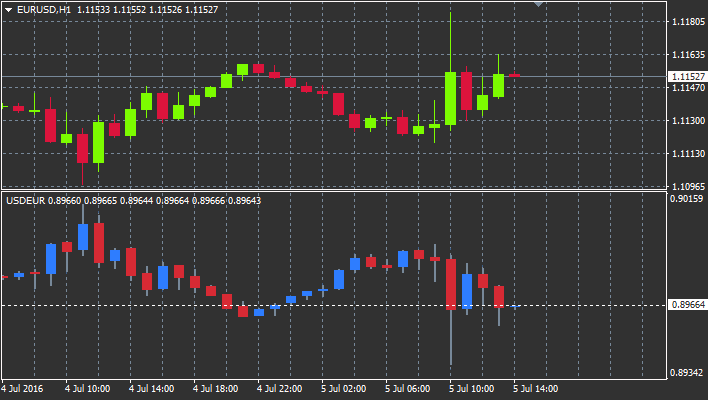
12.Admiral Chart-in-Chart indicator
The Admiral Chart-in-Chart indicator allows you to display a second chart directly inside a main charts indicator windows. This allows you to view two instruments at the same time. For example, to observe possible correlations.
The additional chart is being displayed inside the main chart.
It is possible to add indicators to the second chart. You can activate and configure these via the indicator settings for the Chart-in-Chart indicator.
Note that you can not trade the second instrument displayed on the Chart-in-Chart indicator this way, only the instrument displayed in the main chart. The Chart-in-Chart indicator does not represent a fully functional chart.
12.1.Chart-in-Chart settings
- Symbol – choose the preferred trading instrument to be displayed in the second chart (refer to the market overview window for correct names)
- Invert prices – invert the instrument prices (for example, EUR/USD will be converted to USD/EUR)
- Draw style – choose from the different chart styles, such as candles, end price or high and low.
- Line/high-low colour – set up the colour for chart lines.
- Candle body – bull – set the colour for bullish, upwards candles.
- Candle body – bear – set the colour for bearish, downwards candles.
- Colour for current price line – set the colour for the line that displays the current price.
- Colour for open position lines – set the colour for opened positions. This option is deactivated by default.
- Colour for s/l and t/p lines – set the colour for Stop Loss or Take Profit orders (deactivated by default).
- Colour for pending order lines – set the colour for pending orders (deactivated by default).
- Line style for open positions and pending orders – set the style of the line that marks opened and pending orders by choosing from solid lines, dotted lines, dashed lines or a combination of both.
- Indicator – select and configure indicators to be applied to the second chart. Indicators with further parameter settings can be customised under the respective option here.
13.Admiral Magnifier indicator
The Admiral Magnifier allows you to zoom in on a section of the chart to view the next smaller time setting.
You can adjust the size of the indicator to your liking to increase or decrease the size of the area that is meant to be magnified. Simply click on one of the edges of the indicator and drag to resize as desired.
You are also able to adjust the degree of magnification, for example to always display M1 through the magnifier, even when using a M30 chart.
13.1.Magnifier settings
- Chart timeframe/type – Here you can choose by how much the magnifier is supposed to zoom in. Default setting is one period smaller.
- Draw style – Choose between different chart styles such as candles, end price or high and low.
- Background colour – Sets the background colour of the indicator.
- Up bar colour – Sets the colour of upwards candles and bars.
- Down bar colour – Sets the colour of downwards candles and bars.
- Magnifier highlight colour – Sets the colour of the magnified area.
- Horizontal grid lines – Here you can set the distance between horizontal lines. Note that this setting is individually different for every instrument. For example, in EUR/USD it is 0.0020 while in DAX40 it is 20.
- Vertical grid lines – Set the distance between vertical lines.
- Colour for grid lines – Set the colour of the grid.
- Candle size – Increases or decreases size of the candles.
- Initial left position – Move the standard position of the chart by the given amount of pixels to the right.
- Initial top position – Move the standard position of the chart by the given amount of pixels down.
- Corner for initial position – Choose the corner of the chart where the magnified area should be displayed.
- Initial width – Set the standard width in pixels.
- Initial height – Set the standard height in pixels.
- Padding at top and bottom – Set the minimal distance from candles to the edge of the chart.
- Info bar height – Set the size of the info bar.
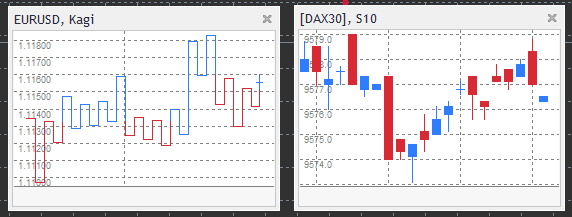
14.Admiral Mini Chart indicator
The Mini Chart indicator allows you to display a freely customisable chart inside the main chart. Instrument and time frame are entirely independent from the main chart and the mini chart can be used with multiple indicators.
14.1.Mini Chart settings
- Chart symbol – choose the trading instrument. Make sure spelling is correct and identical to the name displayed in the market overview.
- Invert prices – invert the prices. For example, EUR/USD to USD/EUR.
- Chart timeframe/type – set the time frame for the Mini Chart. Default setting is the current period of the main chart. You can choose any other period, even those not normally available in MetaTrader, such as 3M, 4M or 12M. See Chapter 14.2 for further explanations.
- Ticks per bar – set the amount of ticks that should be used for one candle. Only relevant for the Tick Chart.
- Transformation – choose from a selection of chart-changing indicators, such as Heikin Ashi or Three Line Break.
- Renko/range/Kagi/P&F Block size – set the size of blocks in defined units (see below).
- Units for block size – define unit of block size.
- Reversal factor for range and P&F – reversal factor, the number of blocks before movement is drawn in the opposite direction.
- Base timeframe for historic Renko, range Kagi, P&F data – time-frame used for calculating candles.
- Draw style – choose a chart style such as candles.
- Background colour – set the background colour of the indicator.
- Up bar colour – set the colour for upwards candles and bars.
- Down bar colour– set the colour for downwards candles and bars.
- Fixed maximum price – set a fixed maximum price for the chart.
- Fixed minimum price – Set a fixed minimum price for the chart.
- Include Indicators in min/max – choose whether to use indicator values for min-/max-prices of the chart.
- Colour for grid lines – set the colour for the grid.
- Horizontal grid lines – set the distance between horizontal lines. Note that this setting is individually different for every instrument. For example, in EUR/USD it is 0.0020 while in DAX40 it is 20.
- Vertical grid lines – set the distance between vertical lines.
- Zoom level – set the zoom level of the chart. Zoom level 0 refers to the minimal amount of magnification, while zoom level 5 is the maximal amount.
- Initial left position – move the standard position of the chart by the given amount of pixels to the right.
- Initial top position – move the standard position of the chart by the given amount of pixels down.
- Corner for initial position – choose the corner of the chart where the Mini Chart should be displayed.
- Initial width – set the standard width in pixels.
- Initial height – set the standard height in pixels.
- Padding at top and bottom – set the minimal distance between the candles and the edge of the chart.
- Padding at right – chart shift function. The higher the amount of pixels, the more distance between the chart and the right border of the chart.
- Info bar height – set the size of the info bar.
- Indicator – select and configure indicators that should be applied to the second chart. Indicators with further parameter settings can be customised under the respective option here.
14.2.Chart type explanation
Second charts (S5, S15, etc.) - like regular minute charts in MT4, these draw candles with an interval of a set amount of seconds. The S5 chart draws a new candle every five seconds. Note that there is no historical data for second charts, so this type of chart is being build up, as soon as the indicator is attached.
Range charts - new candles are only being drawn when the price moves in either direction by a set number of pips. Stacking range charts work by the same principle, but in this case candles pointing in the same direction are being combined into one candle.
Renko charts - this type of chart works the same way as range charts. In order to draw a block in the opposite direction of the trend, there has to be an opposing movement of at least 2 blocks.
Kagi charts - this chart changes direction when the price reaches a reversal that sur-passes the former high/low point.
Point & Figure charts - similarly to range charts but when the movement in the same direction is being stacked. A reversal happens only when an opposing movement lasts for a set amount of blocks. The standard setting for this is 3 blocks, but it can be changed under the reversal factor for range and P&F setting.
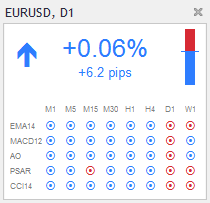
15.Admiral Symbol Info indicator
The Admiral Symbol Info indicator allows you to view a specific set of real-time updated information in an additional window. It portrays the percentage difference between the opening course of the chosen time frame, the daily high and a multitude of trend indicators while being fully customisable.
An arrow allows you to see at first glance whether the price moved up or down from the opening price. Additionally, you can always directly see the difference in pips.
On the right side is a bar that shows the current price position in relation to the entire range of this day.
15.1.Symbol Info settings
- Symbol – choose the trading instrument. Default setting is the symbol in your current chart, but you can choose any different symbol at will. Make sure spelling is correct and identical to the name displayed in the market overview.
- Use pip size – set what size should correlate to one pip. For example, in DAX40 a size of 1 allows you to see price movements in full points.
- Timeframe for % change – Sets the time frame the percentage change should use as a reference. Default setting is D1, as in the current day.
- Number of bars for % change – set the amount of candles the percentage change should use as a reference. For example, you can use 12 candles in a monthly chart to see the percentage change for a full year.
- Timeframe for high/low – set the time frame to be used in the high/low chart. Default setting uses the same time frame as the percentage change.
- Number of bars for high/low – set the amount of candles to be used in high/low charts. For example, you can use 12 candles in the monthly chart to see price movement in relation to one full year.
- Background colour – set the background colour for the indicator.
- Rise colour – set the colour for upwards movement.
- Fall colour – sets the colour for downwards movement.
- Text colour – set the colour for text.
- Initial left position – move the standard position of the indicators to the right by a given amount of pixels.
- Initial top position – move the standard position of the indicator down by a given amount of pixels.
- Corner for initial position – choose the corner of the chart in which the indicator should appear by default.
- Indicator – select and configure indicators that should be applied to the second chart. Indicators with further parameter settings can be customised under the respective option here.
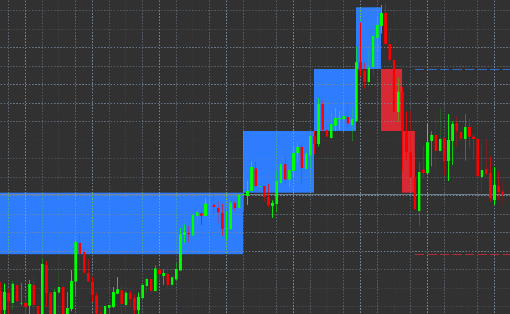
16.Admiral Gravity indicator
The Admiral Gravity indicator displays resistance and support zones based on up to 10000 historical M5 candles. The highs and lows reached in this history form those zones, while current data is considered more significant than older values.
Darker colours signalise stronger support or resistance zones, zones the price is likely to bounce off of. A breach of a dark blue zone can be evaluated as a continuation signal. Brighter zones have no relevance.
16.1.Gravity settings
- Time period – choose between regular calculation or shortened calculation duration.
- Level X colour – set the colours for the different levels of zones.
16.2.Change calculation area
You can move the area of reference for calculating the zones, by drawing a vertical line anywhere inside the chart and naming it GStart.
You can then move this line to set the last point in time to be taken into account when calculating the zones.
17.Admiral Keltner indicator
The Admiral Keltner indicator forms a Keltner channel in the chart. The way it functions, buy and sell signals are similar to the Bollinger bands. However, the bands in this channel are calculated based on the ATR indicator.
As a result, this channel is less prone to calculation errors than Bollinger Bands.
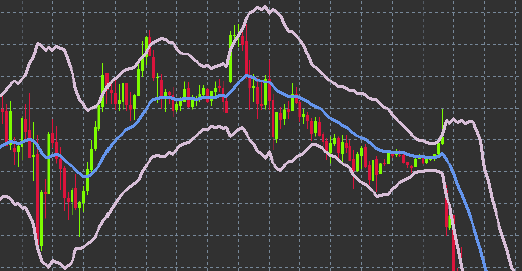
Crossing the upper band or the moving average can be seen as a respective continuation signal. The middle line, also the moving average, is a popular candidate for a stop loss line.
17.1.Keltner settings
- Moving average type – set the type of the moving average.
- Price for moving average – set the price used for the calculation of the moving average.
- Moving average period – choose the period for the moving average.
- ATR period – choose the period of the ATR.
- ATR multiple – set the multiplicator for calculating the Keltner bands.
- Alerts when price crosses upper/lower channel – set an alarm to go off when the upper or lower band of the channel is being crossed.
18.Frequently asked questions
- Are indicators compatible with Mac OS? Currently, only a limited amount of indicators are available for Mac OS (see chapter 1.1).
- Are indicators compatible with MT5? No.
- Can extensions be removed from the MetaTrader software individually? Yes, you can remove extensions separately by right-clicking them in the navigator window.
- Do indicators support other languages? No, the labels and settings of our indicators are only provided in English.
19.More info
Feel free to visit our Youtube channel for recordings of our webinars about day trading, the Supreme extensions and general handling of the MetaTrader 4 software.
Disclaimer:
Please note that these add-ons are provided free of charge by an external, technical service provider, based on the Expert Advisor technology in the MT4 & MT5. As with all expert advisors (EA) plugins, these are only active when your MetaTrader has established connection to the internet and our servers. Although EA`s have been thoroughly tested and their technical reliability should be sufficient, malfunction can never be fully ruled out. Make sure you fully understand the functionality of all add-ins and extensions, e.g. by practicing their use extensively on a demo account. You should acknowledge before using EA`s that Admirals is not liable for loss or other damage caused by your use of the EA`s.