How to Trade with the Keltner Channel Indicator

The Keltner Channel is a volatility-based indicator formed by three lines: an exponential moving average (EMA) enveloped by two bands calculated using the Average True Range (ATR). The two outer bands expand as volatility rises and contract as it falls. In this article, we examine how the indicator is calculated and interpreted. We'll also compare it with Bollinger Bands and explain how to use it in MetaTrader 4 (MT4) and MetaTrader 5 (MT5).
The information in this article is provided for educational purposes only and does not constitute financial advice. Consult a financial advisor before making investment decisions.
Table of Contents
What Is the Keltner Channel Indicator?
The Keltner Channel is a volatility-based indicator. Its modern version consists of three lines: an exponential moving average which is flanked by a volatility adjusted band on either side.
The distance between the outer bands and the centre line is based on the Average True Range (ATR), which measures the extent of recent price movements.
Chester W. Keltner introduced the original version of the channel in his 1960 book, How to Make Money in Commodities. His version used a simple moving average of the typical price as its centre line - where typical price each day is the average of high, low and close - and the average high-low range to determine the outer bands.
Linda Bradford Raschke later popularised the modern version, which replaced the centre line with an EMA and used ATR to determine the width of the channel.
Keltner Channel Formula and Calculation
In the modern version of the Keltner Channel, the three lines are calculated thus:
- Centre line: EMA(n)
- Upper band: EMA(n) + [ATR(m) × multiplier]
- Lower band: EMA(n) − [ATR(m) × multiplier]
In these formulas, n is the number of periods used to calculate the EMA whilst m is the ATR lookback period.
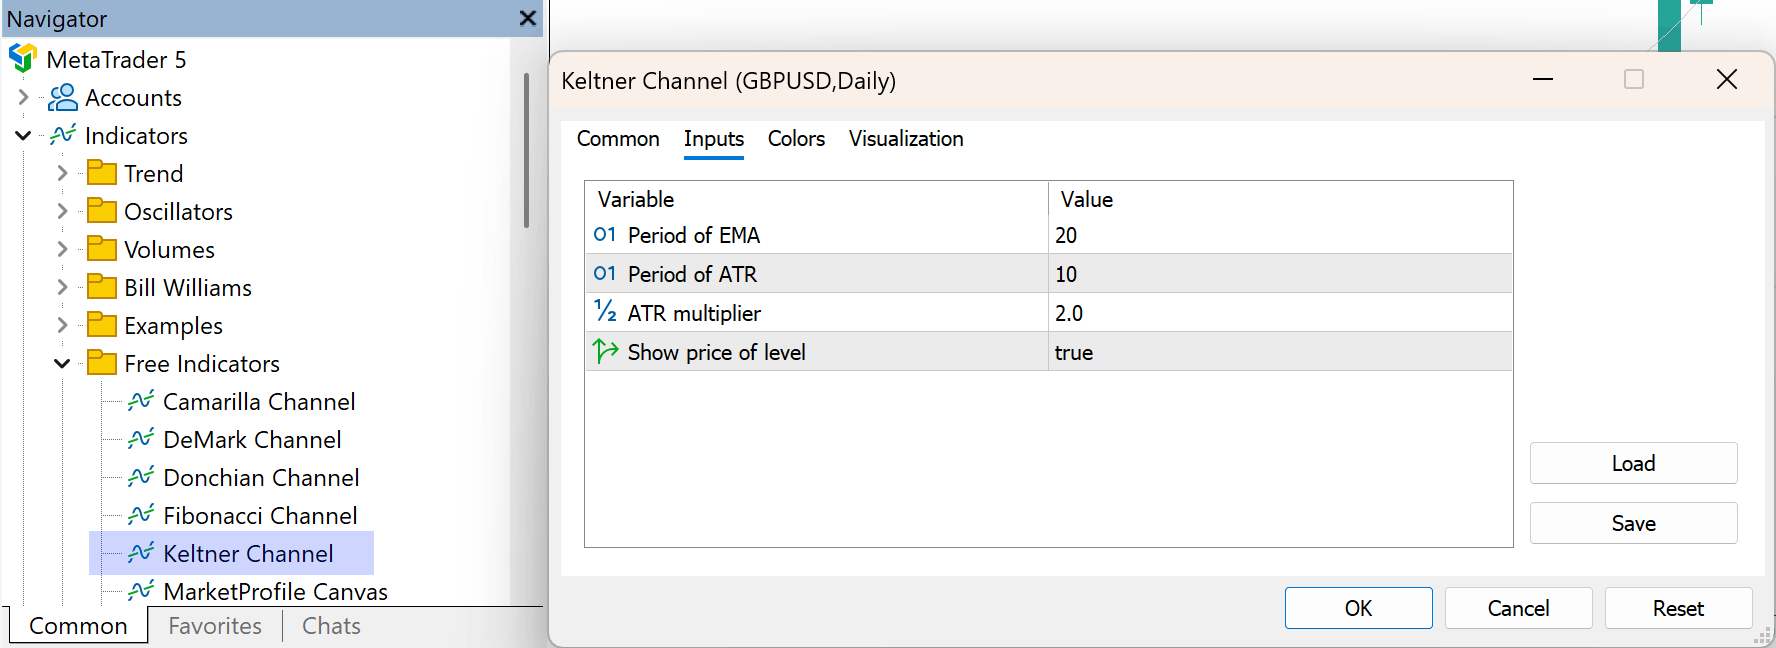
A commonly used configuration for the Keltner Channel uses a 20-period EMA, a 10-period ATR and a multiplier of 2, which places each outer band two ATR values away from the centre line. However, default settings may vary between trading platforms.
Keltner Channel Settings
Changing any of the three variables highlighted above alters how the indicator behaves.
Whilst changing the EMA and ATR period affects the indicator’s responsiveness to price and volatility, respectively, changing the ATR multiplier only changes the distance between the outer bands and the EMA.
As narrower bands are closer to the centre line, they will produce more signals, because price does not have to move as far to reach them. Wider bands will reduce the frequency with which price interacts with the bands, highlighting larger movements relative to recent volatility.
How to Use the Keltner Channel
Signals generated by the indicator can be used by traders to design a Keltner Channel strategy. In the following sections, we’ll examine some of the most common ways in which the Keltner Channel is used to generate signals: breakouts, pullbacks within a trend and mean reversion in a ranging market.
Keltner Channel Breakout Signals
When price closes outside the outer bands, it may be interpreted as evidence of strong momentum and could signal the start of a potential trend. Therefore, some traders may choose to consider long positions when price closes above the upper band and short positions when price closes below the lower band.
When the outer bands of the Keltner Channel narrow, it indicates a period of lower volatility. Such a squeeze may increase the likelihood of a sizeable price movement, although it does not indicate the direction of that move.
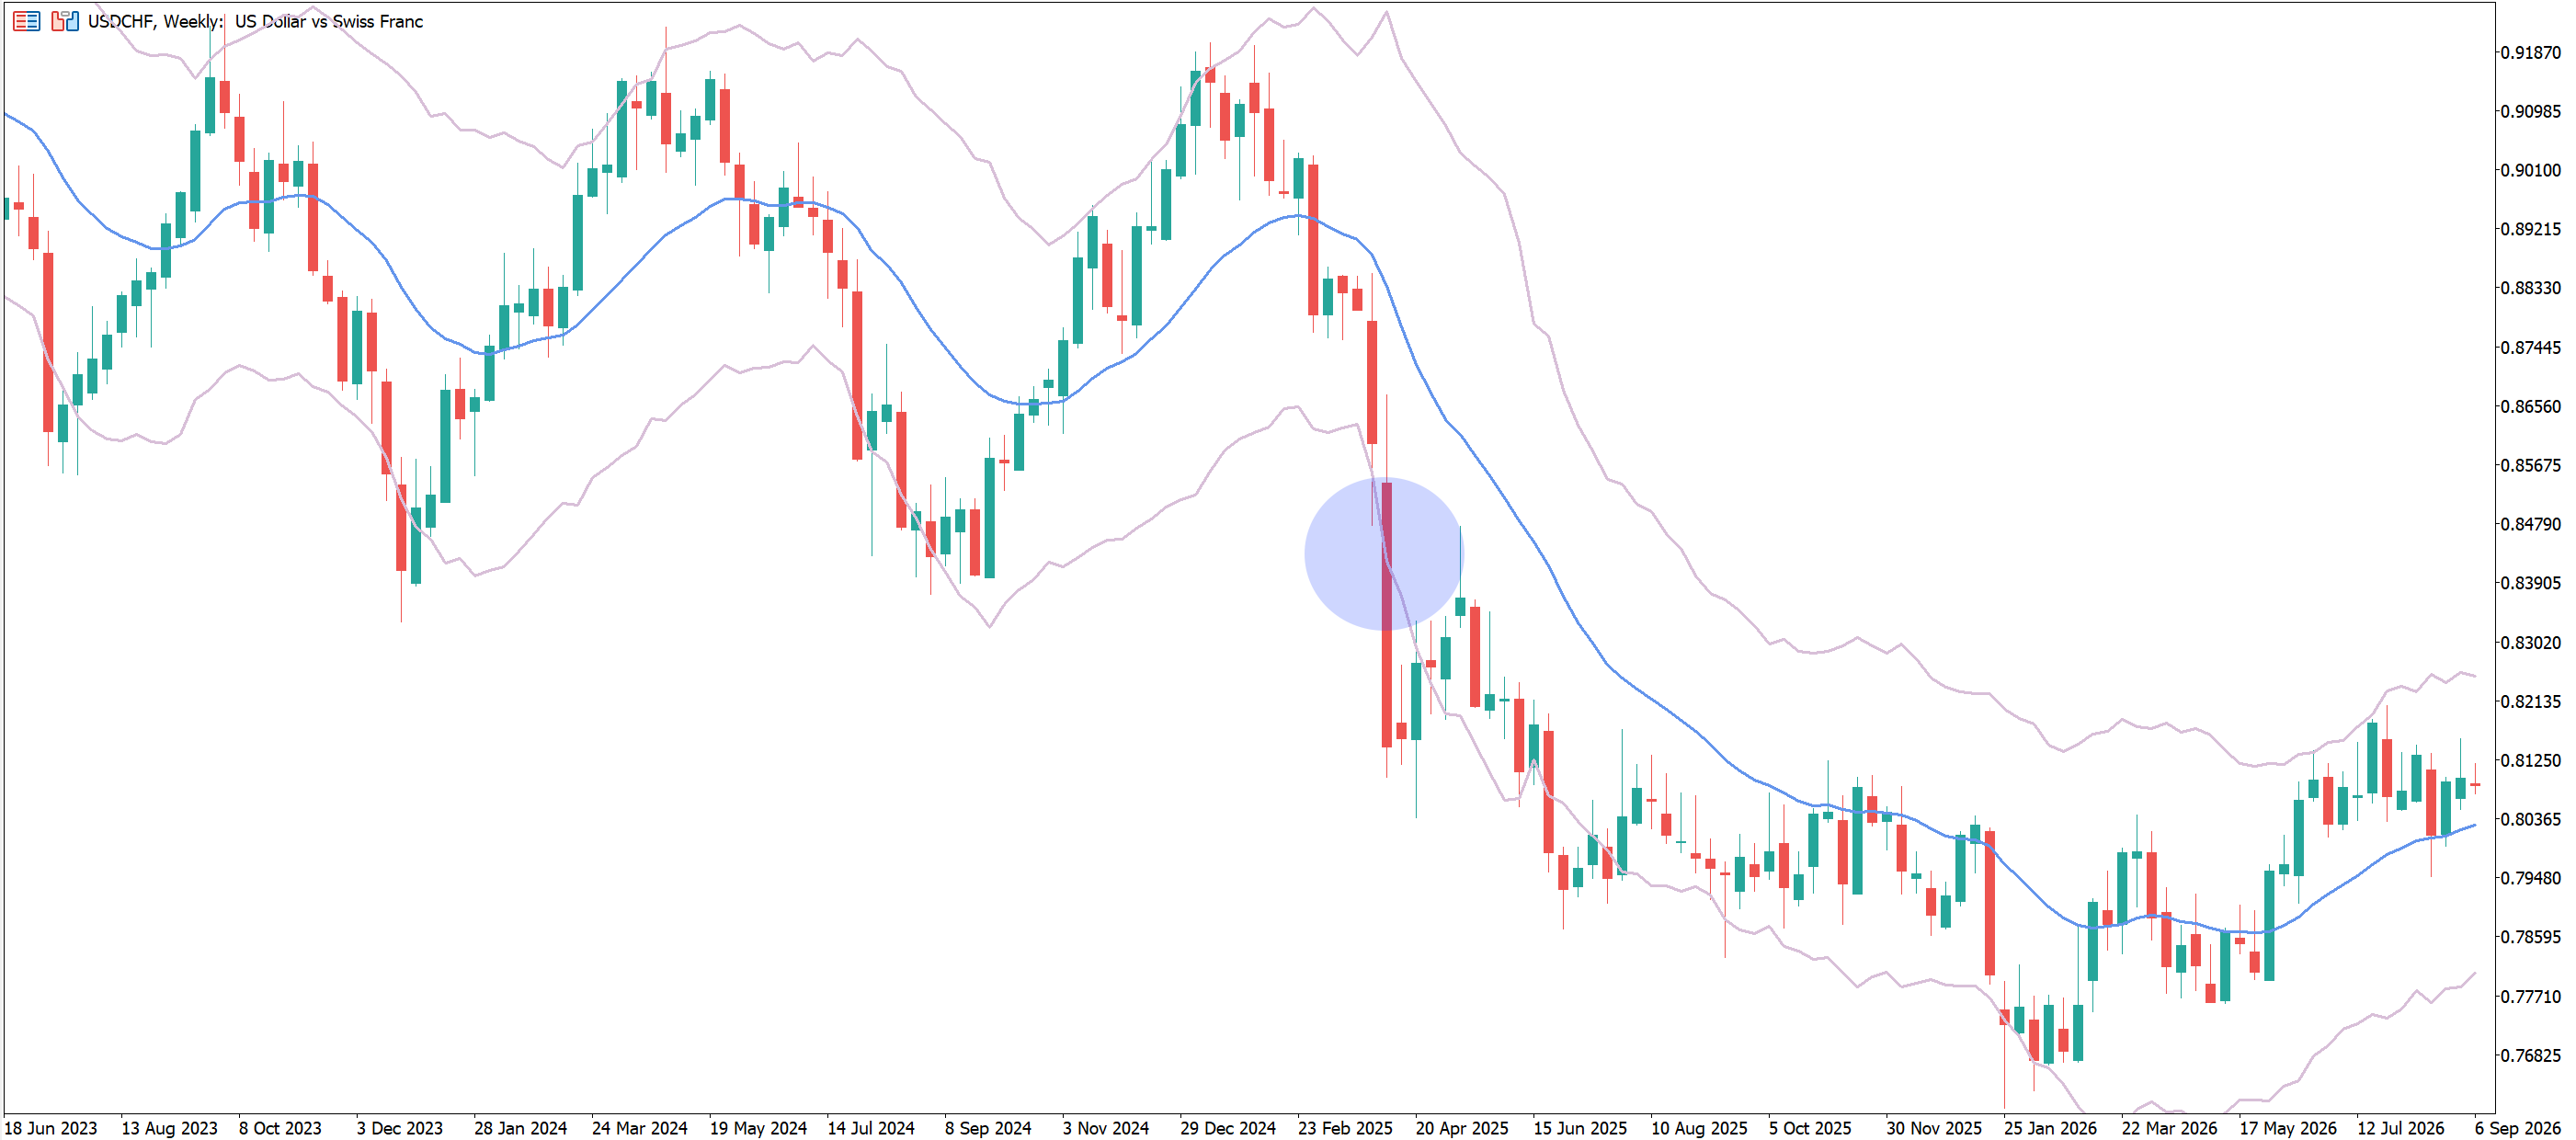
In the USDCHF weekly chart below, we can observe price closing decisively outside the lower band, which is followed by a prolonged downward move.
Keltner Channel Pullback Signals in a Trend
In an established uptrend, price may remain in the upper half of the channel and repeatedly reach or exceed the upper band. Rather than indicating an imminent reversal, such behaviour may simply be an indication of a strong trend. Similarly, in a strong downward trend, price may remain below the centre line and move repeatedly towards the lower band.
During a sustained trend, some traders may use the EMA as a reference point for entries during a pullback. The entry may be based on how price reacts to the centre line rather than simply making contact with it. Repeated crossings of the centre line, especially if accompanied by a flattening EMA, may indicate that the trend is weakening.
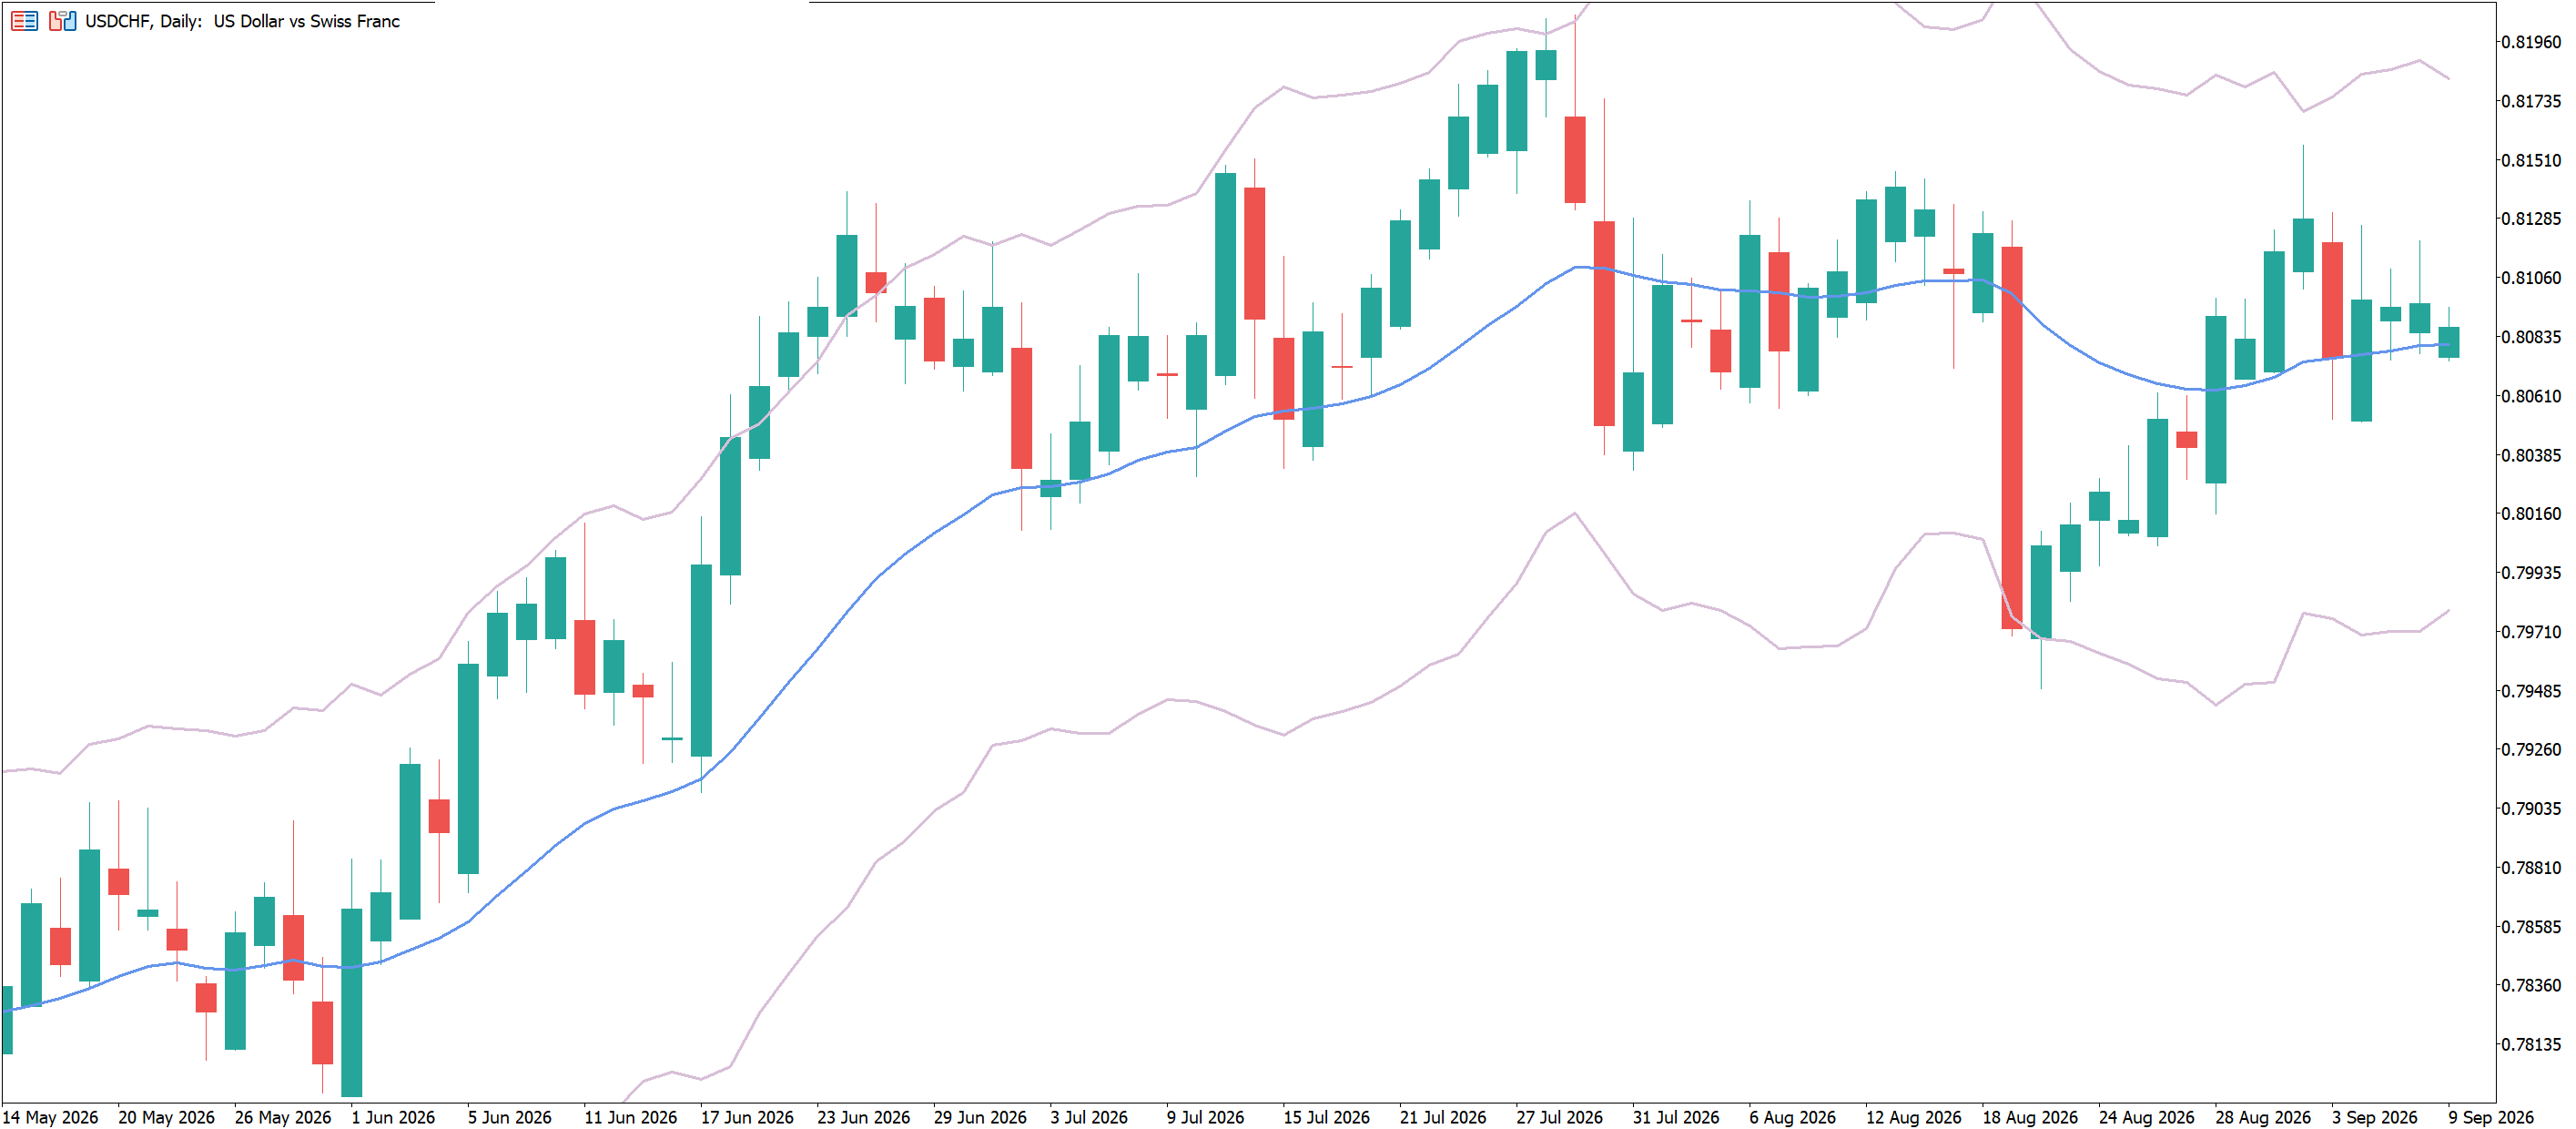
In the USDCHF daily chart below, we can see price initially following an uptrend. On a number of occasions, the price pulls back to the centre line before resuming its upward trajectory.
Using Keltner Channels in a Ranging Market
In a ranging market, price may move repeatedly between the outer bands. A move towards one of the bands may indicate that price has reached an extreme level relative to its recent average, which may create the possibility of a return towards the centre line.
However, the bands are not fixed support and resistance levels. If price closes beyond one band whilst the channel widens and the EMA turns in the same direction, the previous range may be giving way to a new trend.
Keltner Channels vs Bollinger Bands
Keltner Channels and Bollinger Bands are both volatility-based indicators consisting of a centre line and two outer bands. The main difference is how each indicator calculates the distance between those outer bands and the centre line.
The interpretation of the bands is fairly similar. Price moving towards or beyond an outer band may indicate strong momentum during a trend or possible overextension within a range. Alone, neither indicator can confirm which of these interpretations is correct without additional market context.
Neither indicator is necessarily better or more accurate; different traders may prefer one over the other based on their individual trading style or strategy.
How to Add the Keltner Channel to MT4 and MT5
How the Keltner Channel is added depends on which version of MetaTrader is being used. Whilst the indicator is included with MetaTrader 5, MetaTrader 4 users will need to install a custom version of the indicator.
Adding the Keltner Channel in MT5
The Keltner Channel can be found in the Navigator window on the left-hand side of the screen, under Indicators and Free Indicators. Drag the indicator onto a chart, adjust its inputs and select OK to apply it.
Adding the Keltner Channel in MT4
The Keltner Channel is not included among the standard package of MT4 indicators. However, Admirals users can access the indicator by installing the MetaTrader Supreme Edition add-on:
- Close MT4 and run the MetaTrader Supreme Edition installer.
- Reopen MT4 and open the Navigator window.
- Locate Indicators and then Custom Indicators.
- Find the Admiral Keltner and drag it onto the chart.
- Review the input parameters and select OK.
Advantages and Limitations of Keltner Channels
As with any indicator, Keltner Channels have both advantages and disadvantages.
Advantages
- The bands adjust to changing volatility: The outer bands expand when price movements become larger and contract when they become smaller, which helps prevent the bands becoming disproportionately narrow during volatile periods or too wide during quieter ones.
- Versatility: Traders can use Keltner Channels to help spot potential breakouts as well as pullbacks within an existing trend.
- They display trend and volatility together: The EMA provides a reference for trend direction, whilst the outer bands place price movements in the context of recent volatility.
Limitations
- They are based on historical price data: Both the EMA and ATR respond to movements that have already occurred, meaning the indicator lags behind price.
- Breakouts can produce false signals: Price may move beyond an outer band before quickly returning inside the channel, particularly in volatile or directionless markets.
- The outer bands are not necessarily reversal levels: During a strong trend, price can remain close to or beyond one band for an extended period.
- Signals are sensitive to the settings used: A narrow channel will generate more band crossings, whereas a wider channel requires a larger price movement before a breakout occurs.
- A squeeze provides no directional signal: Narrowing bands indicate declining volatility, but do not reveal when volatility will increase or which direction any subsequent move will take.
Frequently Asked Questions
What Is the Difference Between Keltner Channels and Donchian Channels?
Donchian Channels track recent price extremes, whereas Keltner Channels show price in relation to its average and recent volatility. Keltner Channels consist of three lines: an exponential moving average and two outer bands. The distance of these outer bands from the EMA is determined by the average true range.
On the other hand, Donchian Channels determine their outer boundaries using the highest high and lowest low recorded over a specified lookback period. Some versions also include a centre line representing the midpoint between the bands.
What Are Common Keltner Channel Settings?
The default settings for Keltner Channels typically consist of a 20-period EMA, a 10-period ATR and an ATR multiplier of 2.0. However, these settings are not a universal standard; different platforms may use different default values.
INFORMATION ABOUT ANALYTICAL MATERIALS:
The given data provides additional information regarding all analysis, estimates, prognosis, forecasts, market reviews, weekly outlooks or other similar assessments or information (hereinafter “Analysis”) published on the websites of Admirals investment firms operating under the Admirals trademark (hereinafter “Admirals”) Before making any investment decisions please pay close attention to the following:
- This is a marketing communication. The content is published for informative purposes only and is in no way to be construed as investment advice or recommendation. It has not been prepared in accordance with legal requirements designed to promote the independence of investment research, and that it is not subject to any prohibition on dealing ahead of the dissemination of investment research.
- Any investment decision is made by each client alone whereas Admirals shall not be responsible for any loss or damage arising from any such decision, whether or not based on the content.
- With view to protecting the interests of our clients and the objectivity of the Analysis, Admirals has established relevant internal procedures for prevention and management of conflicts of interest.
- The Analysis is prepared by an analyst (hereinafter “Author”), with the assistance of AI tools. The Author Roberto Rivero is a contractor for Admirals. This content is a marketing communication and does not constitute independent financial research.
- Whilst every reasonable effort is taken to ensure that all sources of the content are reliable and that all information is presented, as much as possible, in an understandable, timely, precise and complete manner, Admirals does not guarantee the accuracy or completeness of any information contained within the Analysis.
- Any kind of past or modelled performance of financial instruments indicated within the content should not be construed as an express or implied promise, guarantee or implication by Admirals for any future performance. The value of the financial instrument may both increase and decrease and the preservation of the asset value is not guaranteed.
- Leveraged products (including contracts for difference) are speculative in nature and may result in losses or profit. Before you start trading, please ensure that you fully understand the risks involved.