Trading Gold's Ascending Triangle Chart Pattern
Gold has had a roller coaster ride so far this year. From the beginning of the year, the gold price surged around 15% higher by the middle of March.
Falling a few points short of its record high in August 2020, the price of gold fell around 14% by May and has since moved sideways around the lows of the year.
The up and down volatility created by geopolitical events and central bank policy has created a bullish ascending triangle pattern on gold’s weekly price chart.
Learn how to trade gold below.
| Market: | Gold vs US Dollar |
| Trade.MT4 / Trade.MT5 Symbol: | GOLD |
| Date of Idea: | 14 June 2022 |
| Time Line: | 1 - 4 weeks |
| Entry Level: | 1,879.00 |
| Stop Loss Level: | 1,786.00 |
| Target Level: | 2,034.00 |
| Position Size for Trade.MT4 / Trade.MT5 Account: | Max 3% |
| Risk: | High |
- The Trade.MT4 and Trade.MT5 accounts allow you to speculate on the price direction of metals such as gold and other commodities using CFDs. This means you can trade long and short to potentially profit from rising and falling prices. Learn more about CFDs in this How to Trade CFDs article.
- The Invest.MT5 account allows you to buy real stocks and shares from 15 of the largest stock exchanges in the world. Gold investors may opt to purchase gold mining stocks or gold ETFs (exchange traded funds) which could also benefit from higher gold prices.
All trading is high risk and you can lose more than you risk on a trade. Never invest more than you can afford to lose as some trades will lose and some trades will win. Start small to understand your own risk tolerance levels or practice on a demo account first to build your knowledge before investing.

Why Invest in Gold?
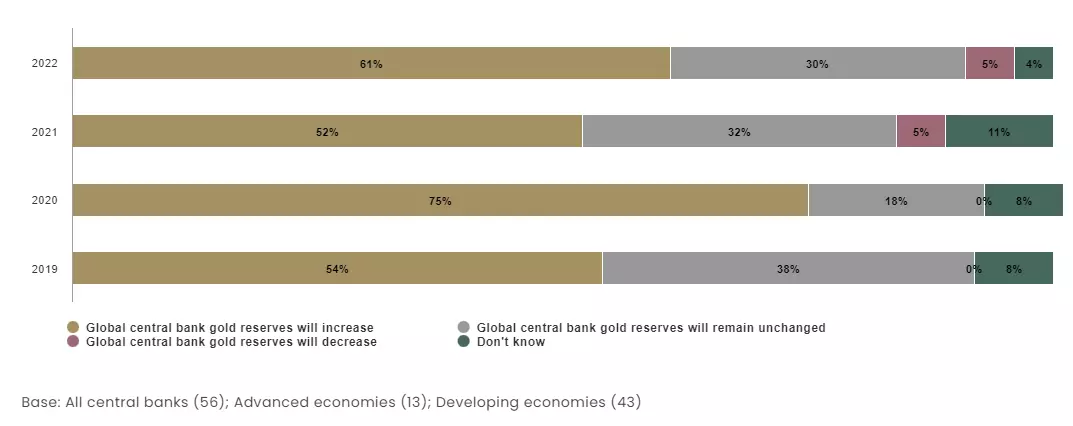
According to the World Gold Council’s annual central bank survey, 25% of respondents are planning to increase their gold reserves this year – up 21% from last year. Interestingly, 61% of respondents stated they expect global gold reserves to generally increase over the next 12 months.
In the first quarter of the year, gold ETFs (exchange traded funds) had their strongest quarterly inflows since Q3 2020, according to the gold demand trends report. The increase in demand has been influenced by a variety of factors such as geopolitical tensions in which gold is regarded as a safe haven asset.
Gold is also often seen as a hedge against inflation over the long term but it is also sensitive to interest rate hikes and the US dollar. The recent sell-off in gold coincided with strength in the US dollar and hawkish tones from the Federal Reserve regarding rising interest rates.
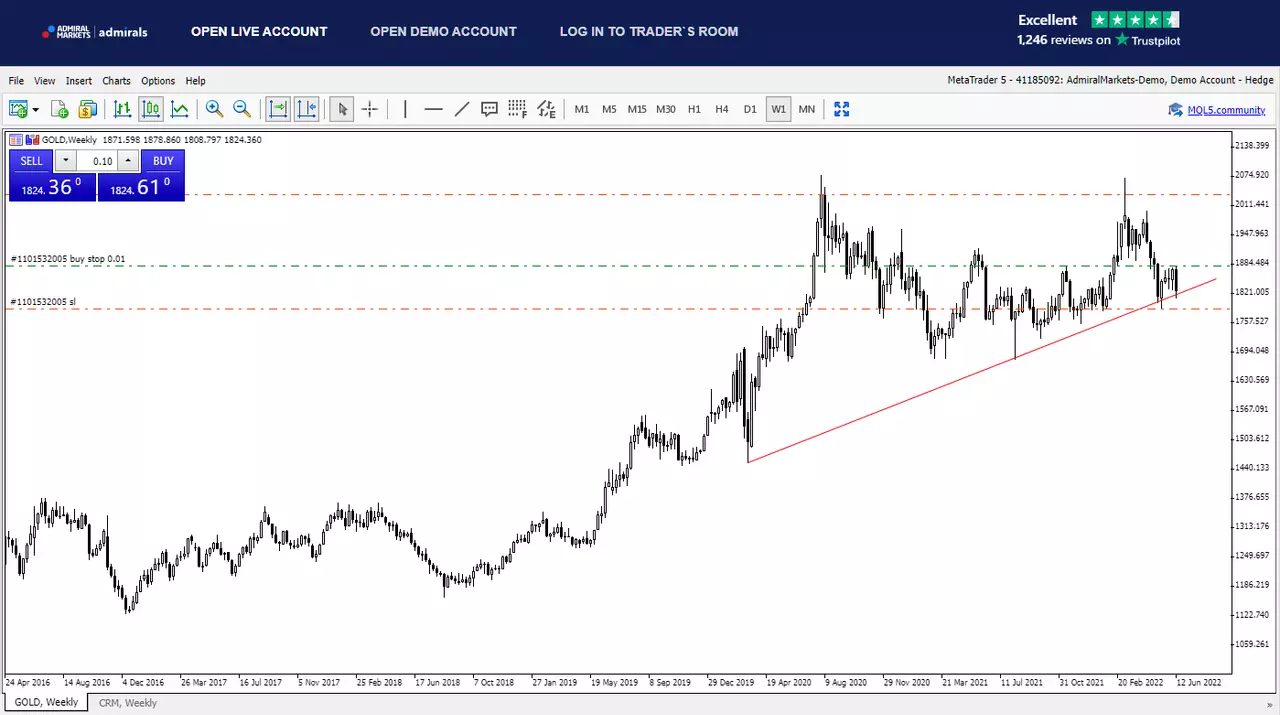
Gold Technical Analysis
The current price action on gold shows a bullish ascending triangle formation, as shown in the chart below. This price pattern forms when price cycles have been contained in between a horizontal resistance line and an ascending support line.
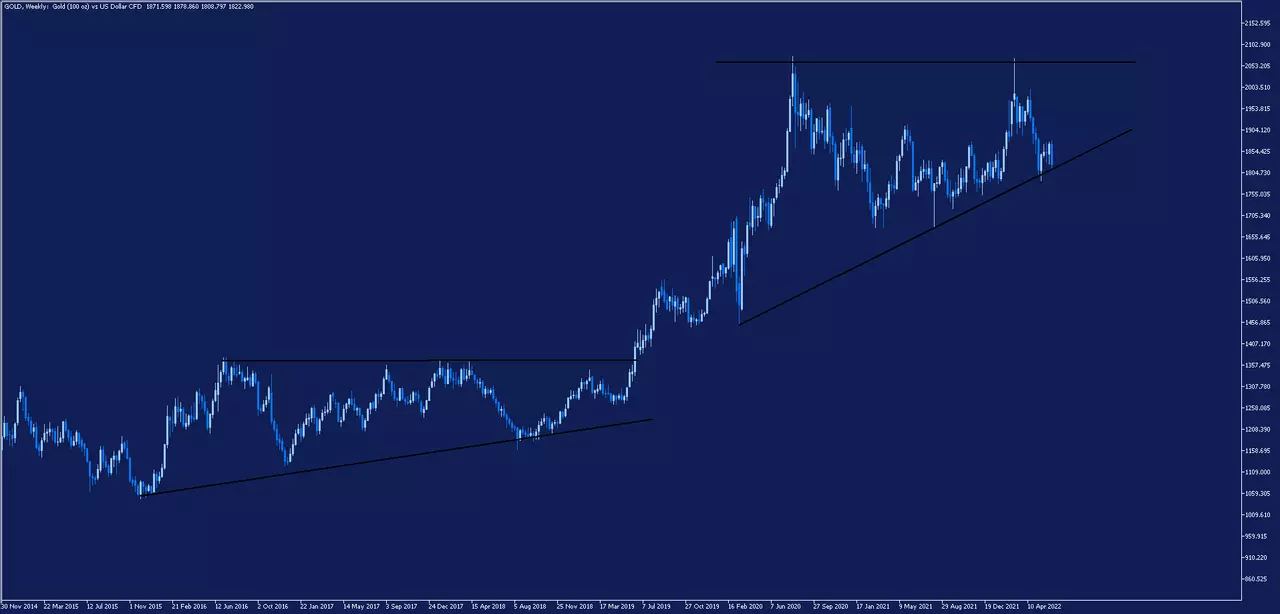
The price of gold also formed a bullish ascending triangle pattern between 2015 and 2019. Typically, traders would wait for the price to break outside of the triangle pattern and then confirm the trend through cycle analysis such as higher highs and higher lows for an uptrend or lower lows and lower highs for a downtrend.
However, some traders may also trade inside of the trading range at the horizontal resistance and ascending support line. It is a more aggressive approach as the price will break through the triangle pattern at some point.
Therefore, keeping the risk low is essential when operating inside of an ascending triangle pattern.
The Different Methods to Trade Gold
There are a variety of different ways to speculate on the price direction of gold. Some traders will trade gold CFDs (contracts for difference), which allow you to speculate on the price direction of gold without owning the underlying asset. This product also allows you to trade long and short and potentially profit from rising and falling prices.
You can learn more about CFD trading strategies in this Trading Strategies Guide for 2022.
You also have the choice to invest in gold ETFs (exchange traded funds). These funds essentially track the underlying price of gold by purchasing gold futures contracts or holding physical gold in secure vaults.
Some investors may also choose to invest in gold mining stocks which could benefit from a rise in the price of gold. However, there are other factors to consider when investing in gold mining stocks such as company fundamentals related to profit margins, etc.
With Admirals, you can trade on gold CFDs, gold mining stocks and gold exchange traded funds.
Alternatively, you can receive the performance of gold with zero holding costs from an Admirals Wallet account.
An Example Trading Idea for Gold CFDs
Based on the current ascending triangle pattern on the price of gold discussed above, an example trading idea for the Gold vs US dollar CFD could be as follows:
- Buy the Gold CFD on a break of the high of the current weekly candle testing the bottom of the ascending triangle pattern at 1,879.00 to allow for current market volatility around US news.
- Place a protective stop loss on a break of the low of the weekly candle which last tested the ascending support line at 1,786.00.
- Place a target just below the top of the ascending triangle pattern beneath the horizontal resistance line at 2,034.00.
- Keep your risk small at a maximum of 3% of your total account.
- Time Line = 1 – 4 weeks.
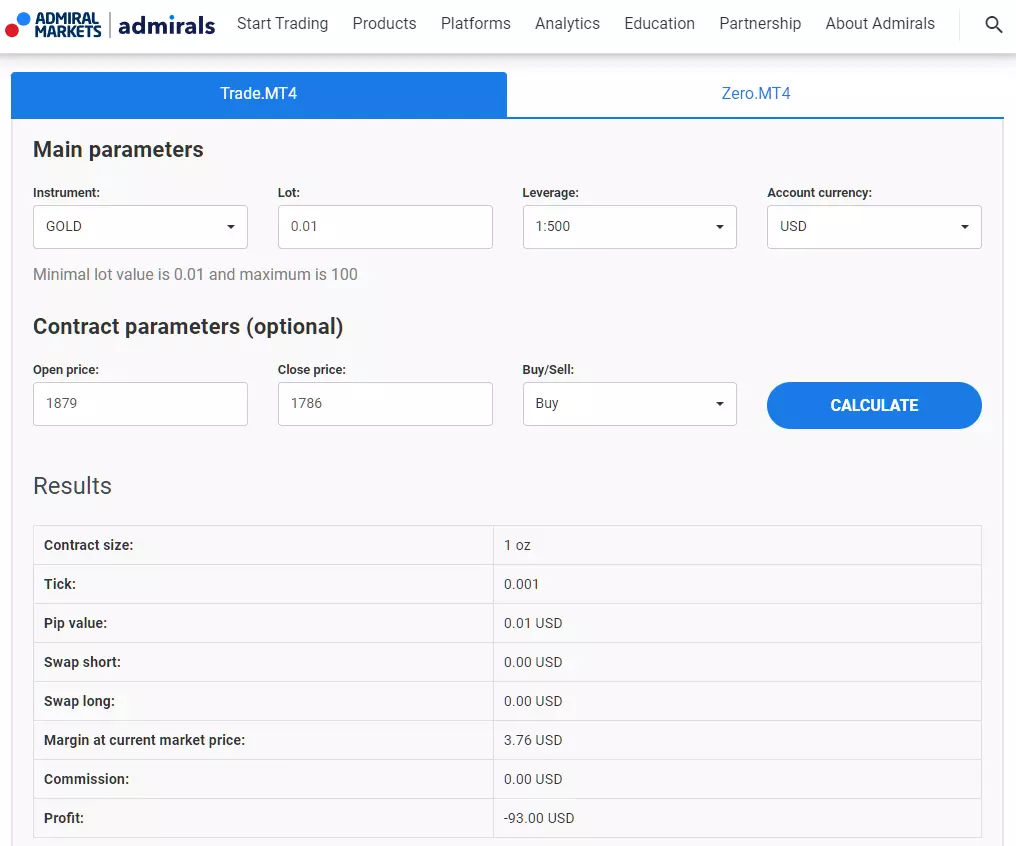
- If you traded with a position size of 0.01 lots, then:
- If your target is reached = $155.00 profit
- If your stop loss is reached = -$93.00 loss
It’s wise to remember that the price of gold is unlikely to go up in a straight line and it may even go much further down before it rises, especially considering how volatile gold price can be.
Therefore, be sure to exercise good risk management which is one of the most important aspects of trading successfully. You should always know how much you could potentially lose on a trade and the risks involved.
You can do this using the Admirals Trading Calculator for the Trade.MT4 account, as shown below:
Another factor to consider is the cost of trading gold CFDs. These include:
-
Spread. This is the difference between the buy price and the sell price of an instrument.
- Admirals' typical spread on gold is only 0.20 USD!
-
Commission. This is the cost to make a buy and sell transaction.
- From the Admirals Trade.MT4 and Trade.MT5 account there is ZERO commission to pay to buy or sell gold CFDs.
-
Swaps. This is the overnight fee to roll your position over to the next day.
- The current swap fee for the gold CFDs from the Trade.MT4 account is –14.21 for long positions and –10.618 for short positions.
You can find more details on the Admirals Contract Specification page.
How to Trade Gold CFDs in 4 Steps
You can trade Gold CFDs from the Trade.MT4 or Trade.MT5 accounts using the four-step process outlined below.
- Open an account with Admirals to access the Trader’s Room.
- Click on Trade on one of your live or demo accounts to open the web platform or download the MetaTrader 4 or MetaTrader 5 desktop platform.
- Search for GOLD at the bottom of the Market Watch window and drag the symbol onto the chart.
- Use the one-click trading feature, or right-click and open a trading ticket to input your trade size, stop loss and take profit level.
Click on the banner below to trade gold today! ▼▼▼

Do You See Gold Moving Differently?
Remember that all analytics and trading ideas are based on the personal view and experience of the author. If you believe there is a higher chance the gold price will lower, then you can also trade short from a CFD (Contracts for Difference) trading account which Admirals also provide.
Prefer to Invest in Gold?
If you prefer to invest in gold and want to try and capitalise on the performance of gold prices then you can do so with Admirals too!
The Admirals Wallet allows you to receive the performance of gold with zero holding costs.
All you need to do is transfer your investment capital (US dollars, euros, British pounds, etc), to the gold account from the Admirals Trader’s Room and then convert it back whenever you are ready.
Open an account today and see all the ways you can try to capitalise on the movement in gold today!

Trade with a Broker Who Puts Your Security First!
✔️ Insurance coverage up to £100,000 for Admiral Markets AS Jordan Ltd clients.
✔️ Insurance coverage up to €100,000 for Admirals Markets Cyprus Ltd clients.
✔️ Negative balance protection to protect against adverse movements in the market, causing your account to go below zero.
✔️ Volatility Protection. Limit the maximum price slippage and losses on both market and stop orders.
✔️ Advanced technical features for your personal risk management (partial stops, etc.)
✔️ Trade long and short using CFDs and potentially profit from rising and falling markets.
Learn more here on how Admirals protects your funds.
INFORMATION ABOUT ANALYTICAL MATERIALS:
The given data provides additional information regarding all analysis, estimates, prognosis, forecasts, market reviews, weekly outlooks or other similar assessments or information (hereinafter “Analysis”) published on the websites of Admirals’ investment firms operating under the Admirals trademark (hereinafter “Admirals”) Before making any investment decisions please pay close attention to the following:
- This is a marketing communication. The content is published for informative purposes only and is in no way to be construed as investment advice or recommendation. It has not been prepared in accordance with legal requirements designed to promote the independence of investment research, and that it is not subject to any prohibition on dealing ahead of the dissemination of investment research.
- Any investment decision is made by each client alone whereas Admirals shall not be responsible for any loss or damage arising from any such decision, whether or not based on the content.
- With a view to protecting the interests of our clients and the objectivity of the Analysis, Admirals has established relevant internal procedures for the prevention and management of conflicts of interest.
- The Analysis is prepared by an independent analyst, Jitanchandra Solanki (analyst), (hereinafter “Author”) based on their personal estimations.
- Whilst every reasonable effort is taken to ensure that all sources of the content are reliable and that all information is presented, as much as possible, in an understandable, timely, precise and complete manner, Admirals does not guarantee the accuracy or completeness of any information contained within the Analysis.
- Any kind of past or modelled performance of financial instruments indicated within the content should not be construed as an express or implied promise, guarantee or implication by Admirals for any future performance. The value of the financial instrument may both increase and decrease and the preservation of the asset value is not guaranteed.
- Leveraged products (including contracts for difference) are speculative in nature and may result in losses or profit. Before you start trading, please ensure that you fully understand the risks involved.

