Gold vs Real Rates vs USD – Why Historical Patterns No Longer Work Today
February 23, 2026 05:21
Why “yields down = gold up” is not a universal correlation and it generally does not hold since 2023
Gold, the US dollar, and real yields on US debt normally have the following relationships:
In the short run, there is a light inverse relationship between gold and the US dollar, as measured by the dollar index (DXY; it tracks the performance of gold against other currencies, predominantly euro and yen). Since gold, like other assets, including oil, are denominated in dollars, if the price of the dollar falls, this might help increase the price of gold and vice versa.
However, there are episodes when this connection is not strong or is not observed at all. Such episodes might include periods of strong liquidity demands and/or liquidity shortage on the international markets. Sometimes this coincides with other risks in the financial markets, which could simultaneously be beneficial for gold.
The information in this article is provided for educational purposes only and does not constitute financial advice. Consult a financial advisor before making investment decisions.
Here is part of how this could work: Huge amounts of debt globally are denominated in United States dollars (the so-called Eurodollar system) and debtors would have to buy dollars to repay their obligations, no matter how expensive the dollar is, hence in periods of stress (often when there is stress in the entire financial or forex system) this demand could further prop up the price of the dollar against other currencies.
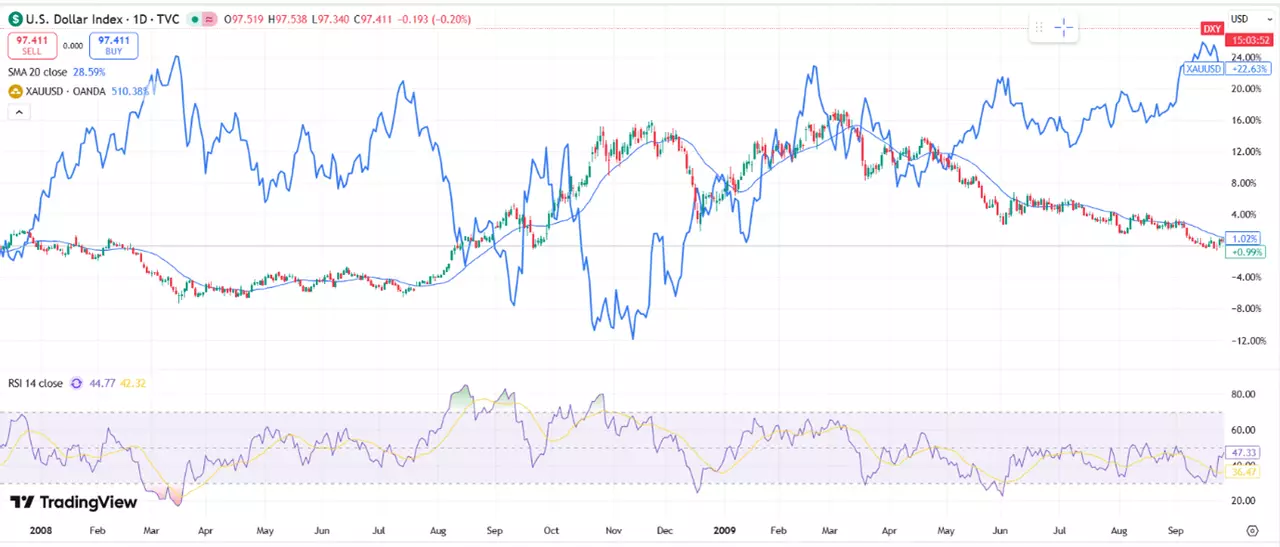
Hence sometimes both gold and the dollar could go up together at the same time. Such dynamics could be observed in the period after the onset of the Great Recession on Chart 1.
Chart 1
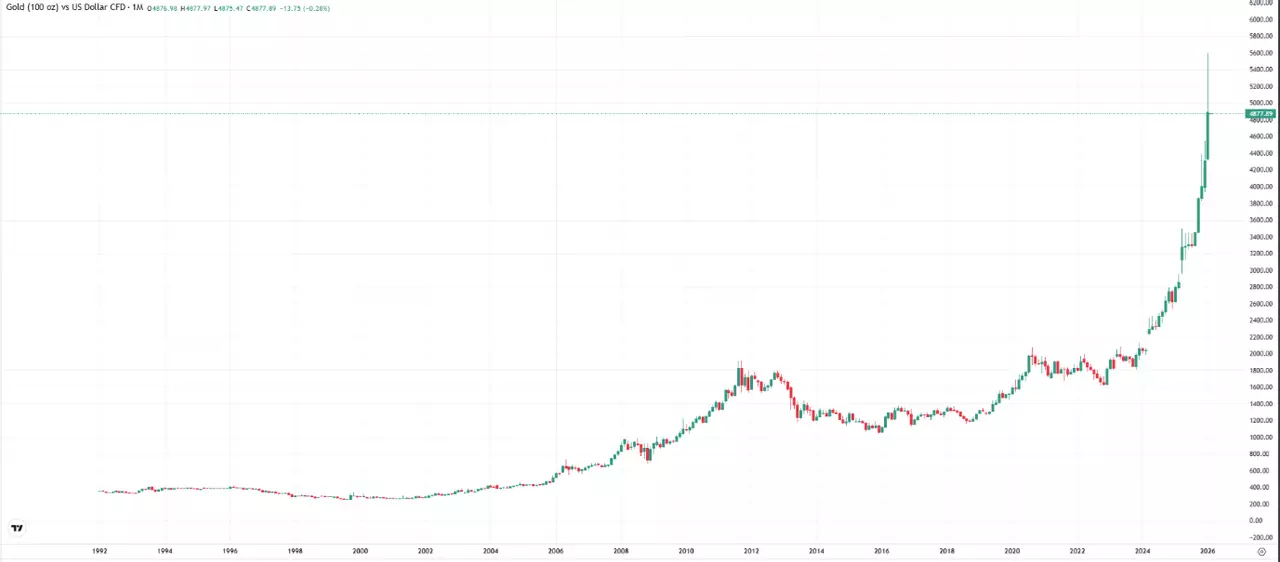
Over the long run, the dollar, like other fiat currencies, is continuously depreciating against gold, as we can see in the chart below.
Chart 2
Changes in yield on US bonds could affect the price of the dollar against other currencies also. Higher relative yields can lead to increased demand for dollars internationally. It should be noted that normally there is a strong demand for dollars globally, because the dollar is the world reserve currency.
Gold and Interest Rates on US Government Bonds Historically
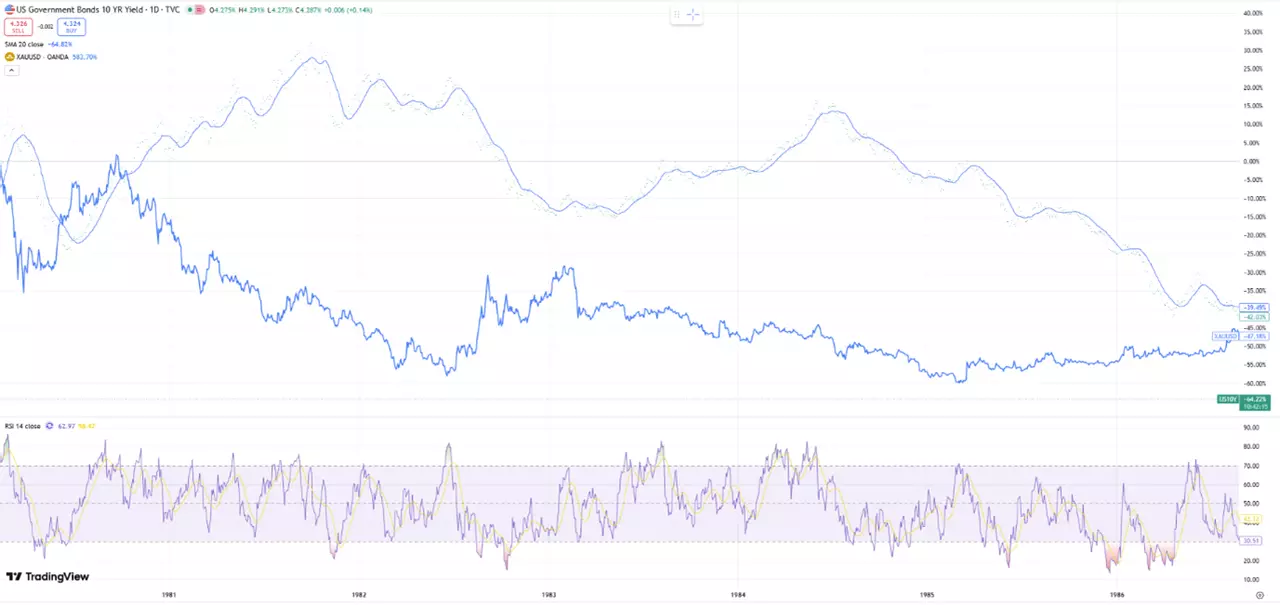
Historically there was a stronger inverse correlation between gold and yield on the 10-year United States bonds (we are using them as comparison, since they are the benchmark rate). This correlation tends to hold true in different regimes, as we see during the disinflationary 1980s in the United States on Chart 3.
Chart 3
Still, it has to be observed that other major factors, like central bank decisions, demand and supply factors, and others, as we will see in a moment, could influence this connection.
It also need to be noted that when deciding between gold and US bonds as a long-term instrument, investors take into consideration the real yield: nominal bond yield minus inflation. When inflation is high, real yield on bonds could even be negative, meaning investors are losing money by holding the said bond. Episodes of high inflation in particular tend to be very scary for the bonds markets overall.
Why Correlation Between Gold and Bonds Existed?
Why the inverse correlation? Both US government bonds and gold are regarded as safe-haven assets internationally. But there is at least one important distinction is:
- Gold does not produce cash flows.
- US bonds do, in the form of interest.
Hence, higher yields could lead to increased demand for US debt instruments and reduced demand for gold, thus could push the price of gold down.
Another difference is the financial position of the US government. Because of continuous deficits and reduced long-term rating, investors could demand higher yields, even though US bonds are used as collateral globally.
However, it needs to be noted that while sometimes yields on US government bonds could affect the price of gold, the reverse is scarcely true. Yields on long-term bonds depend predominantly on:
- Expected inflation over the long run
- Expected GDP growth
- Other risks and uncertainties (like geopolitical factors; however, they play less of role compared to the previous two)
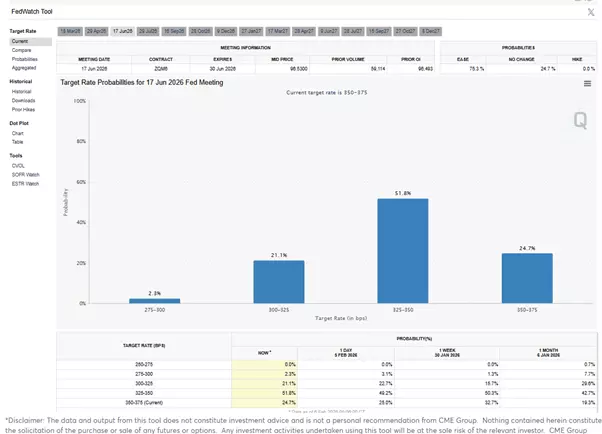
For bonds with shorter maturities (1-year, 5-year, several moths) monetary policy of the Federal Reserve and policies of the US Treasury could play a much more prominent role in affecting the bond yields.
Gold and Yields – Is This Time Different?
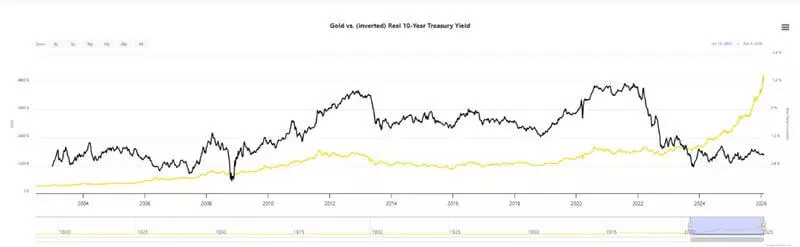
“This time is different” tends be a scary saying on the markets. Yet since 2023 the inverse correlation between 10-year yields and the price of gold has broken.
As can be observed on Chart 4, both gold and the yield on the 10-year government bond tend to be rising, even though the Federal Reserve resumed interest rates cuts in September 2024 (please note, that the chart for the 10-year yield is inverted).
Chart 4
Such a dynamic could be explained by new risks in the global financial system. Some of them include, among others:
- Freezing of sovereign country’s assets;
- The possible threat to use the dollar and/or the SWIFT system as political instrument;
- Unprecedented monetary intervention by many central banks since 2020;
- High international trade uncertainty, brought by changes in the supply chains and political decisions (like the ongoing tariff confrontations and risk of export restrictions, especially on commodities like rare earth minerals);
- Military conflicts – still ongoing and potential ones;
- Some of the leading global economies are weak;
- New political treaties and coalitions.
These can explain the fact that central banks are buying the highest amounts of physical gold since 1971, when the last iteration of the gold standard (the so-called Bretton-Woods system) was discontinued by Richard Nixon. They could also explain why investors would require higher yields for government bonds – because of high perceived risks for higher inflation and weak economic growth in the future.
Chart 5
Furthermore, in many regions, including the US and Japan, we observe higher inflation than central banks’ goals, expectations for further interest rate cuts, and increase of central banks balance sheets and/or fiscal stimulus, with continued high government spending and budget deficits in many countries. Historically all of these tend to be inflationary, hence this is part of the potential explanation for the higher demanded yields on government bonds and the higher price of gold.
Practical Implications of the “New Regime” of High Gold and High Bond Yields
Now that we understand the basic relationship between the US dollar (as represented by the DXY), the nominal and real yield on US bonds, and the price of the dollar, and that we already explained some risks in the system, what are the practical implications for traders and investors?
- Politics dominates like never before – we must keep an eye on political and central banks’ decisions like never before. Possibly this new “regime” of high gold prices and relatively higher bond yields, but potentially weak dollar, could extend into the future, especially if the risks mentioned above are still present and global geopolitical relations are strained.
- Markets could change at an instant – one political decision could move markets and could disrupt our strategies, or potentially create new opportunities, as we have seen multiple times over the previous year.
- Higher volatility and prolonged inflation mean increased need to hedge our exposure or to protect our savings – something to consider, when participating in the markets or when trying to protect to purchasing power of our savings. It might be a good idea to consider even more diversified portfolio, especially if investing for the long run.
- Both gold and US government bonds are regarded as a safe-haven assets – and having central banks, which are key players in monetary decisions, accumulate them further, could mean that they are expecting continuous risks ahead. It is a good idea to consider this if you are interested in these assets or in the markets overall.
- Both gold and yield on government bonds are forward looking – meaning they often move because of expected risks. Thus, having them move in tandem (more or less) over the course of the past three years could be a very important indication that market participants are expecting further risks. However, potential episodes of renewed high inflation could threaten bonds and fixed-income instruments in general.
- Current dynamics show that when participating on the market it is more important than ever to consider liquidity (increased demand in safe-haven assets could reduce liquidity and/or appetite for risk assets) and rotation between sectors.
Of course, the price of no instrument could go in one direction only. Thus, it might be prudent to consider the above-mentioned considerations, while still beware of overextended rallies, market hype, and FOMO buying, which was observed with gold in late 2025 and in the beginning of 2026.
Historically many of the listed trends were beneficial for safe-haven assets. However, even though many trends (like the increased government spending and accumulated deficits, trade tensions, and conflicts in various parts of the world) are hard to reverse, as we mentioned already, a sudden political decision or series of decisions could change the entire setup discussed. Current dynamics require investors and traders to be more attentive and flexible than ever before.
- Gold vs. Real Yields - Updated Chart | LongtermTrends
- Gold Prices and U.S. Dollar Correlation - 10 Year Chart | MacroTrends
- The Dollar During the Global Recession: US Monetary Policy and the Exorbitant Duty - Federal Reserve Bank of Boston
The given data provides additional information regarding all analysis, estimates, prognosis, forecasts, market reviews, weekly outlooks or other similar assessments or information (hereinafter “Analysis”) published on the websites of Admirals investment firms operating under the Admirals trademark (hereinafter “Admirals”) Before making any investment decisions please pay close attention to the following: