How to Trade AMD After Q1 2026 Earnings


Founded in 1969 as a Silicon Valley start-up, Advanced Micro Devices (NASDAQ: AMD) is a global semiconductor company that designs high-performance processors and graphics chips used across data centres, personal computers, gaming consoles, and embedded systems.
Its products include the EPYC server processors, Instinct graphics processing units (GPUs) for AI workloads, Ryzen desktop and laptop processors, Radeon graphics cards, and a range of chips for industrial and embedded applications.
The company recently reported its first-quarter 2026 results. Here is a closer look at its performance and what analysts are forecasting for the stock.
The information in this article is provided for educational purposes only and does not constitute financial advice. Consult a financial advisor before making investment decisions.
- The Invest.MT5 Account allows you to buy real stocks and shares from some of the largest stock exchanges in the world.
- Risk Warning: Past performance is not a reliable indicator of future results or future performance. All trading is high risk, and you can lose more than you risk on a trade. Never invest more than you can afford to lose as some trades will lose and some trades will win. Start small to understand your own risk tolerance levels or practice on a demo account first to build your knowledge before investing.
- Trading is not suitable for everyone. Trading is highly speculative and carries a significant risk of loss. While it offers potential opportunities, it also involves high volatility, and leveraged trading can amplify both gains and losses. Retail investors should fully understand these risks before trading.

AMD’s Q1 2026 Earnings Performance Summary
Key Takeaways
- Total revenue reached $10.25 billion, up 38% year-on-year (YoY). Revenue growth was driven by surging demand for AI infrastructure, with the Data Center segment now the primary engine of both revenue and earnings. Chief Financial Officer and treasurer Jean Hu noted that the quarter delivered "accelerating revenue growth, earnings expansion and record quarterly free cash flow."
- On a non-GAAP basis, gross margin, the percentage of revenue remaining after the cost of production, expanded to 55%, up from 54% in the same period a year ago.
- Non-GAAP operating income rose 43% YoY to $2.5 billion, and non-GAAP net income grew 45% YoY to $2.3 billion.
- Free cash flow, the cash the business generates after funding its own capital expenditure, reached $2.6 billion for the quarter, described by management as a record. This compares with $727 million in Q1 2025, representing a more than threefold increase YoY.
- Performance across AMD's three segments was broadly positive:
-
- Data Center posted revenue of $5.8 billion, up 57% YoY, driven by strong demand for EPYC processors and the continued ramp-up of Instinct GPU shipments. This segment is now the largest contributor to AMD's revenue.
- Client and Gaming, which covers Ryzen PC processors, Radeon graphics cards, and semi-custom chips used in gaming consoles, generated $3.6 billion in revenue, up 23% YoY.
- Embedded, which includes processors and programmable chips for industrial, communications, and edge computing applications, contributed $873 million in revenue, up 6% YoY, as demand strengthened across several end markets.
- On the outlook, management guided for second-quarter 2026 revenue of approximately $11.2 billion (± $300 million), implying YoY growth of approximately 46% and a quarter-on-quarter increase of approximately 9%. Non-GAAP gross margin for Q2 is expected to be approximately 56%.
Source: AMD Q1 2026 Press Release
AMD’s 12-Month Analyst Stock Price Forecast
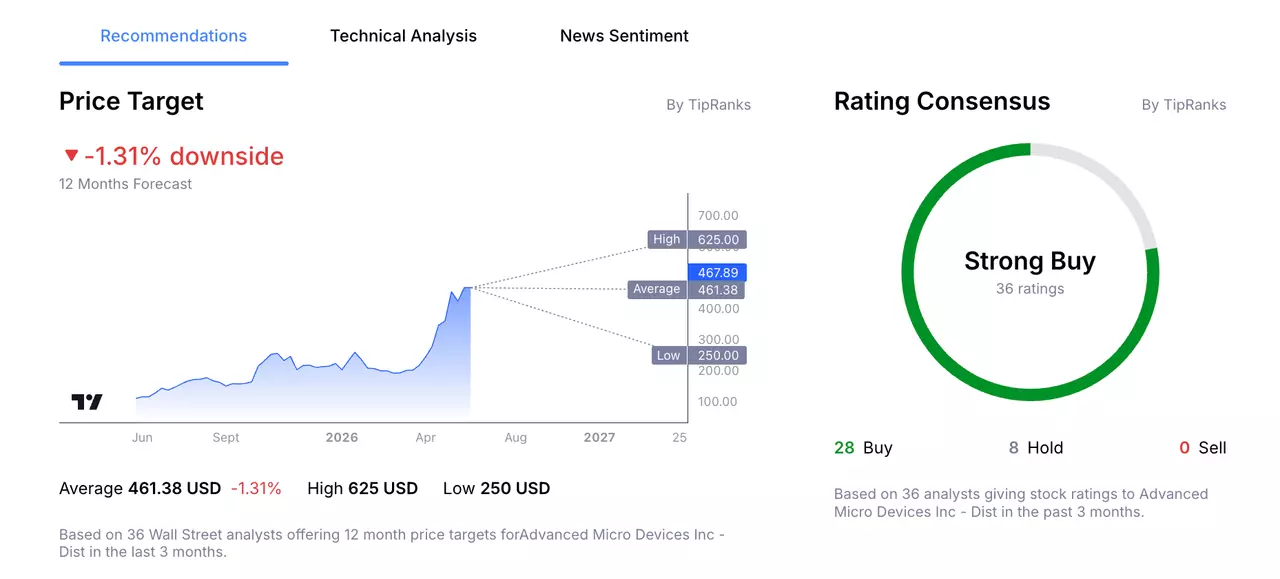
According to 36 Wall Street analysts, polled by TipRanks, offering a 12-month stock price forecast for AMD over the past 3 months:
- Buy Ratings: 28
- Hold Ratings: 8
- Sell Ratings: 0
- Average Price Target: $461.38
- High Price Target: $625.00
- Low Price Target: $250.00
Trading Strategy Example: Advanced Micro Devices Inc.
The following trading examples are for educational purposes only and do not constitute investment advice. Investors should conduct independent research before making trading decisions. An example trading idea for the AMD share price could be as follows:
Remember, markets are volatile, and AMD’s share price can fluctuate and may even trend lower. While AMD reported strong quarterly results, factors such as product transitions, pricing dynamics, and changes in enterprise spending may influence financial performance over time.
It is also worth noting that AMD's share price had already risen significantly ahead of the results, gaining more than 100% in 2026 at the time of writing, which could lead to some near-term profit-booking despite solid operational performance.
How to Buy AMD Stock in 4 Steps
- Open an account with Admirals and complete the onboarding process to access the dashboard.
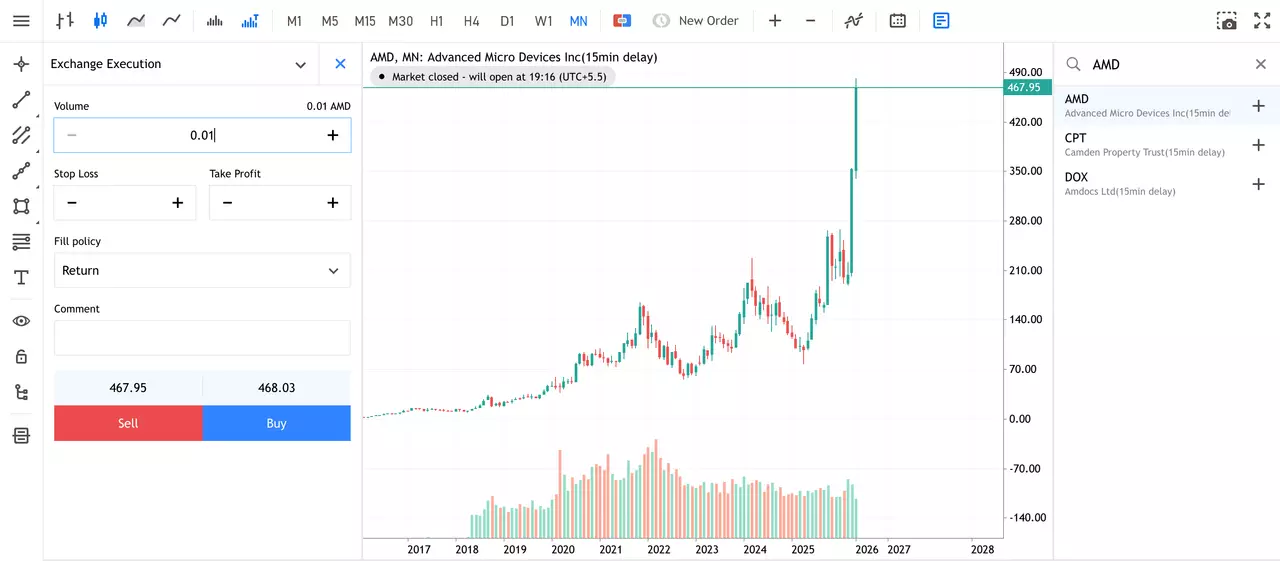
- Click on Trade or Invest on one of your live or demo accounts to open the web platform.
- Search for your stock in the search window at the top.
- Input your entry, stop-loss and take profit levels in the trading ticket.
Do You See the AMD Stock Price Moving Differently?
If you believe there is a higher chance that the share price of AMD will move lower, then you can also trade short using CFDs (Contracts for Difference). However, these have higher associated risks and are not suitable for all investors. Learn more about CFDs in this How to Trade CFDs article.
The given data provides additional information regarding all analysis, estimates, prognosis, forecasts, market reviews, weekly outlooks or other similar assessments or information (hereinafter “Analysis”) published on the websites of Admirals investment firms operating under the Admirals trademark (hereinafter “Admirals”) Before making any investment decisions please pay close attention to the following:
- This is a marketing communication. The content is published for informative purposes only and is in no way to be construed as investment advice or recommendation. It has not been prepared in accordance with legal requirements designed to promote the independence of investment research, and that it is not subject to any prohibition on dealing ahead of the dissemination of investment research.
- Any investment decision is made by each client alone whereas Admirals shall not be responsible for any loss or damage arising from any such decision, whether or not based on the content.
- With view to protecting the interests of our clients and the objectivity of the Analysis, Admirals has established relevant internal procedures for prevention and management of conflicts of interest.
- The Analysis is prepared by an analyst (hereinafter “Author”). The Author Clarice Mendonsa is a contractor for Admirals. This content is a marketing communication and does not constitute independent financial research.
- Whilst every reasonable effort is taken to ensure that all sources of the content are reliable and that all information is presented, as much as possible, in an understandable, timely, precise and complete manner, Admirals does not guarantee the accuracy or completeness of any information contained within the Analysis.
- Any kind of past or modelled performance of financial instruments indicated within the content should not be construed as an express or implied promise, guarantee or implication by Admirals for any future performance. The value of the financial instrument may both increase and decrease and the preservation of the asset value is not guaranteed.
- Leveraged products (including contracts for difference) are speculative in nature and may result in losses or profit. Before you start trading, please ensure that you fully understand the risks involved.