How to Trade Royal Bank of Canada After Q3 Earnings


The Royal Bank of Canada (RBC) is Canada's largest bank in terms of both assets and market capitalisation.
Last week, the bank reported earnings for the third quarter of its 2026 financial year, which covered the three months ended 31 July 2026. Net income hit a record for the quarter, as RBC exceeded expectations on the top and bottom lines. However, performance varied across the bank’s different segments and provisions for credit losses rose. Keep reading to find out more and learn what analysts are predicting for the stock.
The information in this article is provided for educational purposes only and does not constitute financial advice. Consult a financial advisor before making investment decisions.
- The Invest.MT5 Account allows you to buy real stocks and shares from some of the largest stock exchanges in the world.
- Risk Warning: Past performance is not a reliable indicator of future results or future performance. All trading is high risk, and you can lose more than you risk on a trade. Never invest more than you can afford to lose as some trades will lose and some trades will win. Start small to understand your own risk tolerance levels or practice on a demo account first to build your knowledge before investing.
- Trading is not suitable for everyone. Trading is highly speculative and carries a significant risk of loss. While it offers potential opportunities, it also involves high volatility, and leveraged trading can amplify both gains and losses. Retail investors should fully understand these risks before trading.

Royal Bank of Canada Q3 Performance Summary
Key Takeaways:
- Revenue rose 9% to C$18.54 billion, beating analyst expectations.
- Net income increased 11%, hitting a record C$6.02 billion for the quarter.
- Reported diluted earnings per share was C$4.23, up 13% year on year. Adjusted diluted EPS grew 11% to C$4.28, exceeding the analyst consensus of C$4.08.
- Performance by segment was mixed, with three of the bank’s five businesses growing year on year.
- Bottom line growth was powered by Wealth Management, with segmental net income jumping 32% to C$1.44 billion.
- Capital Markets net income grew 16% to C$1.54 billion.
- Commercial Banking net income was C$936 million, an increase of 12%.
- Personal Banking, the largest contributor to total net income, saw its net income decline 1% to C$1.92 billion.
- Insurance net income fell 20% to C$197 million.
- Return on Equity was 17.9%, up from 17.3% a year before. On an adjusted basis, ROE was 18.1%, up from 17.7% a year before.
- The bank’s provision for credit losses rose 14% to C$1 billion, primarily due to higher provisions in Capital Markets and Personal Banking, which were partially offset by lower provisions in Commercial Banking.
- Royal Bank of Canada repurchased C$1.6 billion worth of shares during the quarter and declared a quarterly dividend of C$1.76 per share.
Royal Bank of Canada 12-Month Analyst Stock Price Forecast
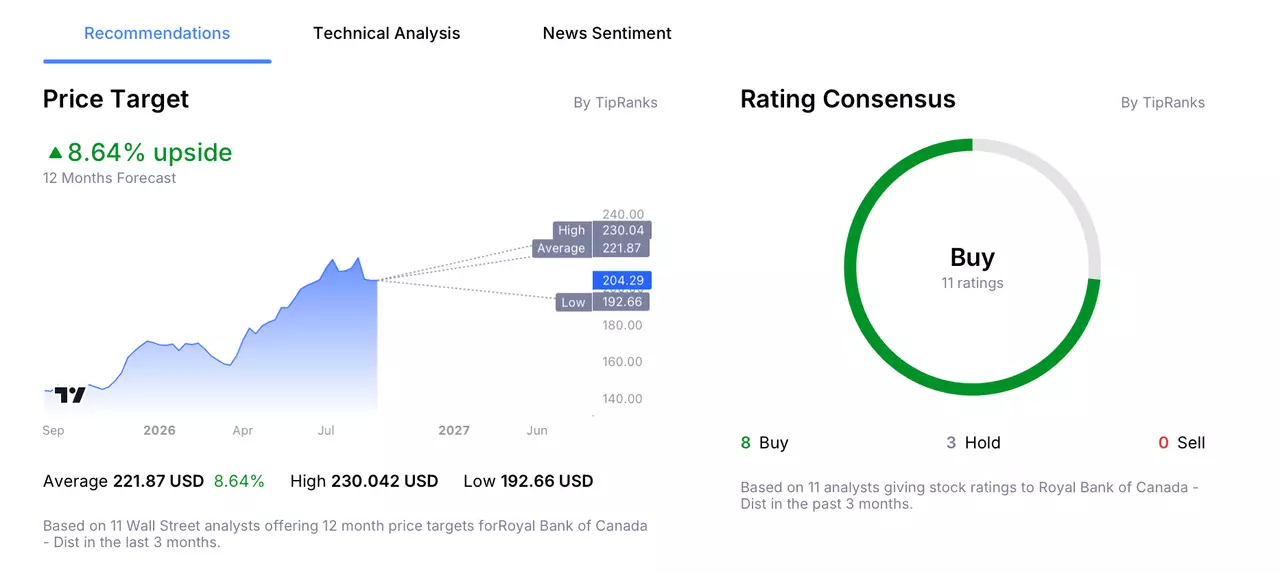
According to 11 Wall Street analysts, polled by TipRanks, offering a 12-month stock price forecast for Royal Bank of Canada over the past 3 months:
- Buy Ratings: 8
- Hold Ratings: 3
- Sell Ratings: 0
- Average Price Target: $221.87
- High Price Target: $230.04
- Low Price Target: $192.66
Trading Strategy Example: Royal Bank of Canada
The following trading examples are for educational purposes only and do not constitute investment advice. Investors should conduct independent research before making trading decisions. An example trading idea for Royal Bank of Canada could be as follows:
Royal Bank of Canada has recorded a strong performance in the stock market this year, with shares up around 20% year to date. As a result, the bank is now trading at around 18 times trailing earnings, which is relatively high compared to its historical average.
This isn’t unique to RBC. Indeed, as a group, Canada’s banks are trading at an average of around 15 times forward earnings, which is the most expensive they have been since 2010.
Consequently, whilst this earnings season has been positive for RBC, and Canadian banks in general, a lot of this may already be reflected in share prices.
Focusing on RBC specifically, segmental performance was uneven. The bank’s largest contributor to earnings, Personal Banking, actually slipped year on year. Wealth Management and Capital Markets drove most of the quarter’s bottom line growth. Their performance was driven by favourable market conditions, including higher asset values and stronger equity market activity. A reversal in those conditions could weigh on earnings in the future.
How to Buy Royal Bank of Canada Stock in 4 Steps
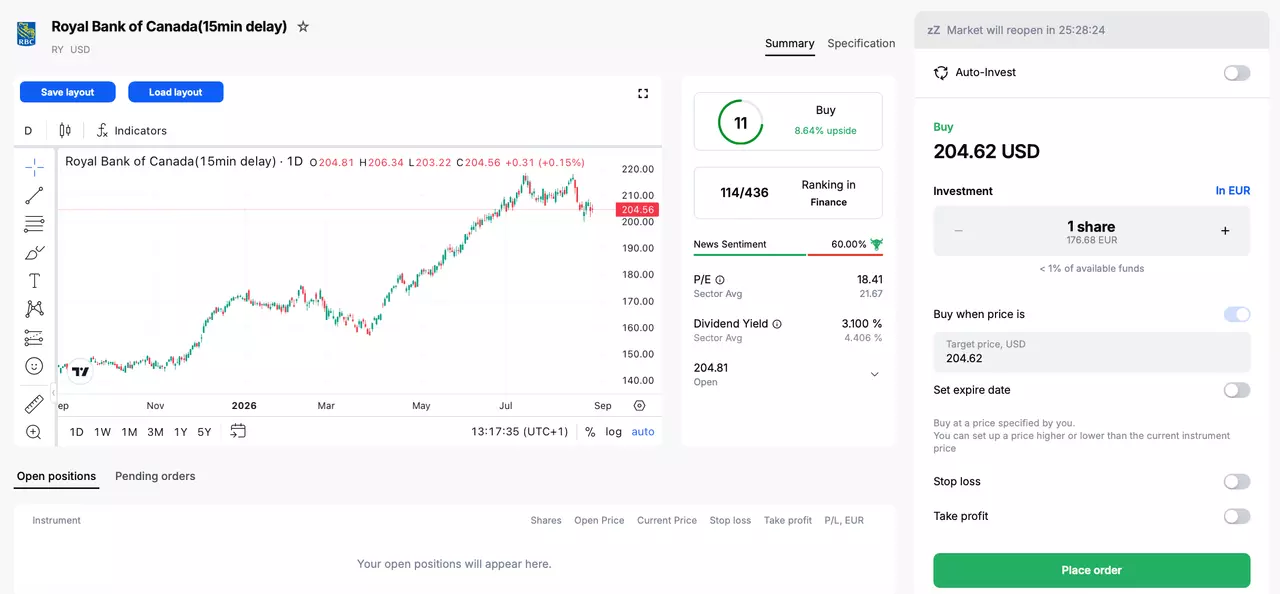
- Open an account with Admirals and complete the onboarding process to access the dashboard.
- Click on Trade or Invest on one of your live or demo accounts to open the Admirals Platform.
- Search for your stock in the search window at the top.
- Input your entry, stop-loss and take profit levels in the trading ticket.

Do You See the Royal Bank of Canada Stock Price Moving Differently?
If you believe there is a higher chance that the share price of Royal Bank of Canada will move lower, then you can also trade short using CFDs (Contracts for Difference). However, these have higher associated risks and are not suitable for all investors. Learn more about CFDs in this How to Trade CFDs article.
The given data provides additional information regarding all analysis, estimates, prognosis, forecasts, market reviews, weekly outlooks or other similar assessments or information (hereinafter “Analysis”) published on the websites of Admirals investment firms operating under the Admirals trademark (hereinafter “Admirals”) Before making any investment decisions please pay close attention to the following: