How to Trade Home Depot After Fiscal Q2 Earnings


The Home Depot is the world’s largest home improvement retailer, operating more than 2,300 stores across North America.
Last week, it reported fiscal second-quarter results which beat expectations on the top and bottom lines, as the company reaffirmed its full fiscal year guidance. However, a frozen US housing market remains an issue, weighing on demand for more expensive renovation projects.
Keep reading to find out more and learn what analysts are predicting for the stock.
The information in this article is provided for educational purposes only and does not constitute financial advice. Consult a financial advisor before making investment decisions.
- The Invest.MT5 Account allows you to buy real stocks and shares from some of the largest stock exchanges in the world.
- Risk Warning: Past performance is not a reliable indicator of future results or future performance. All trading is high risk, and you can lose more than you risk on a trade. Never invest more than you can afford to lose as some trades will lose and some trades will win. Start small to understand your own risk tolerance levels or practice on a demo account first to build your knowledge before investing.
- Trading is not suitable for everyone. Trading is highly speculative and carries a significant risk of loss. While it offers potential opportunities, it also involves high volatility, and leveraged trading can amplify both gains and losses. Retail investors should fully understand these risks before trading.

Home Depot Fiscal Q2 Performance Summary
Key Takeaways:
- Net sales rose 5.7% to $47.86 billion, topping the analyst consensus of $47.27 billion.
- Operating income rose 4.3% to $6.84 billion, whilst net earnings grew 4.7% to $4.77 billion.
- Adjusted diluted earnings per share increased 5.1% to $4.92, exceeding expectations of $4.73.
- Comparable (same-store) sales rose 1.7% versus an expected 0.9%. This was the highest comparable sales number in almost four years.
- Comparable sales growth was driven by fewer customers spending more on each visit. Comparable customer transactions fell 1.0% during the quarter, whilst the comparable average ticket (dollar amount per transaction) rose 2.8%.
- In the earnings call, CFO McPhail said that Home Depot had received $730 million in tariff refunds during the quarter, which represented the “vast majority” of what the company expects to receive. He noted that $685 million of that reduced the cost of goods sold, whilst the remaining $45 million remains in inventory.
- Home Depot reaffirmed its full fiscal year outlook, guiding for:
- Total sales growth of approximately 2.5% to 4.5%.
- Comparable sales growth of approximately flat to 2.0%.
- Adjusted diluted earnings per share to grow approximately flat to 4.0% from $14.69 in fiscal 2025.
Source: Home Depot Fiscal Q2 2026 Earnings & CNBC
Home Depot 12-Month Analyst Stock Price Forecast
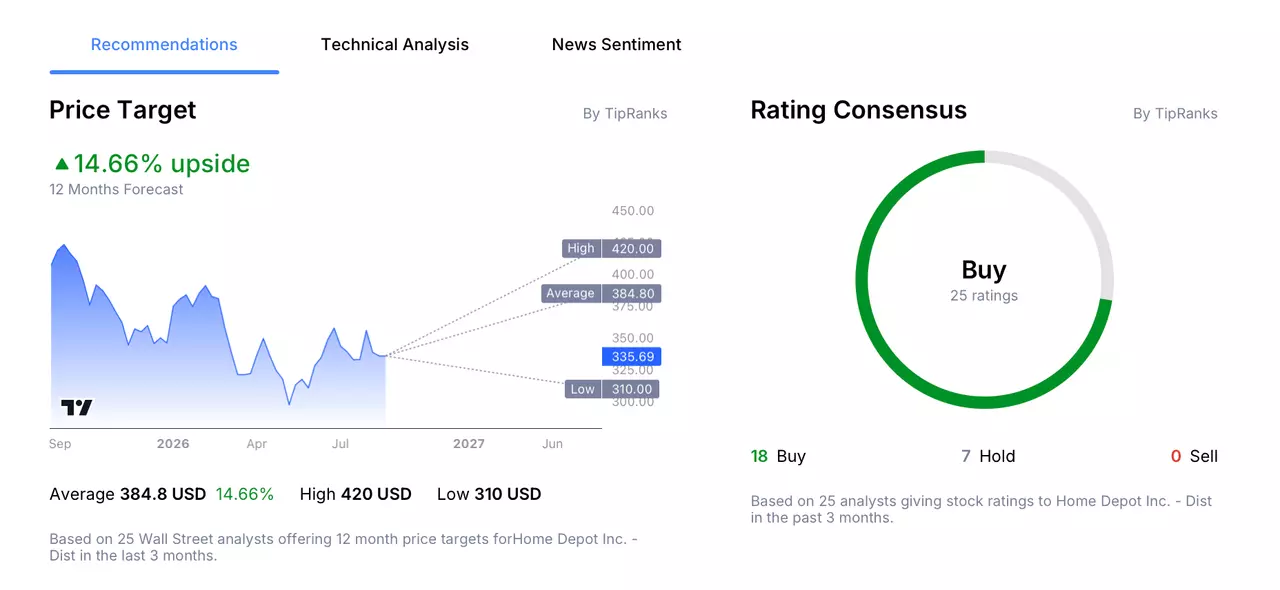
According to 25 Wall Street analysts, polled by TipRanks, offering a 12-month stock price forecast for Home Depot over the past 3 months:
- Buy Ratings: 18
- Hold Ratings: 7
- Sell Ratings: 0
- Average Price Target: $384.80
- High Price Target: $420.00
- Low Price Target: $310.00
Trading Strategy Example: Home Depot
The following trading examples are for educational purposes only and do not constitute investment advice. Investors should conduct independent research before making trading decisions. An example trading idea for Home Depot could be as follows:
Although Home Depot beat expectations on the top and bottom lines, headwinds remain.
Housing turnover has been at historically low levels in the US in recent years, primarily driven by high mortgage rates locking existing homeowners into their current properties. Fewer houses changing hands means less spending on the type of renovation projects which can come with buying a new home.
CFO McPhail and Executive Vice President Billy Bastek both raised this on the earnings call, noting that, whilst customers continued to engage in smaller repair and maintenance work, demand for larger discretionary projects was under pressure.
If mortgage rates remain high and housing turnover stays low, it could weigh on sales. Indeed, Home Depot’s own reaffirmed guidance builds in the possibility that comparable sales and adjusted diluted EPS could remain flat this fiscal year.
How to Buy Home Depot Stock in 4 Steps
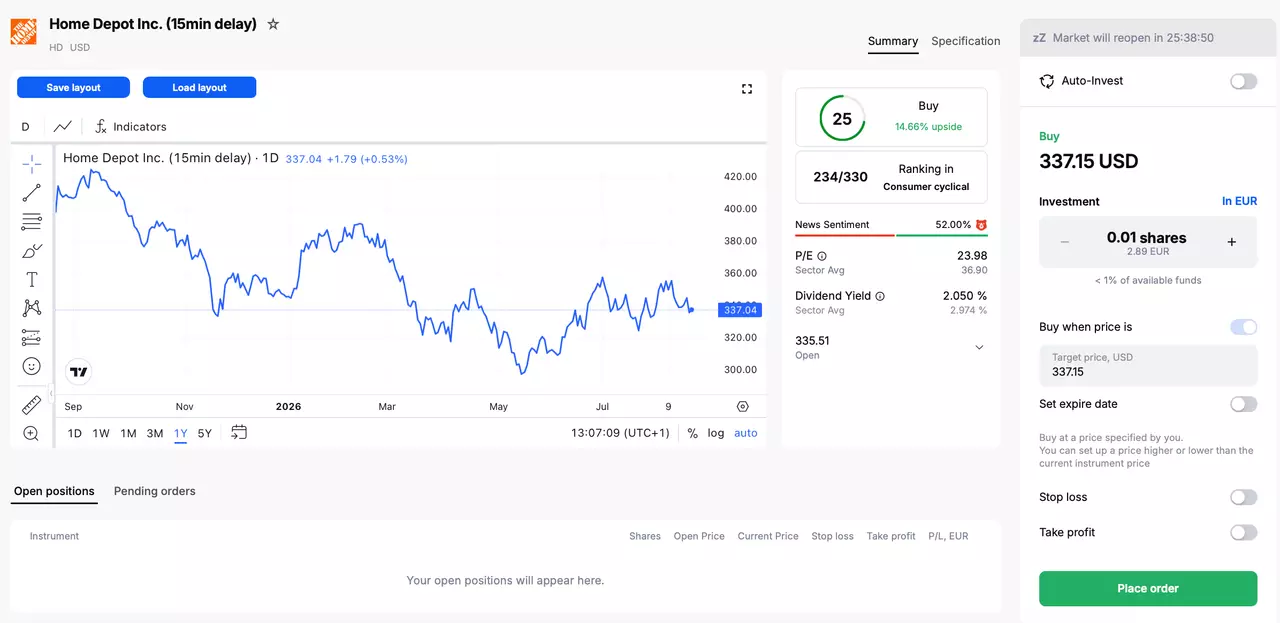
- Open an account with Admirals and complete the onboarding process to access the dashboard.
- Click on Trade or Invest on one of your live or demo accounts to open the Admirals Platform.
- Search for your stock in the search window at the top.
- Input your entry, stop-loss and take profit levels in the trading ticket.

Do You See the Home Depot Stock Price Moving Differently?
If you believe there is a higher chance that the share price of Home Depot will move lower, then you can also trade short using CFDs (Contracts for Difference). However, these have higher associated risks and are not suitable for all investors. Learn more about CFDs in this How to Trade CFDs article.
The given data provides additional information regarding all analysis, estimates, prognosis, forecasts, market reviews, weekly outlooks or other similar assessments or information (hereinafter “Analysis”) published on the websites of Admirals investment firms operating under the Admirals trademark (hereinafter “Admirals”) Before making any investment decisions please pay close attention to the following: