How to Trade Salesforce After Fiscal Q1 2027 Earnings

Founded in 1999 and headquartered in San Francisco, California, Salesforce, Inc. (NYSE: CRM) is one of the world's largest enterprise software companies, known for its cloud-based customer relationship management (CRM) platform. The software helps businesses manage sales pipelines, customer service, marketing campaigns, and data analytics. The company serves organisations across virtually every industry, from financial services and healthcare to retail and the public sector.
The company recently reported its results for the first quarter of fiscal year 2027. Here is a closer look at its performance and what analysts are forecasting for the stock.
The information in this article is provided for educational purposes only and does not constitute financial advice. Consult a financial advisor before making investment decisions.
- The Invest.MT5 Account allows you to buy real stocks and shares from some of the largest stock exchanges in the world.
- Risk Warning: Past performance is not a reliable indicator of future results or future performance. All trading is high risk, and you can lose more than you risk on a trade. Never invest more than you can afford to lose as some trades will lose and some trades will win. Start small to understand your own risk tolerance levels or practice on a demo account first to build your knowledge before investing.
- Trading is not suitable for everyone. Trading is highly speculative and carries a significant risk of loss. While it offers potential opportunities, it also involves high volatility, and leveraged trading can amplify both gains and losses. Retail investors should fully understand these risks before trading.

Salesforce’s Fiscal Q1 2027 Earnings Performance Summary
Key Takeaways
- Total revenue reached $11.13 billion, up 13% year-on-year, including a $444 million contribution from Informatica, which Salesforce acquired in fiscal 2026. Subscription and support revenue rose 14% YoY to $10.6 billion.
- Profitability improved on both GAAP and non-GAAP measures. GAAP operating income rose 21% YoY to $2.35 billion, with a GAAP operating margin of 21.1%. Non-GAAP operating margin, which excludes stock-based compensation, amortisation of intangibles, and restructuring charges, reached 34.8%, up from 32.3% a year earlier.
- Agentforce, Salesforce's AI-agent platform, crossed $1.2 billion in annual recurring revenue (ARR), up 205% YoY. Combined Agentforce and Data 360 ARR reached nearly $3.4 billion, up over 200% YoY. This is reflected in the company's two revenue segments:
- Agentforce Apps, which includes Salesforce's sales, service, marketing, and commerce applications, as well as Slack, generated $6.91 billion, up 7% YoY in constant currency.
- Data 360, Headless Platform, & Other, which encompasses Salesforce's data management, integration, and platform tools, including the Informatica business, generated $3.68 billion, up 23% YoY in constant currency.
- Salesforce executed a $25 billion accelerated share repurchase (ASR) during the quarter, with 103 million shares delivered upfront, representing approximately 80% of the total shares expected to be repurchased, with final settlement expected in Q3 fiscal 2027.
- Management guided for Q2 fiscal 2027 revenue of $11.27 billion to $11.35 billion, up 10%-11% YoY, and raised the midpoint of full-year revenue guidance to $45.9 billion-$46.2 billion, up 11% YoY. On the earnings call, management noted that the full-year revenue guidance reflects continued momentum in Agentforce, Data 360, and Slack, partially offset by ongoing weakness in marketing and commerce, and increased softness in Tableau bookings and renewals.
- "This was an outstanding quarter for Salesforce – record revenue, record deals, and cash flow," said Marc Benioff, Chair and CEO.
Source: Salesforce Fiscal Q1 2027 Press Release and Earnings Transcript
Salesforce's 12-Month Analyst Stock Price Forecast
According to 37 Wall Street analysts, polled by TipRanks, offering a 12-month stock price forecast for Salesforce over the past 3 months:
- Buy Ratings: 27
- Hold Ratings: 8
- Sell Ratings: 2
- Average Price Target: $245.61
- High Price Target: $400.00
- Low Price Target: $160.00
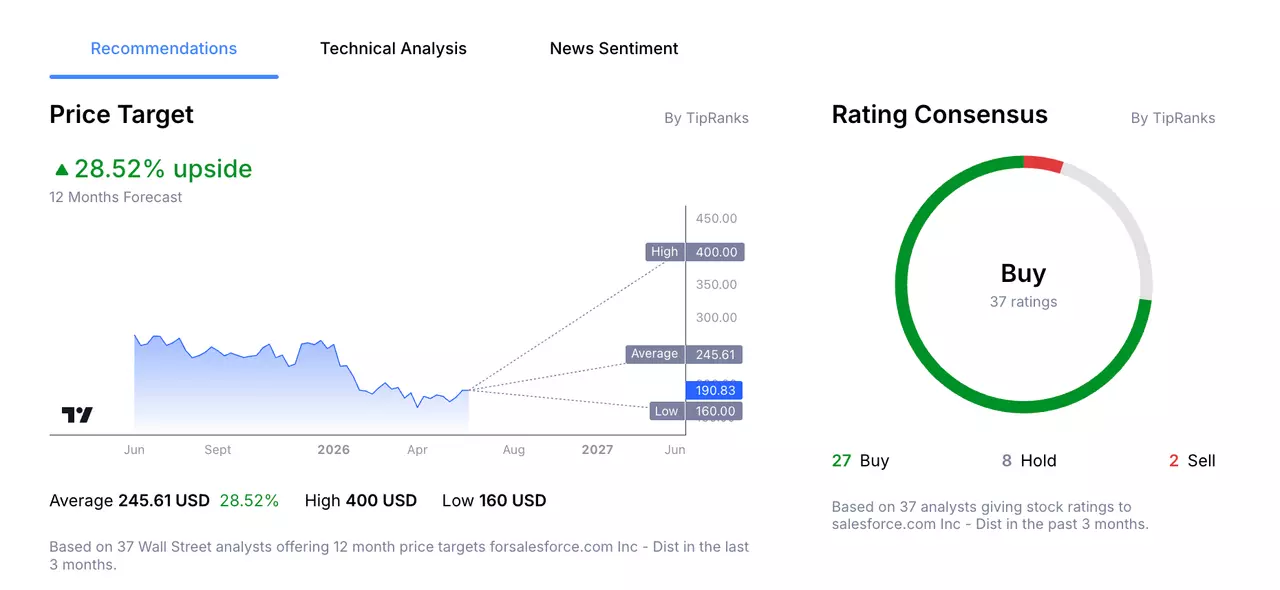
Source: Admirals Stock List Macroscope, Salesforce. Date captured: 1 June 2026. Past performance is not a reliable indicator of future results.
Trading Strategy Example: Salesforce, Inc.
The following trading examples are for educational purposes only and do not constitute investment advice. Investors should conduct independent research before making trading decisions. An example trading idea for the Salesforce share price could be as follows:
Remember, markets are volatile, and Salesforce's share price can fluctuate and may even trend lower. Despite beating on both revenue and earnings, the stock fell approximately 3% in after-hours trading following the results, as Q2 revenue guidance came in below some analyst expectations.
As of the earnings date, Salesforce shares were down around 33% year to date, while the S&P 500 had gained approximately 10% over the same period.
Salesforce's balance sheet has changed materially this quarter. To fund the $25 billion accelerated share repurchase, the company issued $25 billion in new debt, raising its noncurrent debt from $10.4 billion to $39.3 billion in a single quarter. The company also acknowledged ongoing softness in marketing, commerce, and Tableau bookings and renewals on its earnings call.
Furthermore, the competitive environment for enterprise software and AI tooling continues to intensify.
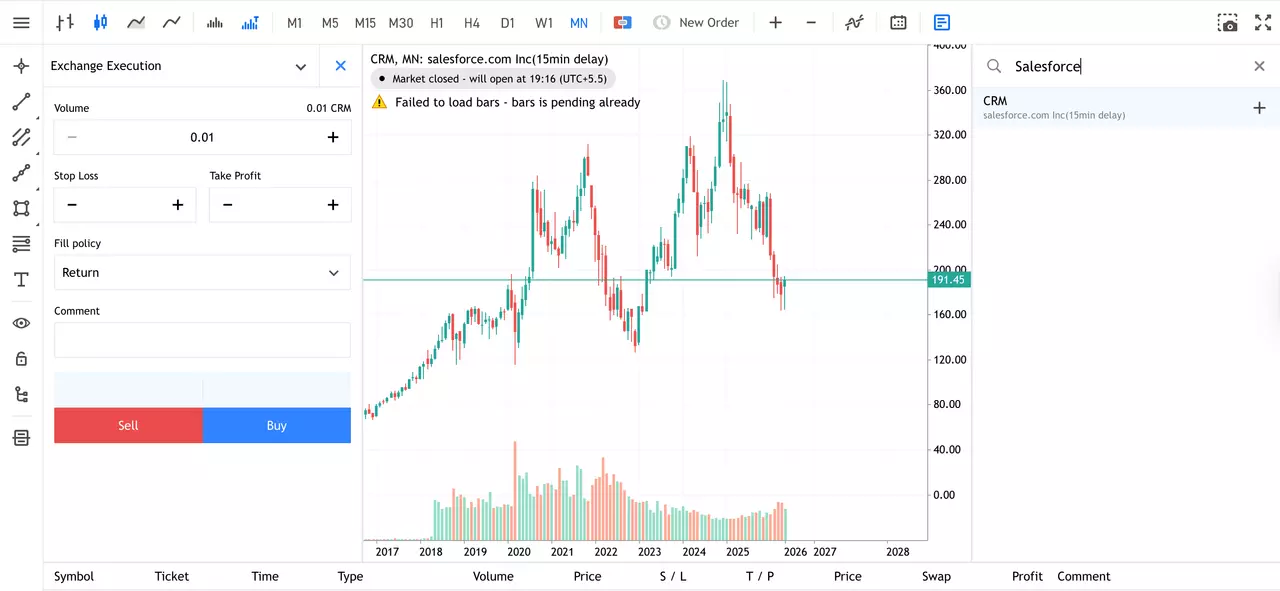
How to Buy Salesforce Stock in 4 Steps
- Open an account with Admirals and complete the onboarding process to access the dashboard.
- Click on Trade or Invest on one of your live or demo accounts to open the web platform.
- Search for your stock in the search window at the top.
- Input your entry, stop-loss and take profit levels in the trading ticket.
Do You See the Salesforce Stock Price Moving Differently?
If you believe there is a higher chance that the share price of Salesforce will move lower, then you can also trade short using CFDs (Contracts for Difference). However, these have higher associated risks and are not suitable for all investors. Learn more about CFDs in this How to Trade CFDs article.
The given data provides additional information regarding all analysis, estimates, prognosis, forecasts, market reviews, weekly outlooks or other similar assessments or information (hereinafter “Analysis”) published on the websites of Admirals investment firms operating under the Admirals trademark (hereinafter “Admirals”) Before making any investment decisions please pay close attention to the following:
- This is a marketing communication. The content is published for informative purposes only and is in no way to be construed as investment advice or recommendation. It has not been prepared in accordance with legal requirements designed to promote the independence of investment research, and that it is not subject to any prohibition on dealing ahead of the dissemination of investment research.
- Any investment decision is made by each client alone whereas Admirals shall not be responsible for any loss or damage arising from any such decision, whether or not based on the content.
- With view to protecting the interests of our clients and the objectivity of the Analysis, Admirals has established relevant internal procedures for prevention and management of conflicts of interest.
- The Analysis is prepared by an analyst (hereinafter “Author”). The Author Clarice Mendonsa is a contractor for Admirals. This content is a marketing communication and does not constitute independent financial research.
- Whilst every reasonable effort is taken to ensure that all sources of the content are reliable and that all information is presented, as much as possible, in an understandable, timely, precise and complete manner, Admirals does not guarantee the accuracy or completeness of any information contained within the Analysis.
- Any kind of past or modelled performance of financial instruments indicated within the content should not be construed as an express or implied promise, guarantee or implication by Admirals for any future performance. The value of the financial instrument may both increase and decrease and the preservation of the asset value is not guaranteed.
- Leveraged products (including contracts for difference) are speculative in nature and may result in losses or profit. Before you start trading, please ensure that you fully understand the risks involved.