How to Trade Freeport-McMoRan After Q2 Earnings Beat


Freeport-McMoRan (FCX) is one of the world’s largest publicly traded copper producers, mining copper, gold and molybdenum across the US, South America and Indonesia. Amongst its operations is the Grasberg mineral complex, one of the largest copper and gold deposits on earth.
Last week, the company reported its second-quarter results. Revenue fell year-on-year, as Freeport's Grasberg mine in Indonesia continues its recovery from a fatal accident in September. However, FCX still beat analyst expectations on the top and bottom lines, as significantly higher commodity prices helped give the miner an unexpected boost.
Keep reading to find out more and learn what analysts are predicting for the stock.
The information in this article is provided for educational purposes only and does not constitute financial advice. Consult a financial advisor before making investment decisions.
- The Invest.MT5 Account allows you to buy real stocks and shares from some of the largest stock exchanges in the world.
- Risk Warning: Past performance is not a reliable indicator of future results or future performance. All trading is high risk, and you can lose more than you risk on a trade. Never invest more than you can afford to lose as some trades will lose and some trades will win. Start small to understand your own risk tolerance levels or practice on a demo account first to build your knowledge before investing.
- Trading is not suitable for everyone. Trading is highly speculative and carries a significant risk of loss. While it offers potential opportunities, it also involves high volatility, and leveraged trading can amplify both gains and losses. Retail investors should fully understand these risks before trading.

Freeport-McMoRan Q2 Earnings Performance Summary
Key Takeaways
- Revenue fell 7% to $7.03 billion, as Freeport continued its phased recovery of the Grasberg mine following a fatal accident last September. However, analysts had been anticipating a significantly steeper fall, to $6.71 billion.
- With Grasberg operating at lower capacity, Freeport produced and sold significantly less copper and gold than a year earlier. In terms of volume, copper sales fell 30% to 710 million pounds, whilst gold sales fell 76% to 123,000 ounces.
- However, higher realised prices for both metals helped Freeport beat expectations on the top line. During the quarter, the average realised price per pound of copper was $6.17, compared to $4.54 a year before, whilst the average realised price per ounce of gold was $4,520, compared to $3,291 a year before.
- Consolidated operating income fell 18% to $2.0 billion, as Freeport’s operations in Indonesia were hit hard by Grasberg’s ongoing phased recovery.
- Operating income from Indonesian operations fell 73% to $499 million. Meanwhile, US operating income soared 127% to $834 million, and South America's jumped by 125% to $840 million.
- Adjusted net income attributable to common stockholders rose 37% to $1.1 billion, or $0.74 per share, beating the consensus of $0.59. On a GAAP basis, net income attributable to common stockholders rose 27% to $984 million, $0.68 per share.
- The rise partly reflects the fact that Freeport's noncontrolling interests absorbed a significant share of the group's profit decline in Indonesia, cushioning the overall impact on Freeport's shareholders.
- FCX expects Grasberg's overall production rate to reach approximately 65% of capacity in the second half of 2026, 80% by mid-2027, and to approach full capacity by the end of 2027.
- Freeport raised its estimated cost for the Bagdad copper mine expansion in Arizona to approximately 30% above the $3.5 billion projected in 2023, citing cost escalation, revisions in scope and additional engineering.
- It expects full-year 2026 capital expenditures of approximately $4.3 billion, including $3.0 billion for major mining projects. It further expects operating cash flows of approximately $8.3 billion, assuming prices of $6.00 per pound for copper, $4,000 per ounce for gold and $30.00 per pound of molybdenum.
Source: Freeport-McMoran Q2 Earnings, Reuters, Market Beat
FCX 12-Month Analyst Stock Price Forecast
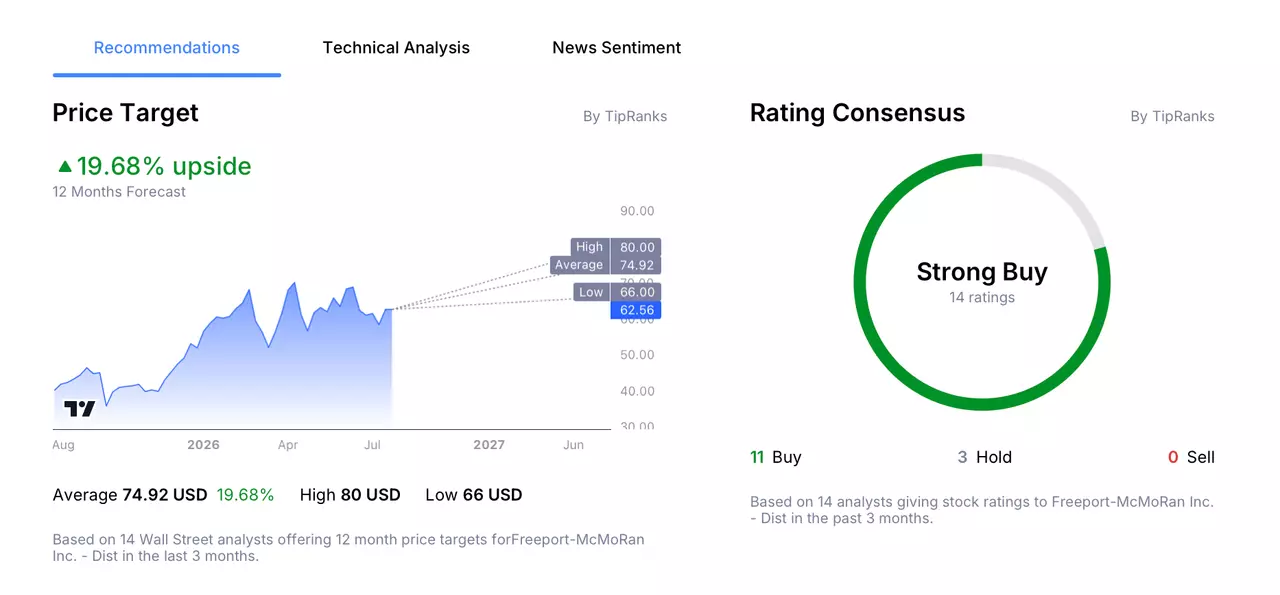
According to 14 Wall Street analysts, polled by TipRanks, offering a 12-month stock price forecast for Freeport-McMoRan over the past 3 months:
- Buy Ratings: 11
- Hold Ratings: 3
- Sell Ratings: 0
- Average Price Target: $74.92
- High Price Target: $80.00
- Low Price Target: $66.00
Trading Strategy Example: Freeport-McMoRan
The following trading examples are for educational purposes only and do not constitute investment advice. Investors should conduct independent research before making trading decisions. An example trading idea for Freeport-McMoRan could be as follows:
Freeport-McMoRan beat expectations in the second quarter; however, it’s important to note that this outperformance was largely driven by higher commodity prices, not operational strength. FCX actually sold less copper and gold than a year earlier, but significantly higher realised prices helped offset the considerable decline in volume.
Naturally, that cuts both ways. Whilst rising prices can provide a tailwind to miners such as Freeport, a reversal in copper, gold or molybdenum prices could have the opposite effect.
Focusing on Freeport specifically, a degree of uncertainty remains around the pace of its recovery in Indonesia. Following the fatal mudslide at Grasberg last September, Freeport does not expect the mine to return to full capacity until the end of 2027. Any further delays to this timetable could weigh on both results and sentiment in the meantime.
How to Buy FCX Stock in 4 Steps
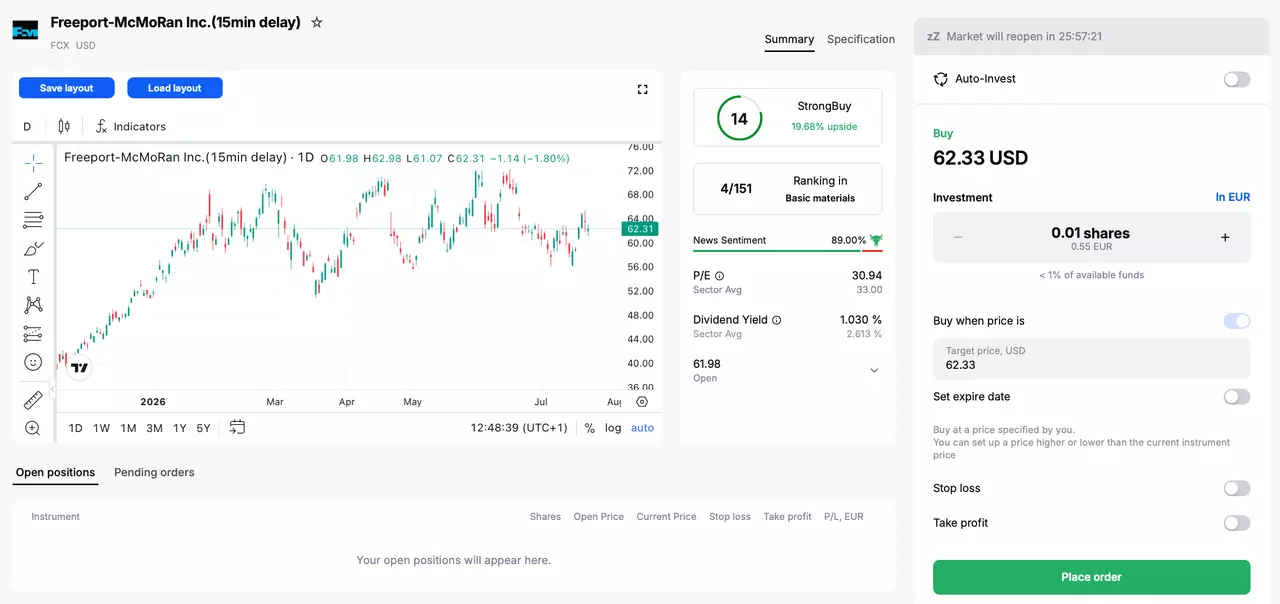
- Open an account with Admirals and complete the onboarding process to access the dashboard.
- Click on Trade or Invest on one of your live or demo accounts to open the Admirals Platform.
- Search for your stock in the search window at the top.
- Input your entry, stop-loss and take profit levels in the trading ticket.

Do You See the FCX Stock Price Moving Differently?
If you believe there is a higher chance that the share price of Freeport-McMoRan will move lower, then you can also trade short using CFDs (Contracts for Difference). However, these have higher associated risks and are not suitable for all investors. Learn more about CFDs in this How to Trade CFDs article.
The given data provides additional information regarding all analysis, estimates, prognosis, forecasts, market reviews, weekly outlooks or other similar assessments or information (hereinafter “Analysis”) published on the websites of Admirals investment firms operating under the Admirals trademark (hereinafter “Admirals”) Before making any investment decisions please pay close attention to the following: