How to Trade ASML After Q2 Earnings Beat


ASML Holding, Europe’s largest company by market capitalisation, holds a global monopoly on extreme ultraviolet (EUV) lithography machines, which are required to produce the world's most advanced semiconductors.
Last week, the company published its second-quarter 2026 results, comfortably beating expectations on the top and bottom lines. Keep reading to find out more and learn what analysts are predicting for the stock.
The information in this article is provided for educational purposes only and does not constitute financial advice. Consult a financial advisor before making investment decisions.
- The Invest.MT5 Account allows you to buy real stocks and shares from some of the largest stock exchanges in the world.
- Risk Warning: Past performance is not a reliable indicator of future results or future performance. All trading is high risk, and you can lose more than you risk on a trade. Never invest more than you can afford to lose as some trades will lose and some trades will win. Start small to understand your own risk tolerance levels or practice on a demo account first to build your knowledge before investing.
- Trading is not suitable for everyone. Trading is highly speculative and carries a significant risk of loss. While it offers potential opportunities, it also involves high volatility, and leveraged trading can amplify both gains and losses. Retail investors should fully understand these risks before trading.

ASML Q2 Earnings Performance Summary
Key Takeaways
- Net sales rose 21% year-on-year to €9.3 billion, beating both ASML's own guidance (€8.4bn–€9.0bn) and the analyst consensus of €8.8bn.
- Sales growth was driven primarily by Installed Base Management (servicing and upgrading existing machines), which reached €2.8 billion for the quarter.
- Gross margin, which measures gross profit as a percentage of net sales, rose to 54.0%, above ASML’s previous guidance. This increase was helped by the “contribution of very high-margin components within our Installed Base Management business”.
- Net income rose 27% to €2.9 billion, up from €2.3 billion a year earlier, also beating the analyst consensus. Basic earnings per share rose 29% to €7.59.
- ASML raised its full-year 2026 guidance for the second time this year: net sales are now expected at €43bn – €45bn, up from the €36bn – €40bn range set in April, with gross margin guidance lifted to 54% – 56%, up from 51% – 53%.
- Third-quarter guidance points to €11.0bn–€12.0bn in sales.
- Management described first-half order intake as extremely strong. Due to the positive momentum, in 2027, it plans to add 30% to low-NA EUV capacity and another 30% to deep ultraviolet (DUV) immersion capacity. ASML are investigating to increase capacity by a similar margin again in 2028.
- In the earnings call, ASML stated that it still expects China to account for around 20% of net sales for the year. However, China’s contribution to sales fell to 14% in Q2, down from 19% in Q1.
ASML’s 12-Month Analyst Stock Price Forecast
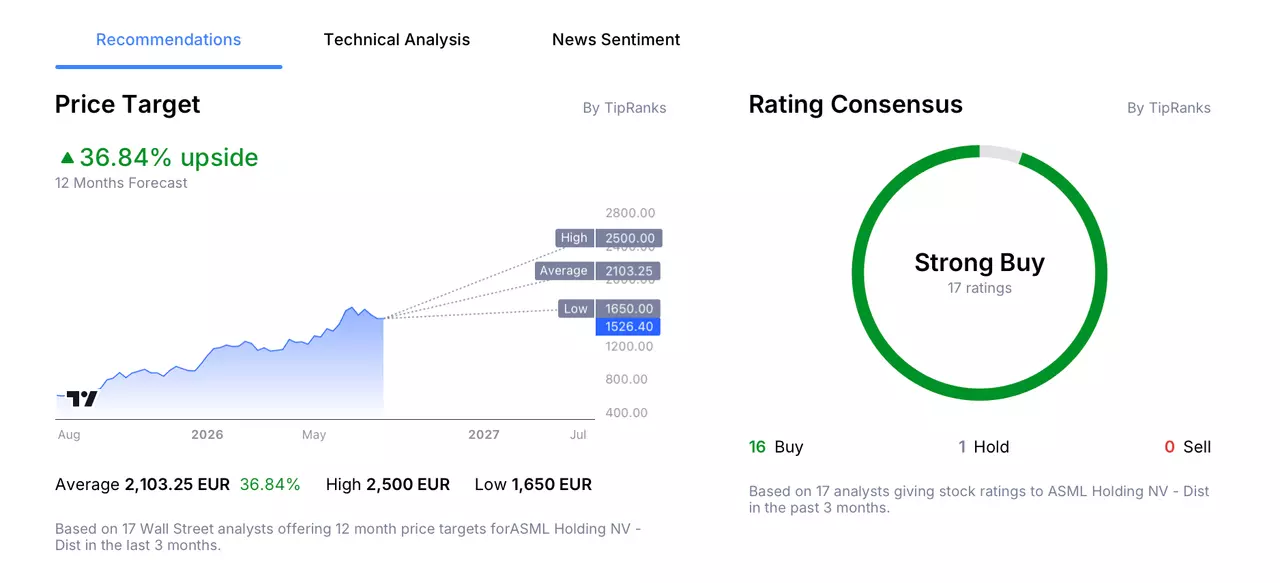
According to 17 Wall Street analysts, polled by TipRanks, offering a 12-month stock price forecast for ASML over the past 3 months:
- Buy Ratings: 16
- Hold Ratings: 1
- Sell Ratings: 0
- Average Price Target: €2,103.25
- High Price Target: €2,500.00
- Low Price Target: €1,650.00
Trading Strategy Example: ASML Holding
The following trading examples are for educational purposes only and do not constitute investment advice. Investors should conduct independent research before making trading decisions. An example trading idea for ASML could be as follows:
Despite strong demand for AI infrastructure, semiconductor stocks have come under pressure recently as investors seemingly question whether this high level of capital expenditure is sustainable.
ASML in particular also faces the possibility of tightening export restrictions on its products. Historically, export controls have focused primarily on the most advanced semiconductor technology. Consequently, ASML has never exported its most advanced extreme ultraviolet (EUV) lithography machines to China.
ASML also makes less advanced deep ultraviolet (DUV) lithography machines, which have remained exportable to China on a case-by-case basis. Indeed, as we saw earlier, China makes up a considerable percentage of ASML’s net sales.
However, a group of bipartisan lawmakers in the US have recently proposed a bill (the MATCH act) in Congress which, if passed, would essentially block ASML from exporting or servicing its DUV machines to China. If these restrictions come into effect, it could have a significant impact on ASML’s already falling China sales.
How to Buy ASML Stock in 4 Steps
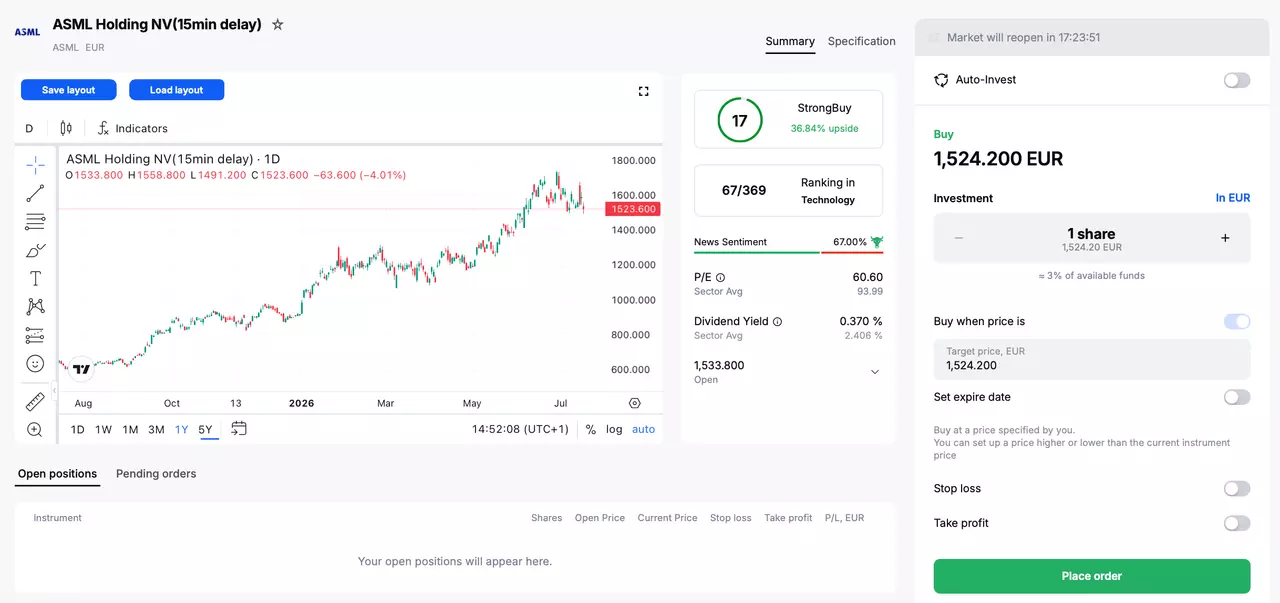
- Open an account with Admirals and complete the onboarding process to access the dashboard.
- Click on Trade or Invest on one of your live or demo accounts to open the Admirals Platform.
- Search for your stock in the search window at the top.
- Input your entry, stop-loss and take profit levels in the trading ticket.

Do You See the ASML Stock Price Moving Differently?
If you believe there is a higher chance that the share price of ASML will move lower, then you can also trade short using CFDs (Contracts for Difference). However, these have higher associated risks and are not suitable for all investors. Learn more about CFDs in this How to Trade CFDs article.
The given data provides additional information regarding all analysis, estimates, prognosis, forecasts, market reviews, weekly outlooks or other similar assessments or information (hereinafter “Analysis”) published on the websites of Admirals investment firms operating under the Admirals trademark (hereinafter “Admirals”) Before making any investment decisions please pay close attention to the following: