How to Trade Visa After Fiscal Q1 2026 Earnings Performance

Visa Inc. (NYSE: V) is the world’s leading digital payments company, tracing its roots back to 1958 when Bank of America launched BankAmericard, the first consumer credit card to offer revolving credit, which eventually evolved into Visa.
It’s one of those companies that many people interact with every day, often without even noticing. Whether you’ve swiped, tapped, or clicked to pay for something, there’s a good chance Visa was working behind the scenes to make it happen. The company operates VisaNet, a global payments network connecting banks, merchants, and consumers in over 200 countries and territories.
Visa recently reported its fiscal first-quarter 2026 earnings. Here’s a closer look at the company’s performance and what analysts are forecasting for the stock.
This material is for informational purposes only and not financial advice. Consult a financial advisor before making investment decisions.
- The Invest.MT5 account allows you to buy real stocks and shares from some of the largest stock exchanges in the world.
- Risk Warning: Past performance is not a reliable indicator of future results or future performance. All trading is high risk, and you can lose more than you risk on a trade. Never invest more than you can afford to lose as some trades will lose and some trades will win. Start small to understand your own risk tolerance levels or practice on a demo account first to build your knowledge before investing.
- Trading is not suitable for everyone. Trading is highly speculative and carries a significant risk of loss. While it offers potential opportunities, it also involves high volatility, and leveraged trading can amplify both gains and losses. Retail investors should fully understand these risks before trading.

Visa’s Fiscal Q1 2026 Earnings Performance Summary
Key Takeaways
- Visa reported net revenue of $10.90 billion, up 15% year on year, with net income growing 12% YoY, driven by resilient consumer spending and a strong holiday season. The growth was also supported by continued strength in value-added services and commercial solutions.
- Total payment volume rose 8% YoY, reflecting robust global consumer and business spending across both retail and commercial segments.
- Cross-border volume (excluding transactions within Europe) grew 11% on a constant-dollar basis, contributing to international transaction revenue growth of 6% YoY.
- Segment-wise revenue growth:
- Service revenue: $4.8 billion, up 13% YoY
- Data processing revenue: $5.5 billion, up 17% YoY
- International transaction revenue: $3.7 billion, up 6% YoY
- Other revenue: $1.2 billion, up 33% YoY
- Client incentives: $4.3 billion, up 12% YoY
- The board declared a quarterly dividend of $0.67 per share of class A common stock.
Source: Visa’s Quarterly Results
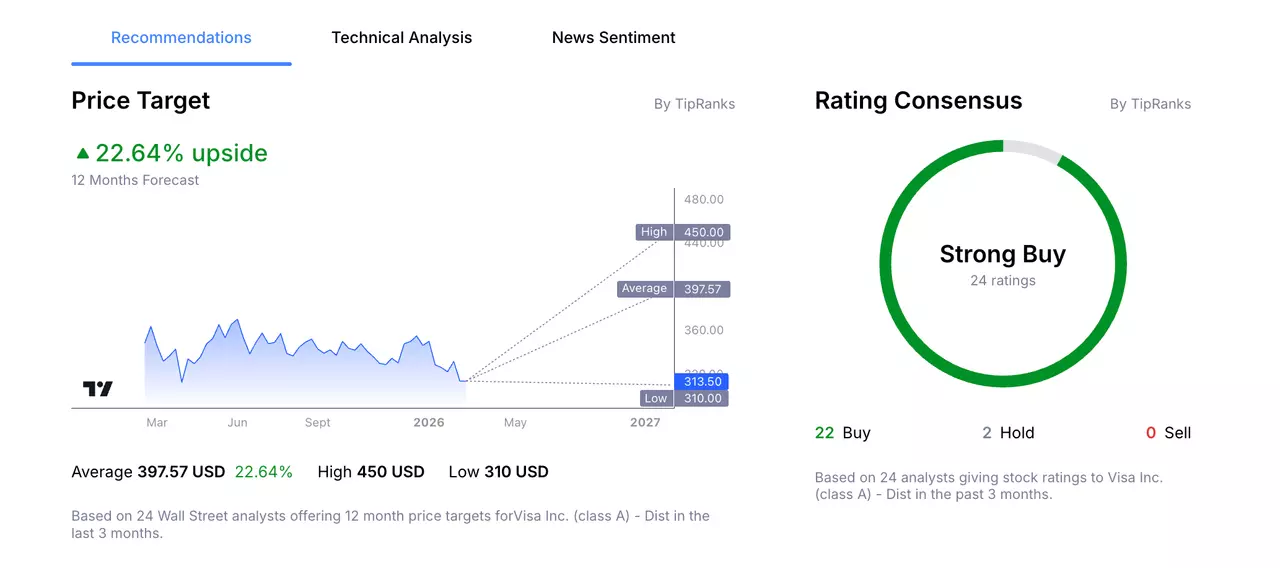
Visa’s 12-Month Analyst Stock Price Forecast
According to 24 Wall Street analysts, polled by TipRanks, offering a 12-month stock price forecast for Visa over the past 3 months:
- Buy Ratings: 22
- Hold Ratings: 2
- Sell Ratings: 0
- Average Price Target: $397.57
- High Price Target: $450.00
- Low Price Target: $310.00
Trading Strategy Example: Visa Inc.
The following trading examples are for educational purposes only and do not constitute investment advice. Investors should conduct independent research before making trading decisions. An example trading idea for the Visa share price could be as follows:
Remember, markets are volatile, and Visa’s share price can fluctuate and may even trend lower. Despite strong earnings, Visa’s performance remains closely tied to consumer spending, cross-border transactions, and global economic activity. A slowdown in consumer or business spending, reduced travel activity, or rising competition in digital payments could weigh on growth expectations and impact the stock’s performance.
Furthermore, the stock is currently down around 17% from its record high in June 2025.
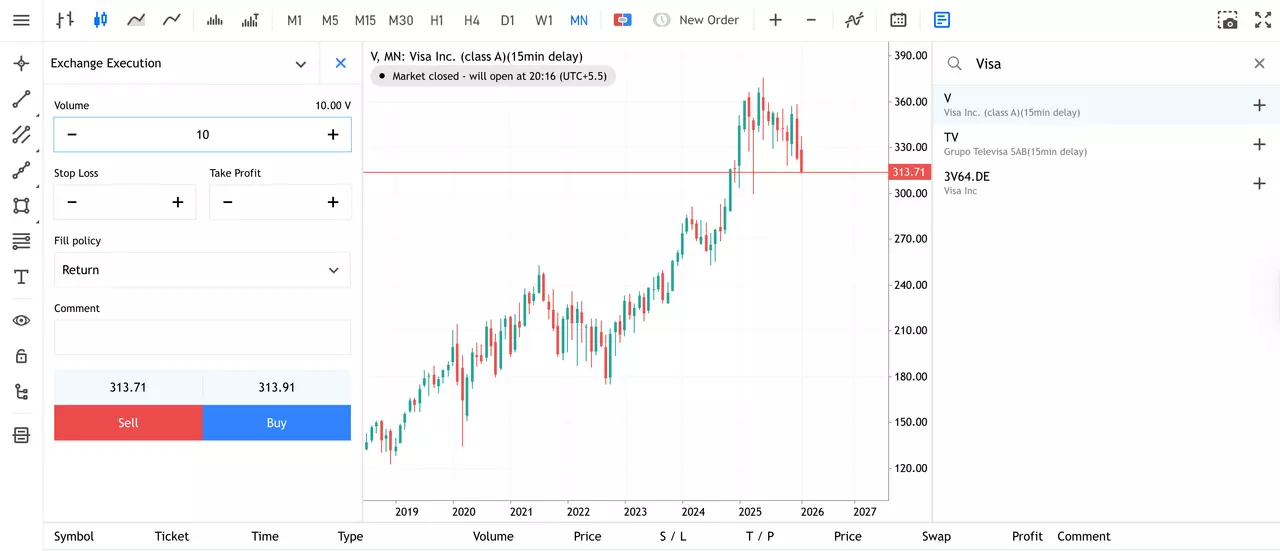
How to Buy Visa Stock in 4 Steps
- Open an account with Admirals and complete the onboarding process to access the dashboard.
- Click on Trade or Invest on one of your live or demo accounts to open the web platform.
- Search for your stock in the search window at the top.
- Input your entry, stop-loss and take profit levels in the trading ticket.
Do You See the Visa Stock Price Moving Differently?
If you believe there is a higher chance that the share price of Visa will move lower, then you can also trade short using CFDs (Contracts for Difference). However, these have higher associated risks and are not suitable for all investors. Learn more about CFDs in this How to Trade CFDs article.
The given data provides additional information regarding all analysis, estimates, prognosis, forecasts, market reviews, weekly outlooks or other similar assessments or information (hereinafter “Analysis”) published on the websites of Admirals investment firms operating under the Admirals trademark (hereinafter “Admirals”) Before making any investment decisions please pay close attention to the following:
- This is a marketing communication. The content is published for informative purposes only and is in no way to be construed as investment advice or recommendation. It has not been prepared in accordance with legal requirements designed to promote the independence of investment research, and that it is not subject to any prohibition on dealing ahead of the dissemination of investment research.
- Any investment decision is made by each client alone whereas Admirals shall not be responsible for any loss or damage arising from any such decision, whether or not based on the content.
- With view to protecting the interests of our clients and the objectivity of the Analysis, Admirals has established relevant internal procedures for prevention and management of conflicts of interest.
- The Analysis is prepared by an analyst (hereinafter “Author”). The Author Clarice Mendonsa is a contractor for Admirals. This content is a marketing communication and does not constitute independent financial research.
- Whilst every reasonable effort is taken to ensure that all sources of the content are reliable and that all information is presented, as much as possible, in an understandable, timely, precise and complete manner, Admirals does not guarantee the accuracy or completeness of any information contained within the Analysis.
- Any kind of past or modelled performance of financial instruments indicated within the content should not be construed as an express or implied promise, guarantee or implication by Admirals for any future performance. The value of the financial instrument may both increase and decrease and the preservation of the asset value is not guaranteed.
- Leveraged products (including contracts for difference) are speculative in nature and may result in losses or profit. Before you start trading, please ensure that you fully understand the risks involved.