How to Trade Morgan Stanley After Q1 2026 Earnings

Founded in 1935 and headquartered in New York City, Morgan Stanley (NYSE: MS) is a leading global financial services firm with offices in 42 countries.
The firm operates across three core businesses: Institutional Securities, which covers investment banking and trading; Wealth Management, which serves individual clients and small to mid-sized businesses; and Investment Management, which oversees assets on behalf of a broad range of investors. Together, these three divisions provide Morgan Stanley with a well-diversified business model across key areas of the financial services industry.
The company recently reported its first-quarter 2026 results. Here’s a closer look at its performance and what analysts are forecasting for the stock.
The information in this article is provided for educational purposes only and does not constitute financial advice. Consult a financial advisor before making investment decisions.
- The Invest.MT5 Account allows you to buy real stocks and shares from some of the largest stock exchanges in the world.
- Risk Warning: Past performance is not a reliable indicator of future results or future performance. All trading is high risk, and you can lose more than you risk on a trade. Never invest more than you can afford to lose as some trades will lose and some trades will win. Start small to understand your own risk tolerance levels or practice on a demo account first to build your knowledge before investing.
- Trading is not suitable for everyone. Trading is highly speculative and carries a significant risk of loss. While it offers potential opportunities, it also involves high volatility, and leveraged trading can amplify both gains and losses. Retail investors should fully understand these risks before trading.

Morgan Stanley’s Q1 2026 Earnings Performance Summary
Key Takeaways
- Total net revenues reached $20.6 billion, up 16% year-on-year, driven primarily by strong growth in Institutional Securities and Wealth Management. Net income rose 29% YoY to $5.6 billion, while earnings per share came in at $3.43.
- Profitability improved alongside revenue growth. The firm's return on tangible common equity (ROTCE), a measure of how efficiently the business generates profit relative to its capital base, came in at 27.1%, compared with 23.0% in the same quarter a year ago.
- Segment-wise performance was mixed:
-
- Institutional Securities was the standout, with record net revenues of $10.7 billion (+19% YoY), driven by strength across investment banking, equities, and fixed income. Investment banking benefited from higher M&A activity, while equities were supported by strong client activity, and fixed income benefited from increased activity in commodities, especially in energy markets.
- Wealth Management segment reported record net revenues of $8.5 billion (+16% YoY), driven by strong net new assets of $118 billion, higher fee-based flows, and continued growth in lending.
- Investment Management was the one area that eased back slightly, with net revenues of $1.5 billion, down 4% YoY. The decline was driven by lower performance-based income from private funds.
- Management characterised the quarter as a strong one. Chief Executive Ted Pick noted that the results "affirm the capabilities of our Integrated Firm," pointing to robust global client engagement in Institutional Securities and continued momentum in Wealth Management.
- It is worth noting that the quarter included $178 million in severance costs related to a workforce reduction of approximately 2% of global staff, an action the firm described as focused on efficiency rather than any change in strategy.
Morgan Stanley’s 12-Month Analyst Stock Price Forecast
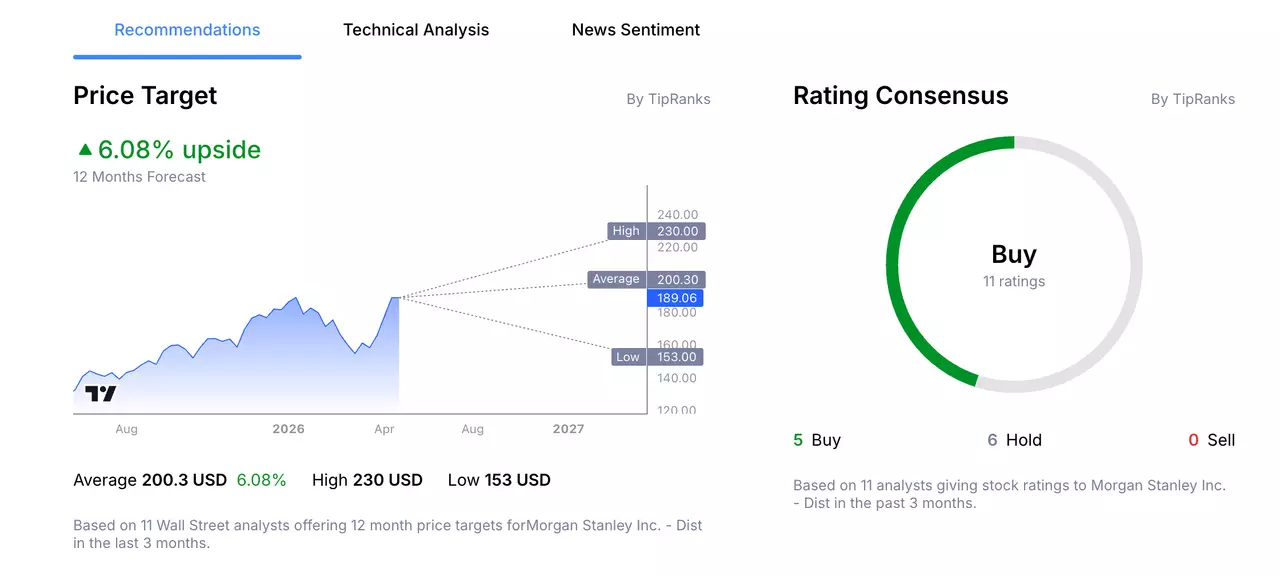
According to 11 Wall Street analysts, polled by TipRanks, offering a 12-month stock price forecast for Morgan Stanley over the past 3 months:
- Buy Ratings: 5
- Hold Ratings: 6
- Sell Ratings: 0
- Average Price Target: $200.3
- High Price Target: $230.00
- Low Price Target: $153.00
Trading Strategy Example: Morgan Stanley Inc.
The following trading examples are for educational purposes only and do not constitute investment advice. Investors should conduct independent research before making trading decisions. An example trading idea for the Morgan Stanley share price could be as follows:
Remember, markets are volatile, and Morgan Stanley's share price can fluctuate and may even trend lower. While the firm reported strong results this quarter, it is worth noting that a meaningful portion of its revenues remains linked to market conditions. If markets were to weaken for a sustained period, the value of assets the firm manages on behalf of clients would likely decline, and with it, the fee income those businesses generate.
Furthermore, interest rate movements, particularly those affecting lending margins and client activity, along with regulatory developments and shifts in the broader economic environment, are additional factors that may influence performance over time.
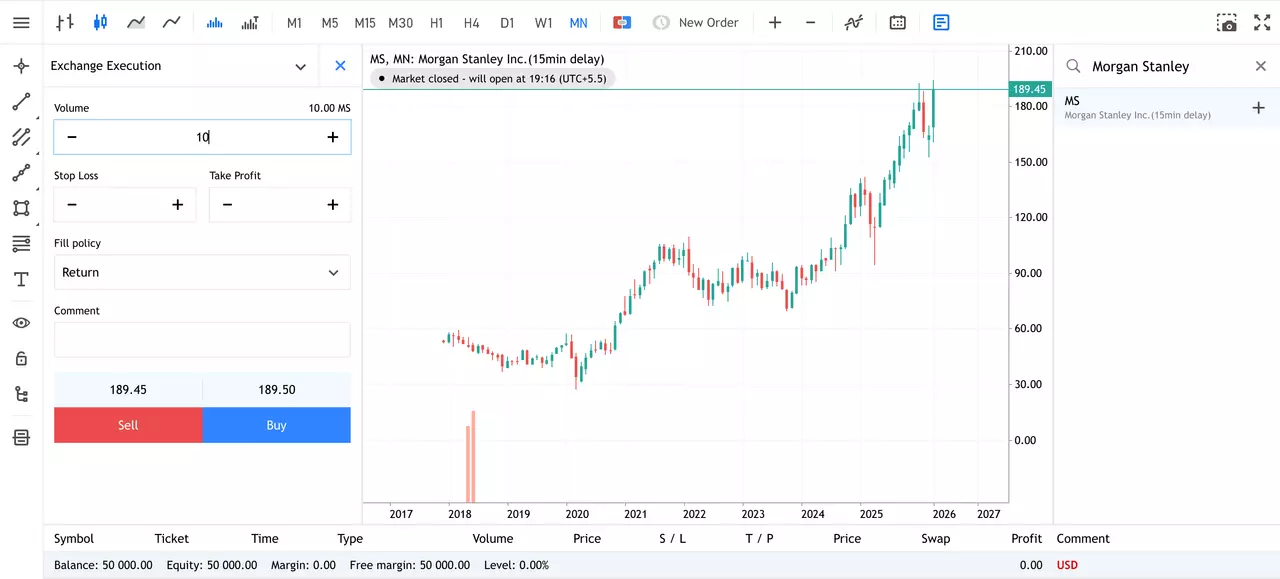
How to Buy Morgan Stanley Stock in 4 Steps
- Open an account with Admirals and complete the onboarding process to access the dashboard.
- Click on Trade or Invest on one of your live or demo accounts to open the web platform.
- Search for your stock in the search window at the top.
- Input your entry, stop-loss and take profit levels in the trading ticket.
Do You See the Morgan Stanley Stock Price Moving Differently?
If you believe there is a higher chance that the share price of Morgan Stanley will move lower, then you can also trade short using CFDs (Contracts for Difference). However, these have higher associated risks and are not suitable for all investors. Learn more about CFDs in this How to Trade CFDs article.
The given data provides additional information regarding all analysis, estimates, prognosis, forecasts, market reviews, weekly outlooks or other similar assessments or information (hereinafter “Analysis”) published on the websites of Admirals investment firms operating under the Admirals trademark (hereinafter “Admirals”) Before making any investment decisions please pay close attention to the following:
- This is a marketing communication. The content is published for informative purposes only and is in no way to be construed as investment advice or recommendation. It has not been prepared in accordance with legal requirements designed to promote the independence of investment research, and that it is not subject to any prohibition on dealing ahead of the dissemination of investment research.
- Any investment decision is made by each client alone whereas Admirals shall not be responsible for any loss or damage arising from any such decision, whether or not based on the content.
- With view to protecting the interests of our clients and the objectivity of the Analysis, Admirals has established relevant internal procedures for prevention and management of conflicts of interest.
- The Analysis is prepared by an analyst (hereinafter “Author”). The Author Clarice Mendonsa is a contractor for Admirals. This content is a marketing communication and does not constitute independent financial research.
- Whilst every reasonable effort is taken to ensure that all sources of the content are reliable and that all information is presented, as much as possible, in an understandable, timely, precise and complete manner, Admirals does not guarantee the accuracy or completeness of any information contained within the Analysis.
- Any kind of past or modelled performance of financial instruments indicated within the content should not be construed as an express or implied promise, guarantee or implication by Admirals for any future performance. The value of the financial instrument may both increase and decrease and the preservation of the asset value is not guaranteed.
- Leveraged products (including contracts for difference) are speculative in nature and may result in losses or profit. Before you start trading, please ensure that you fully understand the risks involved.