How to Trade Microsoft After Q3 2026 Earnings

Founded in 1975 and headquartered in Redmond, Washington, Microsoft Corporation (NASDAQ: MSFT) is one of the world's largest technology companies, operating across cloud computing, enterprise software, productivity tools, gaming, and artificial intelligence. Its products include the Azure cloud platform, the Microsoft 365 suite of productivity applications, LinkedIn, Dynamics 365, and the Xbox gaming ecosystem, serving both individual consumers and large enterprises globally.
The company recently reported its results for the third quarter of fiscal year 2026. Here is a closer look at its performance and what analysts are forecasting for the stock.
The information in this article is provided for educational purposes only and does not constitute financial advice. Consult a financial advisor before making investment decisions.
- The Invest.MT5 Account allows you to buy real stocks and shares from some of the largest stock exchanges in the world.
- Risk Warning: Past performance is not a reliable indicator of future results or future performance. All trading is high risk, and you can lose more than you risk on a trade. Never invest more than you can afford to lose as some trades will lose and some trades will win. Start small to understand your own risk tolerance levels or practice on a demo account first to build your knowledge before investing.
- Trading is not suitable for everyone. Trading is highly speculative and carries a significant risk of loss. While it offers potential opportunities, it also involves high volatility, and leveraged trading can amplify both gains and losses. Retail investors should fully understand these risks before trading.

Microsoft's Q3 2026 Earnings Performance Summary
Key Takeaways
- Total revenue reached $82.9 billion, up 18% year-on-year (YoY), driven by sustained demand for cloud and AI services. Microsoft Cloud revenue rose 29% YoY to $54.5 billion.
- Profitability improved across the board, with operating income up 20% YoY to $38.4 billion and net income rising 23% YoY to $31.8 billion. Diluted earnings per share (EPS) grew 23% YoY to $4.27.
- Performance across Microsoft's three segments was mixed:
- Productivity and Business Processes, which includes Microsoft 365, LinkedIn, and Dynamics 365, generated $35.0 billion in revenue, up 17% YoY. Within this, Microsoft 365 Consumer cloud revenue grew 33% YoY, Dynamics 365 rose 22% YoY, and LinkedIn increased 12% YoY.
- Intelligent Cloud, which houses Azure, posted $34.7 billion in revenue, up 30% YoY. Azure and other cloud services revenue grew 40% YoY.
- More Personal Computing, which covers Windows, Xbox, Surface, and Bing search, generated $13.2 billion in revenue, down 1% YoY. Windows OEM (Original Equipment Manufacturer) and Devices revenue declined 2% YoY, Xbox content and services fell 5% YoY, while search advertising revenue excluding traffic acquisition costs grew 12% YoY.
- On the outlook, management guided for capital expenditure (CapEx) of over $40 billion in the upcoming fiscal fourth quarter, with full-year calendar 2026 CapEx now expected to reach approximately $190 billion, well above the $154.6 billion analysts had anticipated heading into the print.
- Satya Nadella, Chairman and Chief Executive Officer of Microsoft, framed the quarter around the company's AI momentum. He said: "We are focused on delivering cloud and AI infrastructure and solutions that empower every business to eval-max their outcomes in the agentic computing era." Amy Hood, Executive Vice President and Chief Financial Officer, added: "We delivered results that exceeded expectations across revenue, operating income, and earnings per share, reflecting strong execution and growing demand for the Microsoft Cloud."
Source: Microsoft FY26 Q3 Press Release and Earnings Conference Call
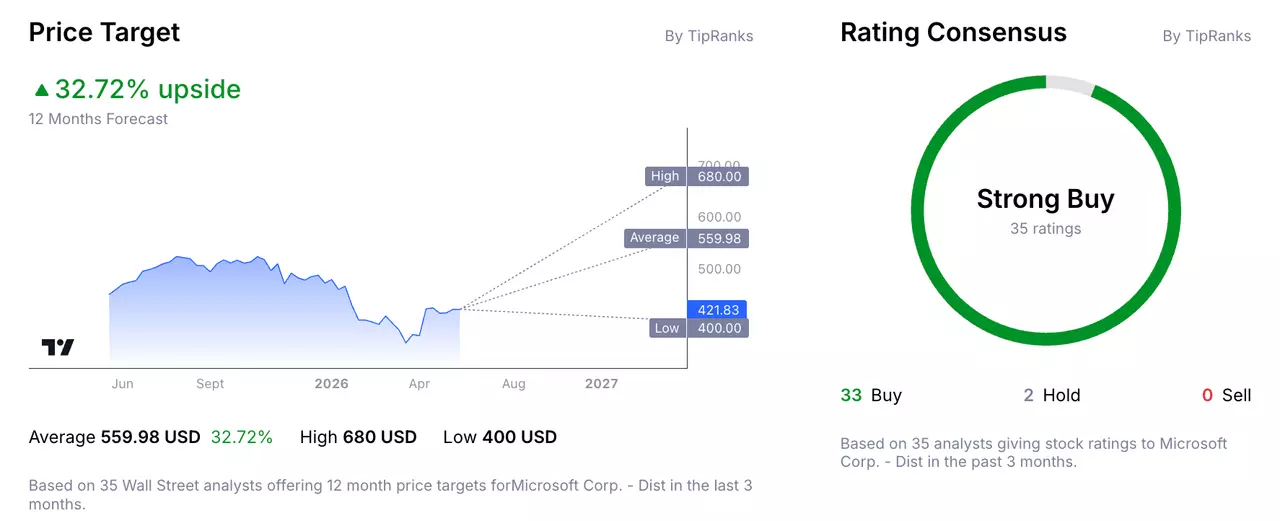
Microsoft’s 12-Month Analyst Stock Price Forecast
According to 35 Wall Street analysts, polled by TipRanks, offering a 12-month stock price forecast for Microsoft over the past 3 months:
- Buy Ratings: 33
- Hold Ratings: 2
- Sell Ratings: 0
- Average Price Target: $559.98
- High Price Target: $680.00
- Low Price Target: $400.00
Trading Strategy Example: Microsoft Corp.
The following trading examples are for educational purposes only and do not constitute investment advice. Investors should conduct independent research before making trading decisions. An example trading idea for the Microsoft share price could be as follows:
Remember, markets are volatile, and Microsoft’s share price can fluctuate and may even trend lower.
While the company delivered a strong quarter, the stock still fell in the session following the results. Broader concerns have weighed on the share price in 2026, including questions over the returns on Microsoft's substantial AI infrastructure spending.
Furthermore, management stated it expects to invest roughly $190 billion in capital expenditure for calendar year 2026, well above what analysts had anticipated, raising concerns about the pressure this places on free cash flow. Free cash flow for the quarter, the cash generated after capital spending, declined 22% YoY to $15.8 billion, even as reported profits rose sharply.
More broadly, Microsoft operates in a rapidly evolving and increasingly competitive environment across cloud and AI, where execution risk, regulatory scrutiny, and the pace of return on infrastructure investment could all influence the stock's trajectory in either direction.
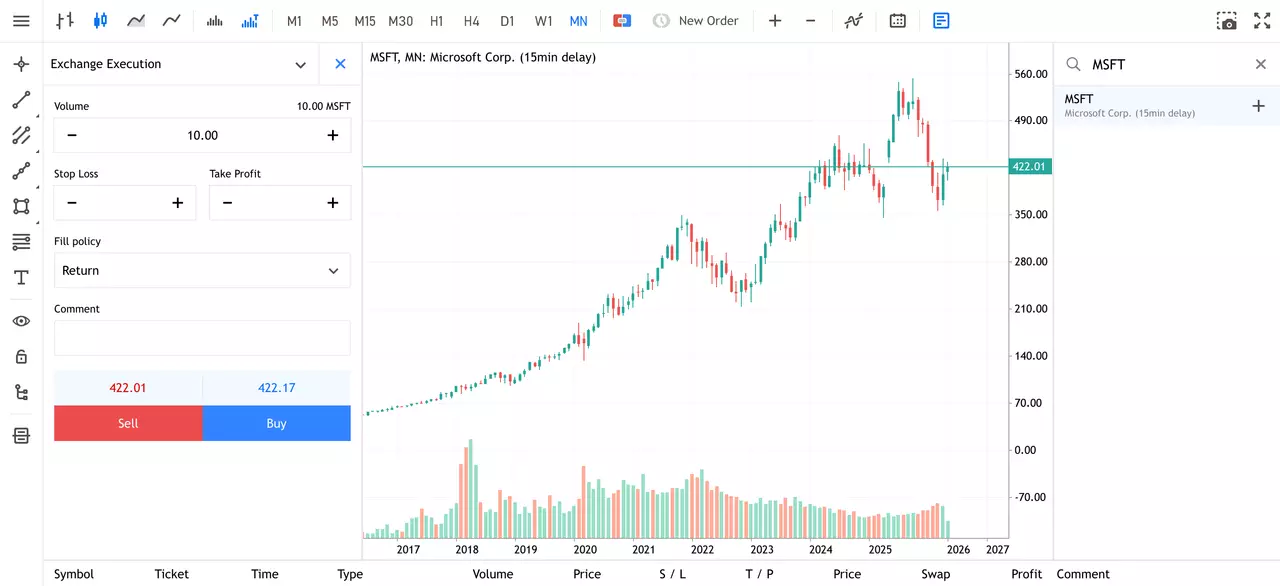
How to Buy Microsoft Stock in 4 Steps
- Open an account with Admirals and complete the onboarding process to access the dashboard.
- Click on Trade or Invest on one of your live or demo accounts to open the web platform.
- Search for your stock in the search window at the top.
- Input your entry, stop-loss and take profit levels in the trading ticket.
Do You See the Microsoft Stock Price Moving Differently?
If you believe there is a higher chance that the share price of Microsoft will move lower, then you can also trade short using CFDs (Contracts for Difference). However, these have higher associated risks and are not suitable for all investors. Learn more about CFDs in this How to Trade CFDs article.
The given data provides additional information regarding all analysis, estimates, prognosis, forecasts, market reviews, weekly outlooks or other similar assessments or information (hereinafter “Analysis”) published on the websites of Admirals investment firms operating under the Admirals trademark (hereinafter “Admirals”) Before making any investment decisions please pay close attention to the following:
- This is a marketing communication. The content is published for informative purposes only and is in no way to be construed as investment advice or recommendation. It has not been prepared in accordance with legal requirements designed to promote the independence of investment research, and that it is not subject to any prohibition on dealing ahead of the dissemination of investment research.
- Any investment decision is made by each client alone whereas Admirals shall not be responsible for any loss or damage arising from any such decision, whether or not based on the content.
- With view to protecting the interests of our clients and the objectivity of the Analysis, Admirals has established relevant internal procedures for prevention and management of conflicts of interest.
- The Analysis is prepared by an analyst (hereinafter “Author”). The Author Clarice Mendonsa is a contractor for Admirals. This content is a marketing communication and does not constitute independent financial research.
- Whilst every reasonable effort is taken to ensure that all sources of the content are reliable and that all information is presented, as much as possible, in an understandable, timely, precise and complete manner, Admirals does not guarantee the accuracy or completeness of any information contained within the Analysis.
- Any kind of past or modelled performance of financial instruments indicated within the content should not be construed as an express or implied promise, guarantee or implication by Admirals for any future performance. The value of the financial instrument may both increase and decrease and the preservation of the asset value is not guaranteed.
- Leveraged products (including contracts for difference) are speculative in nature and may result in losses or profit. Before you start trading, please ensure that you fully understand the risks involved.